HR Analytics: R로 직원 이탈 예측하기
Abhishek Trehan
People Analytics Practitioner
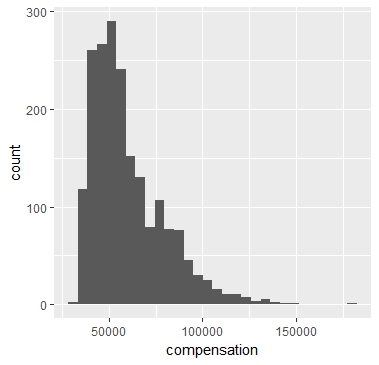
# Plot the distribution of compensation
ggplot(emp_tenure, aes(x = compensation)) +
geom_histogram()
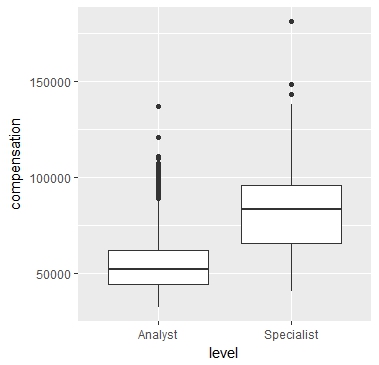
# Plot the distribution of compensation across levels
ggplot(emp_tenure,
aes(x = level, y = compensation)) +
geom_boxplot()
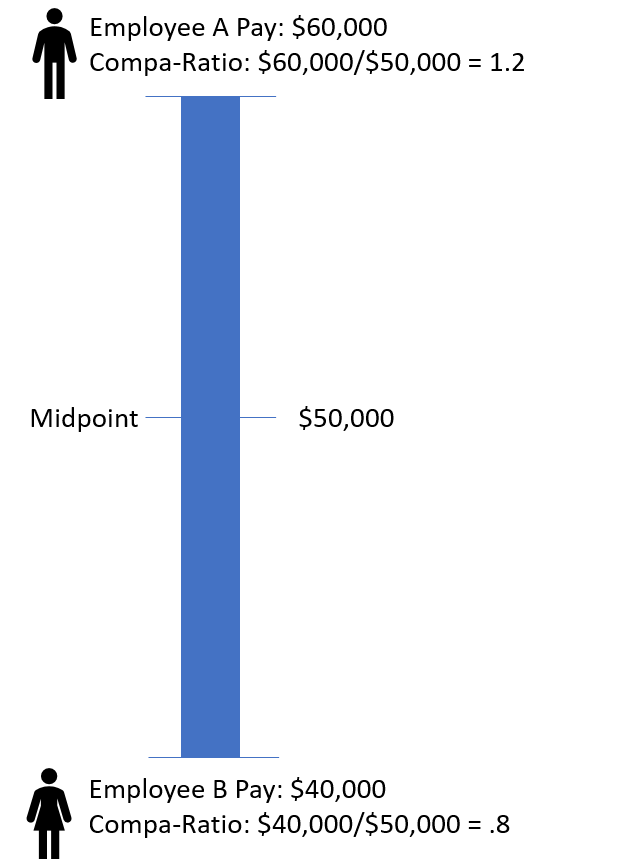
$$ \text{Compa Ratio} = \frac{\text{ Actual Compensation }}{\text{Median Compensation}} $$
Compa-ratio 1.2 (120%): 중위 급여 대비 20% 초과 지급
Compa-ratio 1.0 (100%): 중위 급여와 동일
Compa-ratio 0.8 (80%): 중위 급여 대비 20% 미만 지급

# Derive Compa-ratio
emp_compa_ratio <- emp_tenure %>%
group_by(level) %>%
mutate(median_compensation = median(compensation),
compa_ratio = (compensation / median_compensation))
# Look at the median compensation for each level
emp_compa_ratio %>%
distinct(level, median_compensation)
# A tibble: 2 x 2
# Groups: level[2]
level median_compensation
<fct> <dbl>
1 Analyst 51840
2 Specialist 83496
HR Analytics: R로 직원 이탈 예측하기