Julia로 시작하는 데이터 시각화
Gustavo Vieira Suñe
Data Analyst


| Date | State | Centre | Product | Price |
|---|---|---|---|---|
| APR-2001 | Andhra Pradesh | Chittoor | Bathing Soap | 10.0 |
| APR-2001 | Andhra Pradesh | Chittoor | Ink | 10.0 |
| ... | ... | ... | ... | ... |
| SEP-2016 | Bihar | Patna | Paper | 38.0 |
| SEP-2016 | Bihar | Patna | Toothpaste | 50.0 |
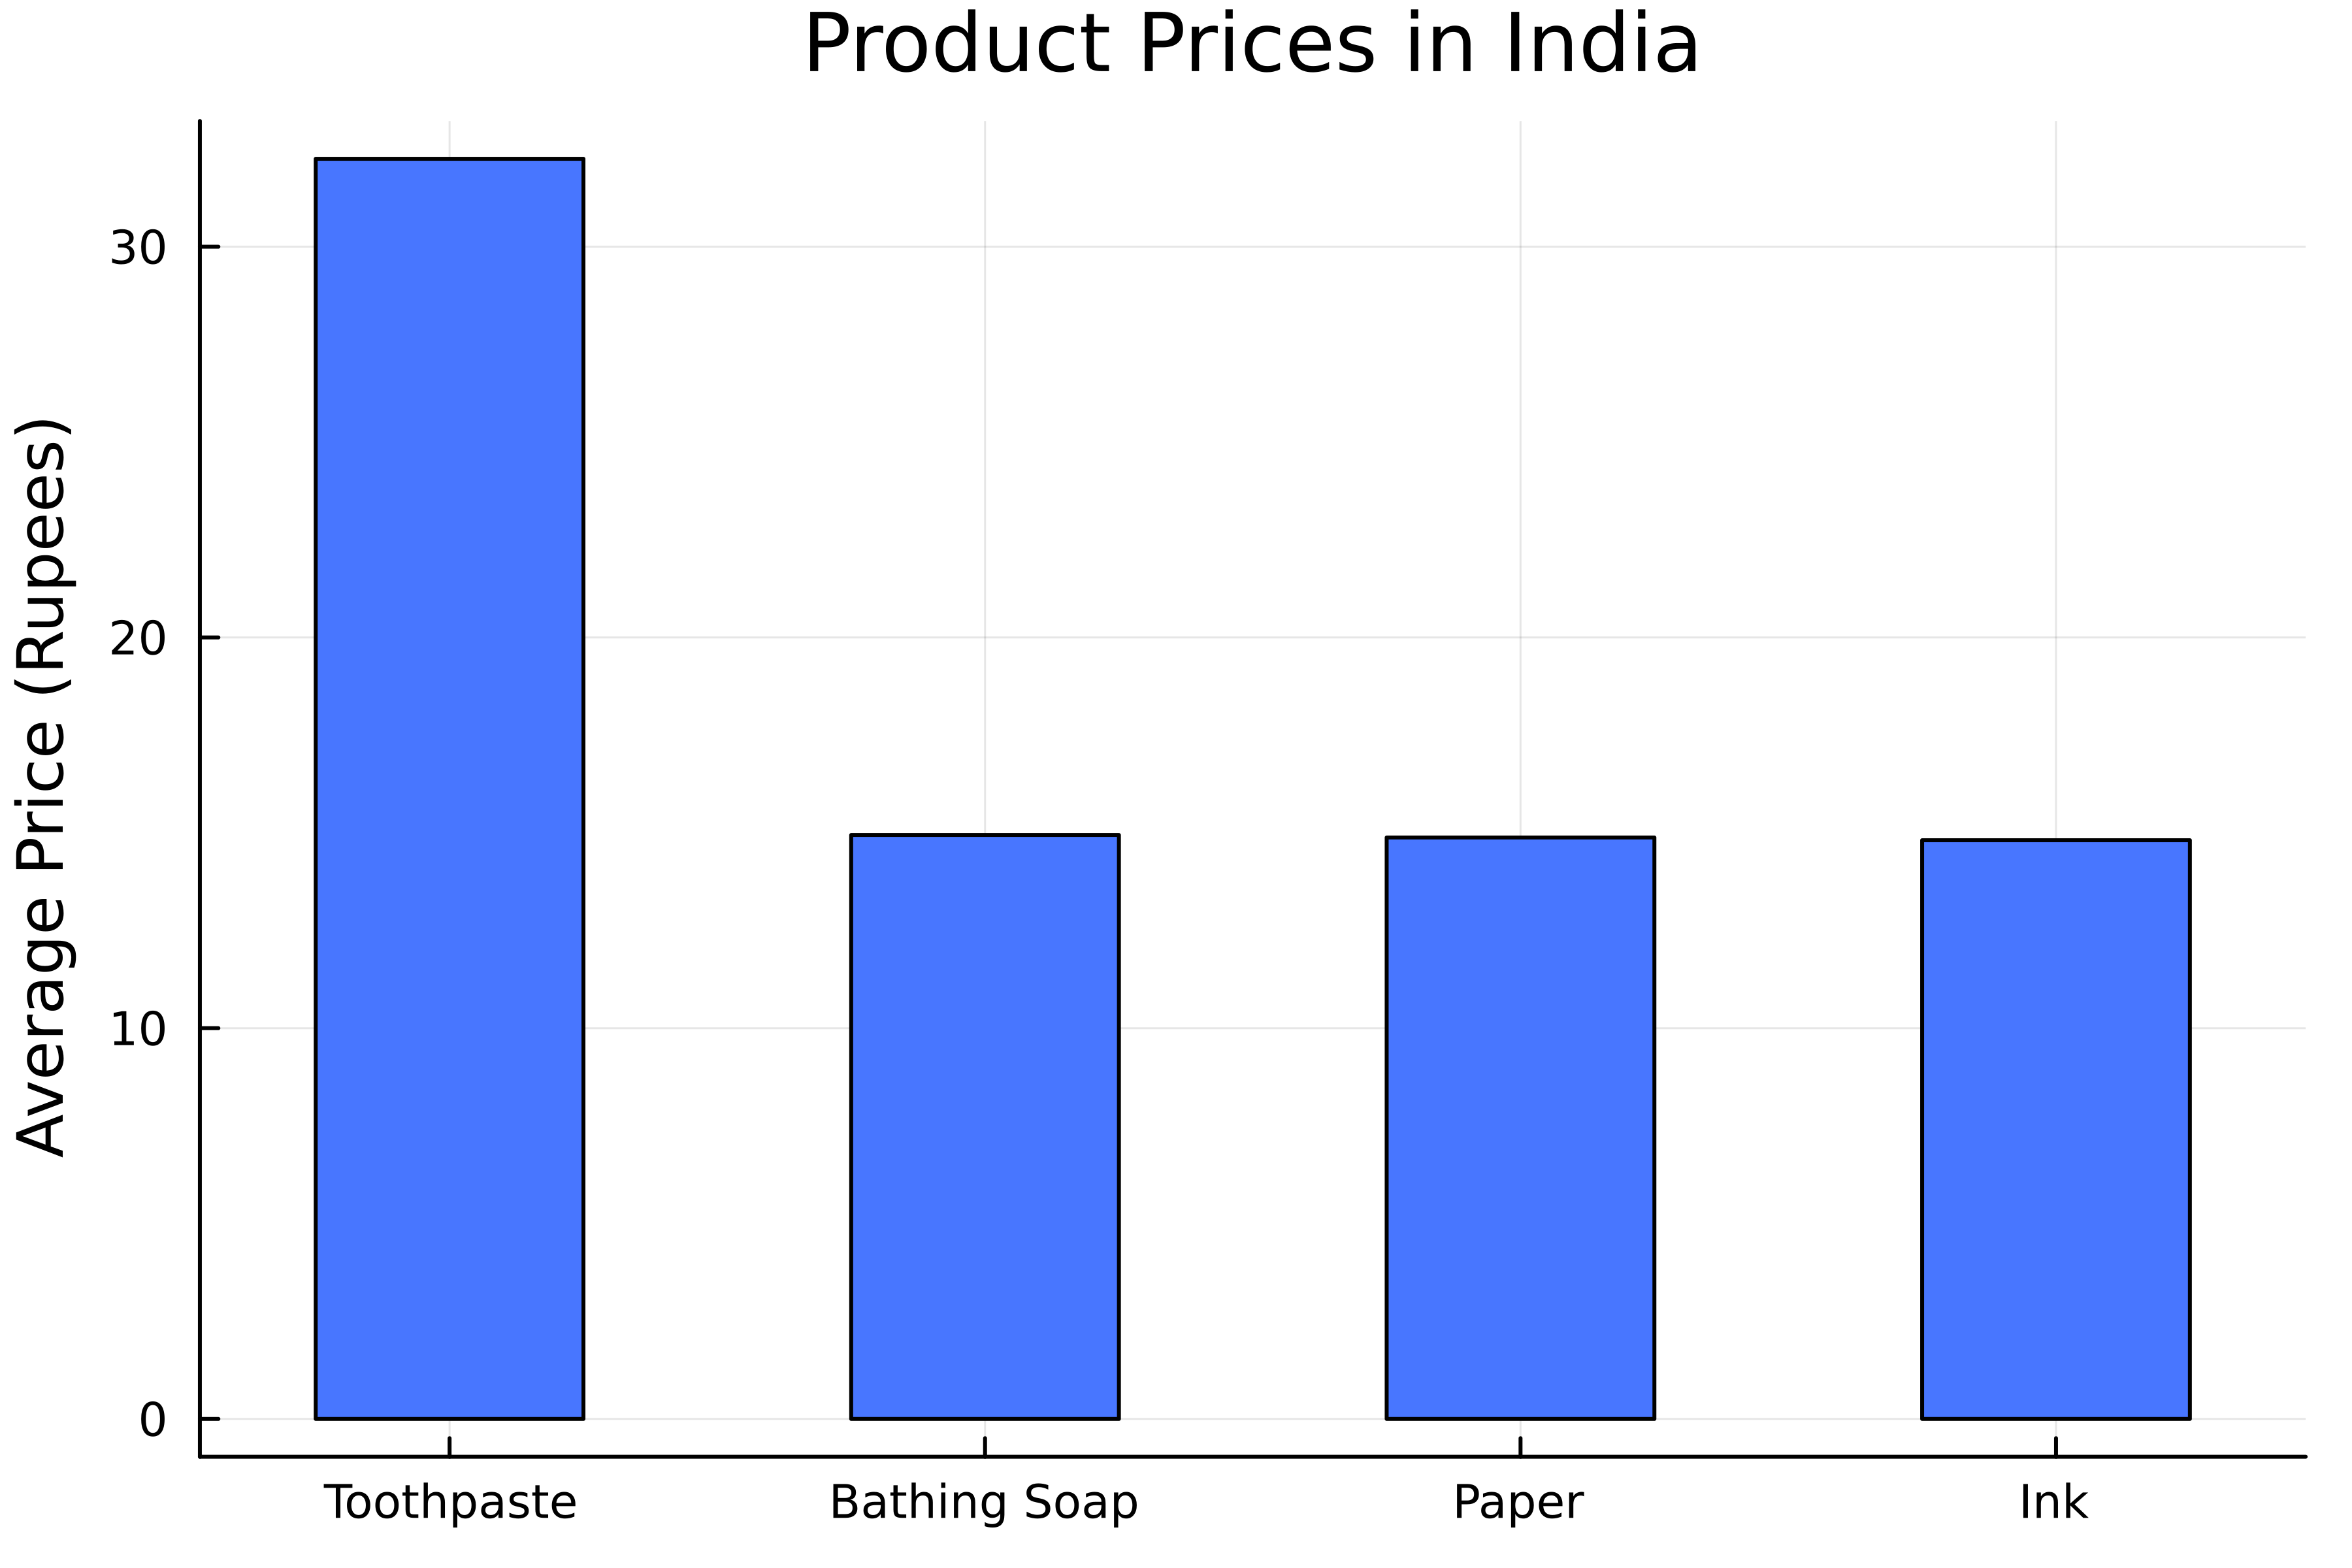
using Statistics)# 제품별 그룹화 grouped = groupby(product, :Product)# 평균 가격 계산 mean_prices = combine( grouped, :Price => mean )# 높은 값부터 정렬 sorted_mean_prices = sort( mean_prices, :Price_mean, rev=true )
# 막대그래프 생성 bar( # x축 범주 sorted_mean_prices.Product, # y축 값 sorted_mean_prices.Price_mean,# 막대 너비 설정 bar_width=0.5label=false, color=:royalblue1, ) title!("인도 제품 가격") ylabel!("평균 가격(루피)")

# 막대 그래프 생성 bar( # y축 값 sorted_mean_prices.Product, # x축 값 sorted_mean_prices.Price_mean,# 가로 방향 설정 permute=(:x, :y),label=false, color=:royalblue1, ) title!("인도 제품 가격") xlabel!("평균 가격(루피)")

filtered_product = filter(
row -> row.State in ["Maharashtra", "Goa", "Gujarat"],
product)
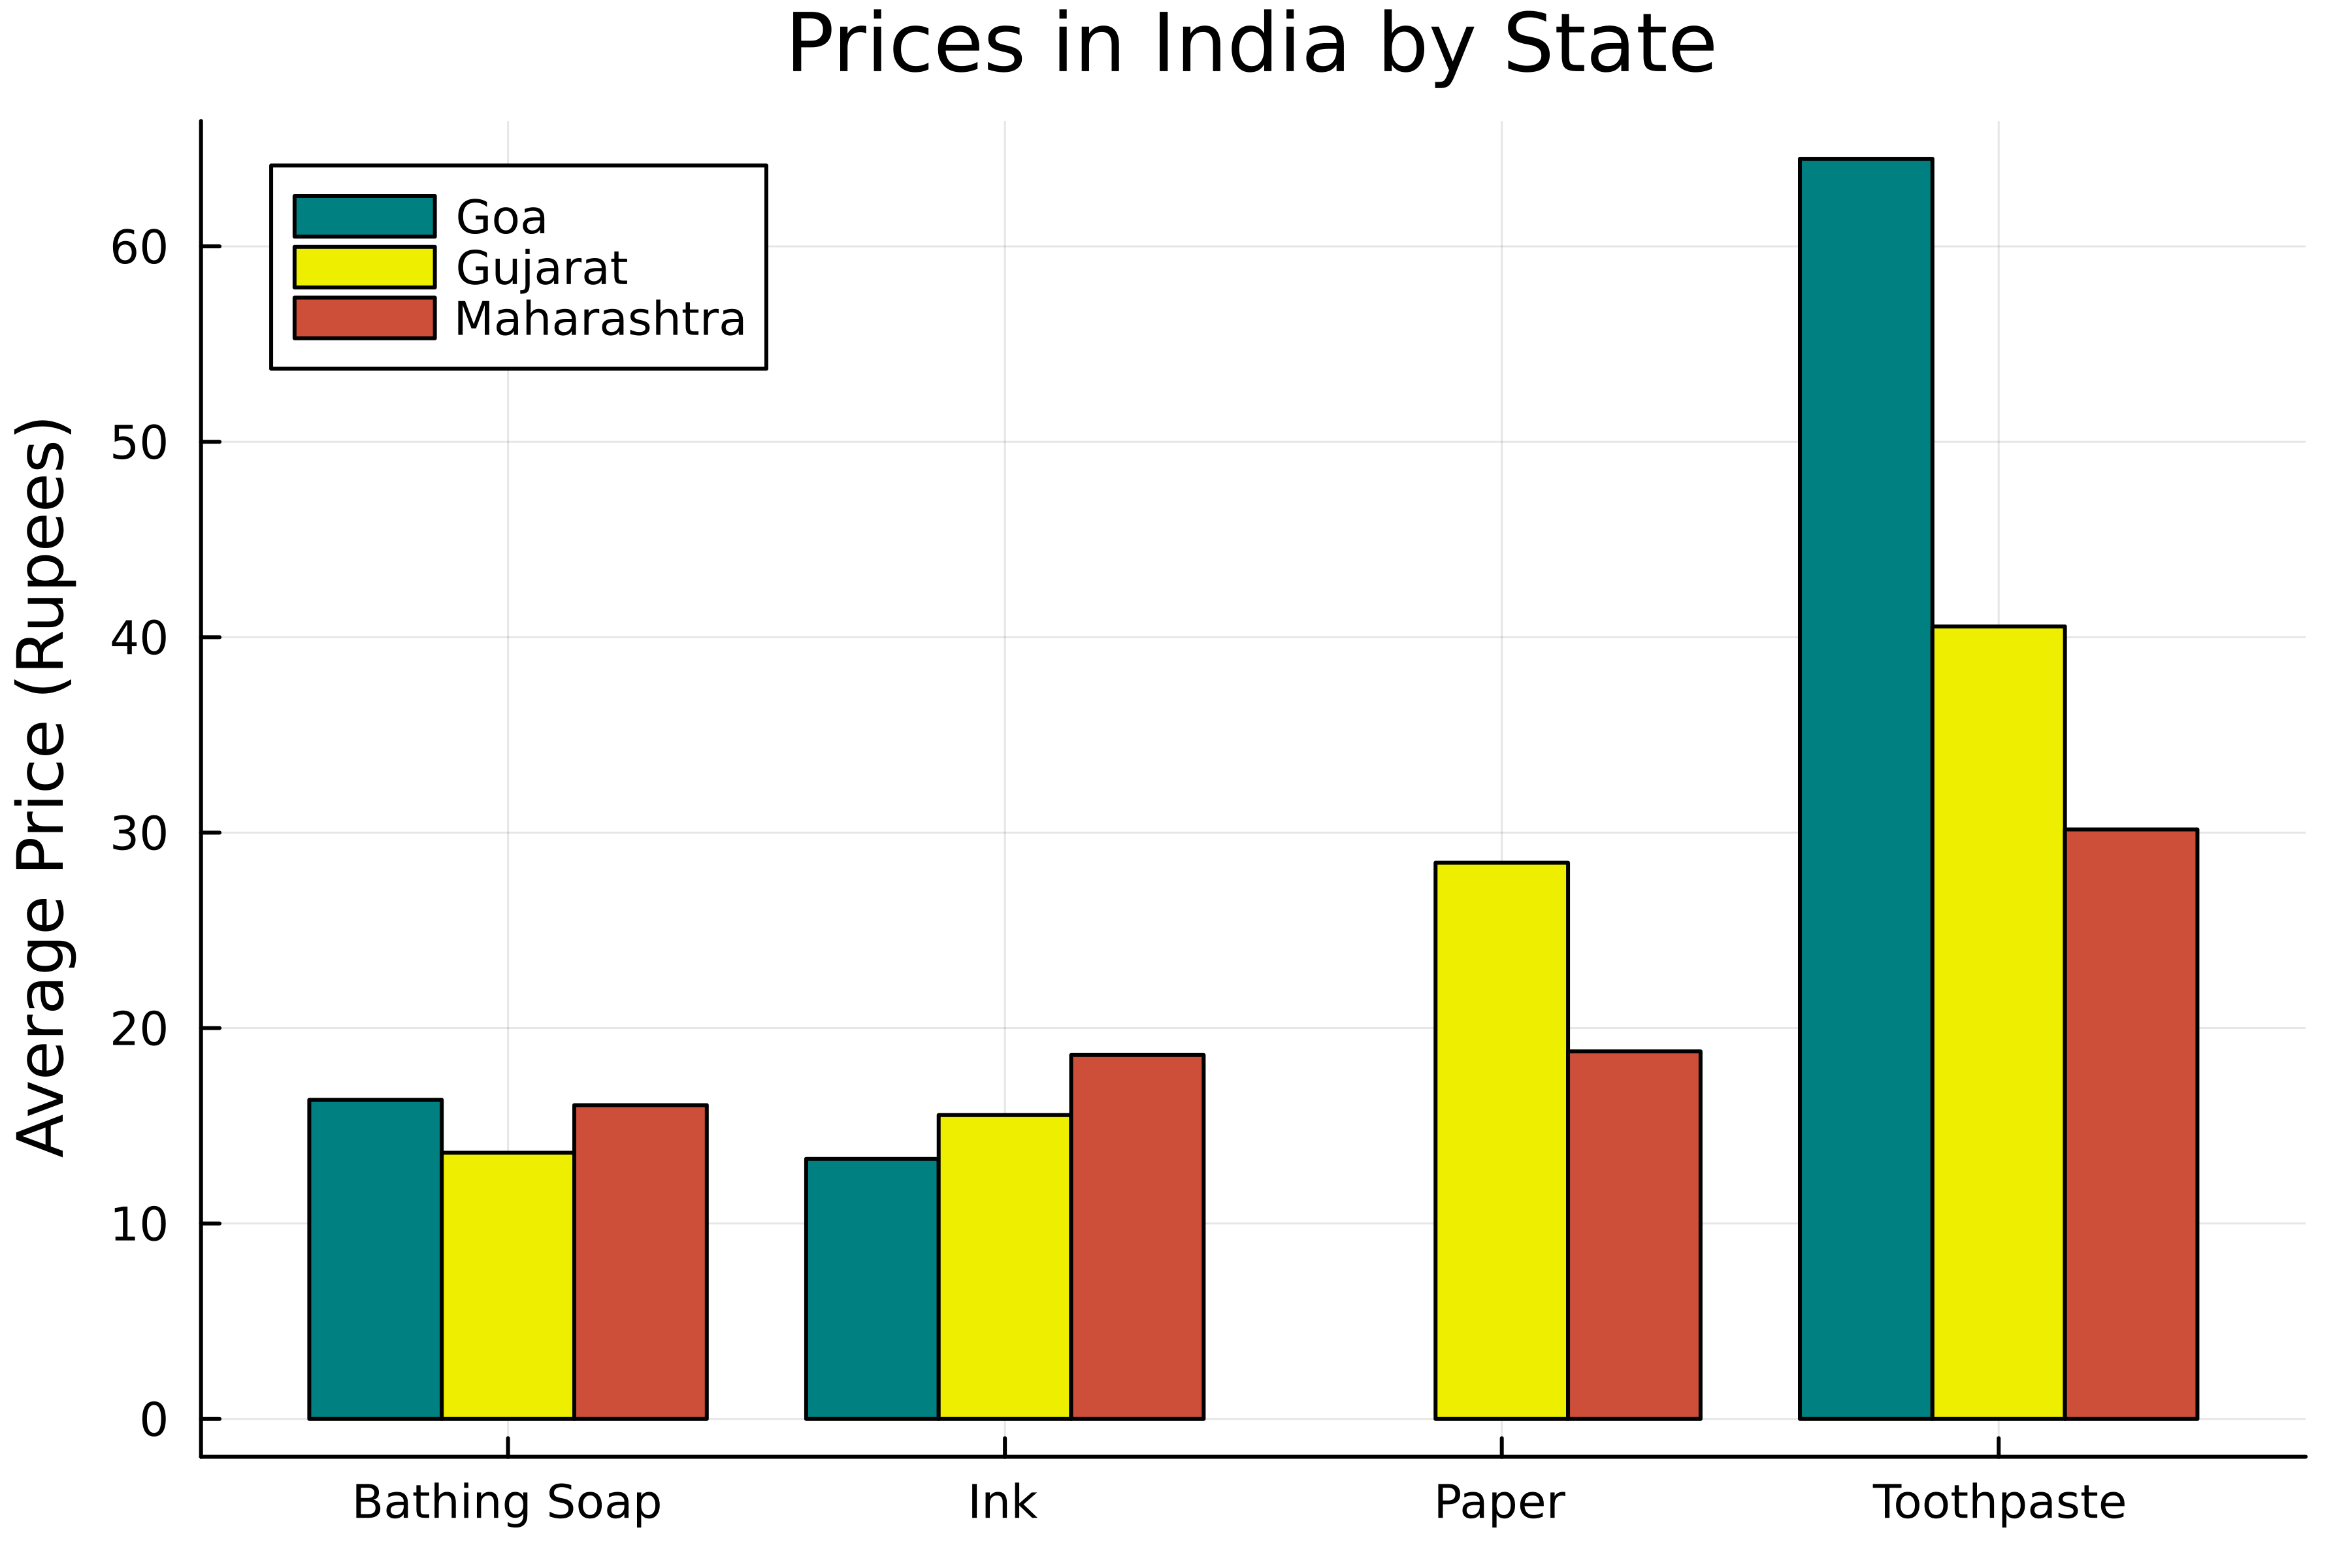
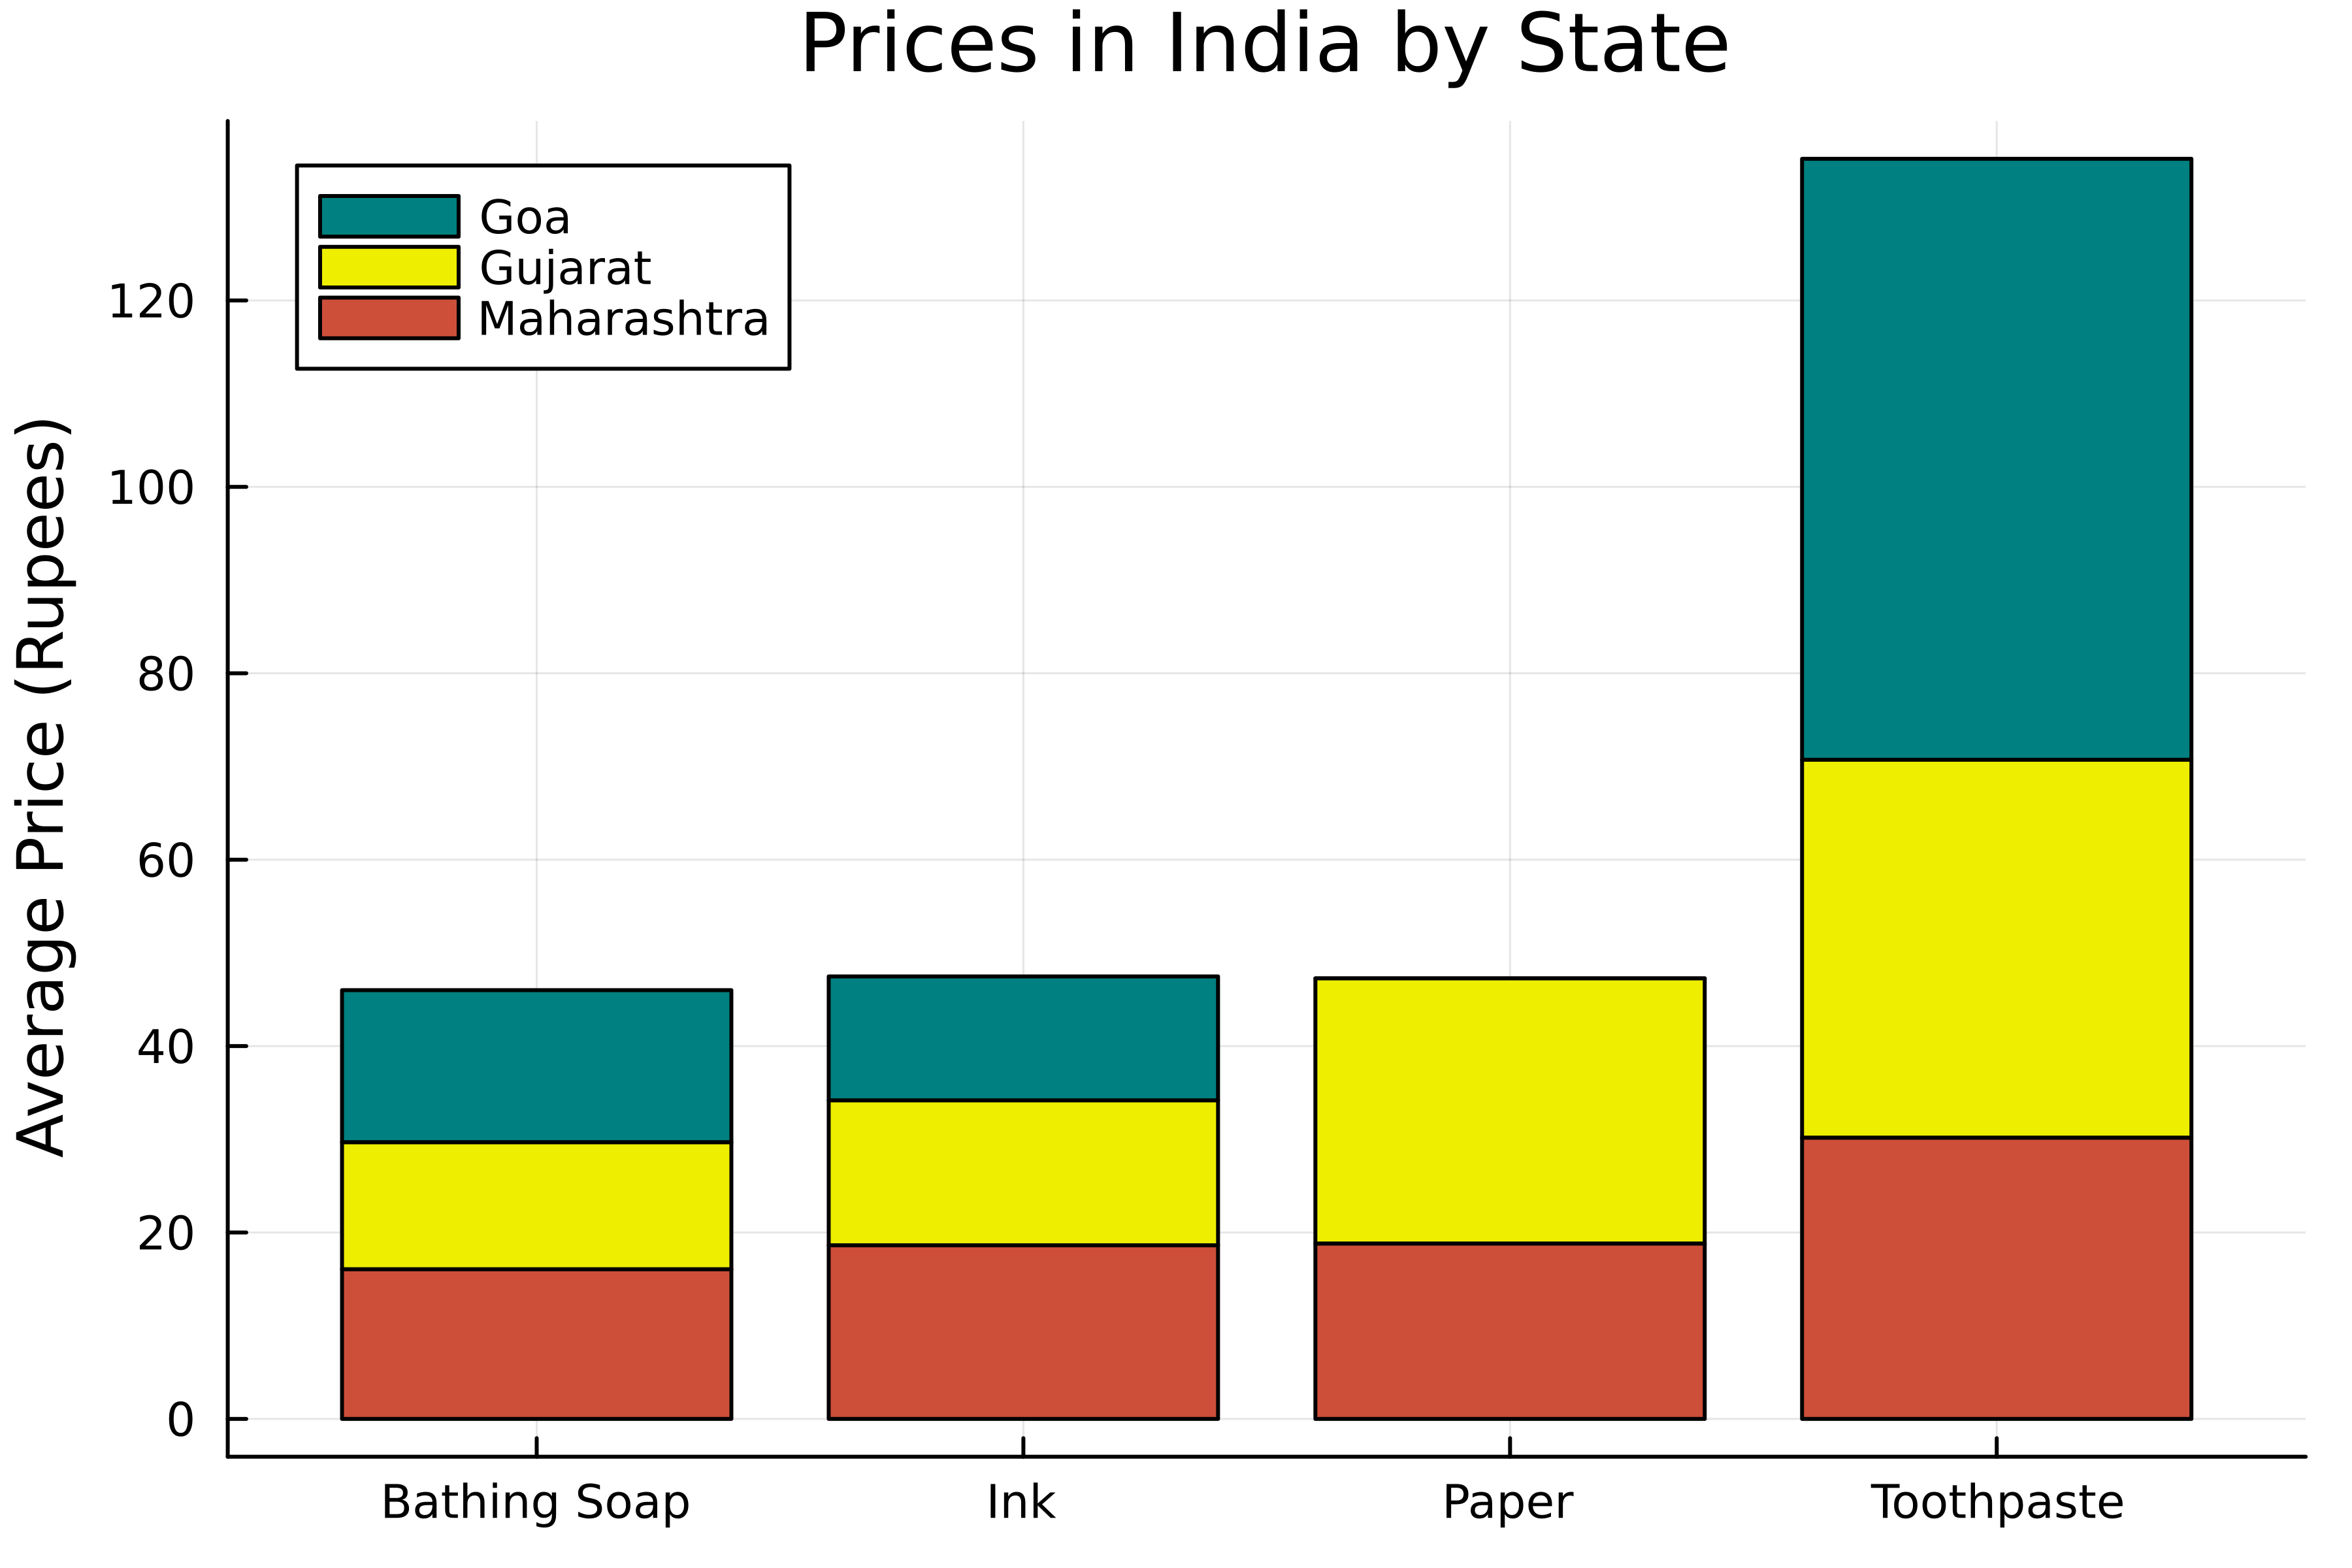
# 주와 제품으로 그룹화 filtered_grouped = groupby(filtered_product, [:State, :Product])# 평균 가격 계산 filtered_mean_prices = combine( filtered_grouped, :Price => mean )
# 그룹 막대그래프 생성 groupedbar( # x축 범주 filtered_mean_prices.Commodity, # y축 값 filtered_mean_prices.Price_mean,# 그룹 지정 group=filtered_mean_prices.State,color=[:teal :yellow2 :tomato3] ) title!("인도 주별 가격") ylabel!("평균 가격(루피)")

# 그룹 막대그래프 생성 groupedbar( # x축 범주 filtered_mean_prices.Commodity, # y축 값 filtered_mean_prices.Price_mean, # 그룹 지정 group=filtered_mean_prices.State, color=[:teal :snow2 :tomato3],# 막대 쌓기 bar_position=:stack) title!("인도 주별 제품 가격") ylabel!("평균 가격(루피)")

Julia로 시작하는 데이터 시각화