Julia로 시작하는 데이터 시각화
Gustavo Vieira Suñe
Data Analyst
using Pkg


Pkg.add("Plots")
using Pkg
Pkg.add("Plots")
using Plots
using CSV, DataFrames
using Plots


# 데이터 불러오기
fund = DataFrame(CSV.File("fund.csv"))


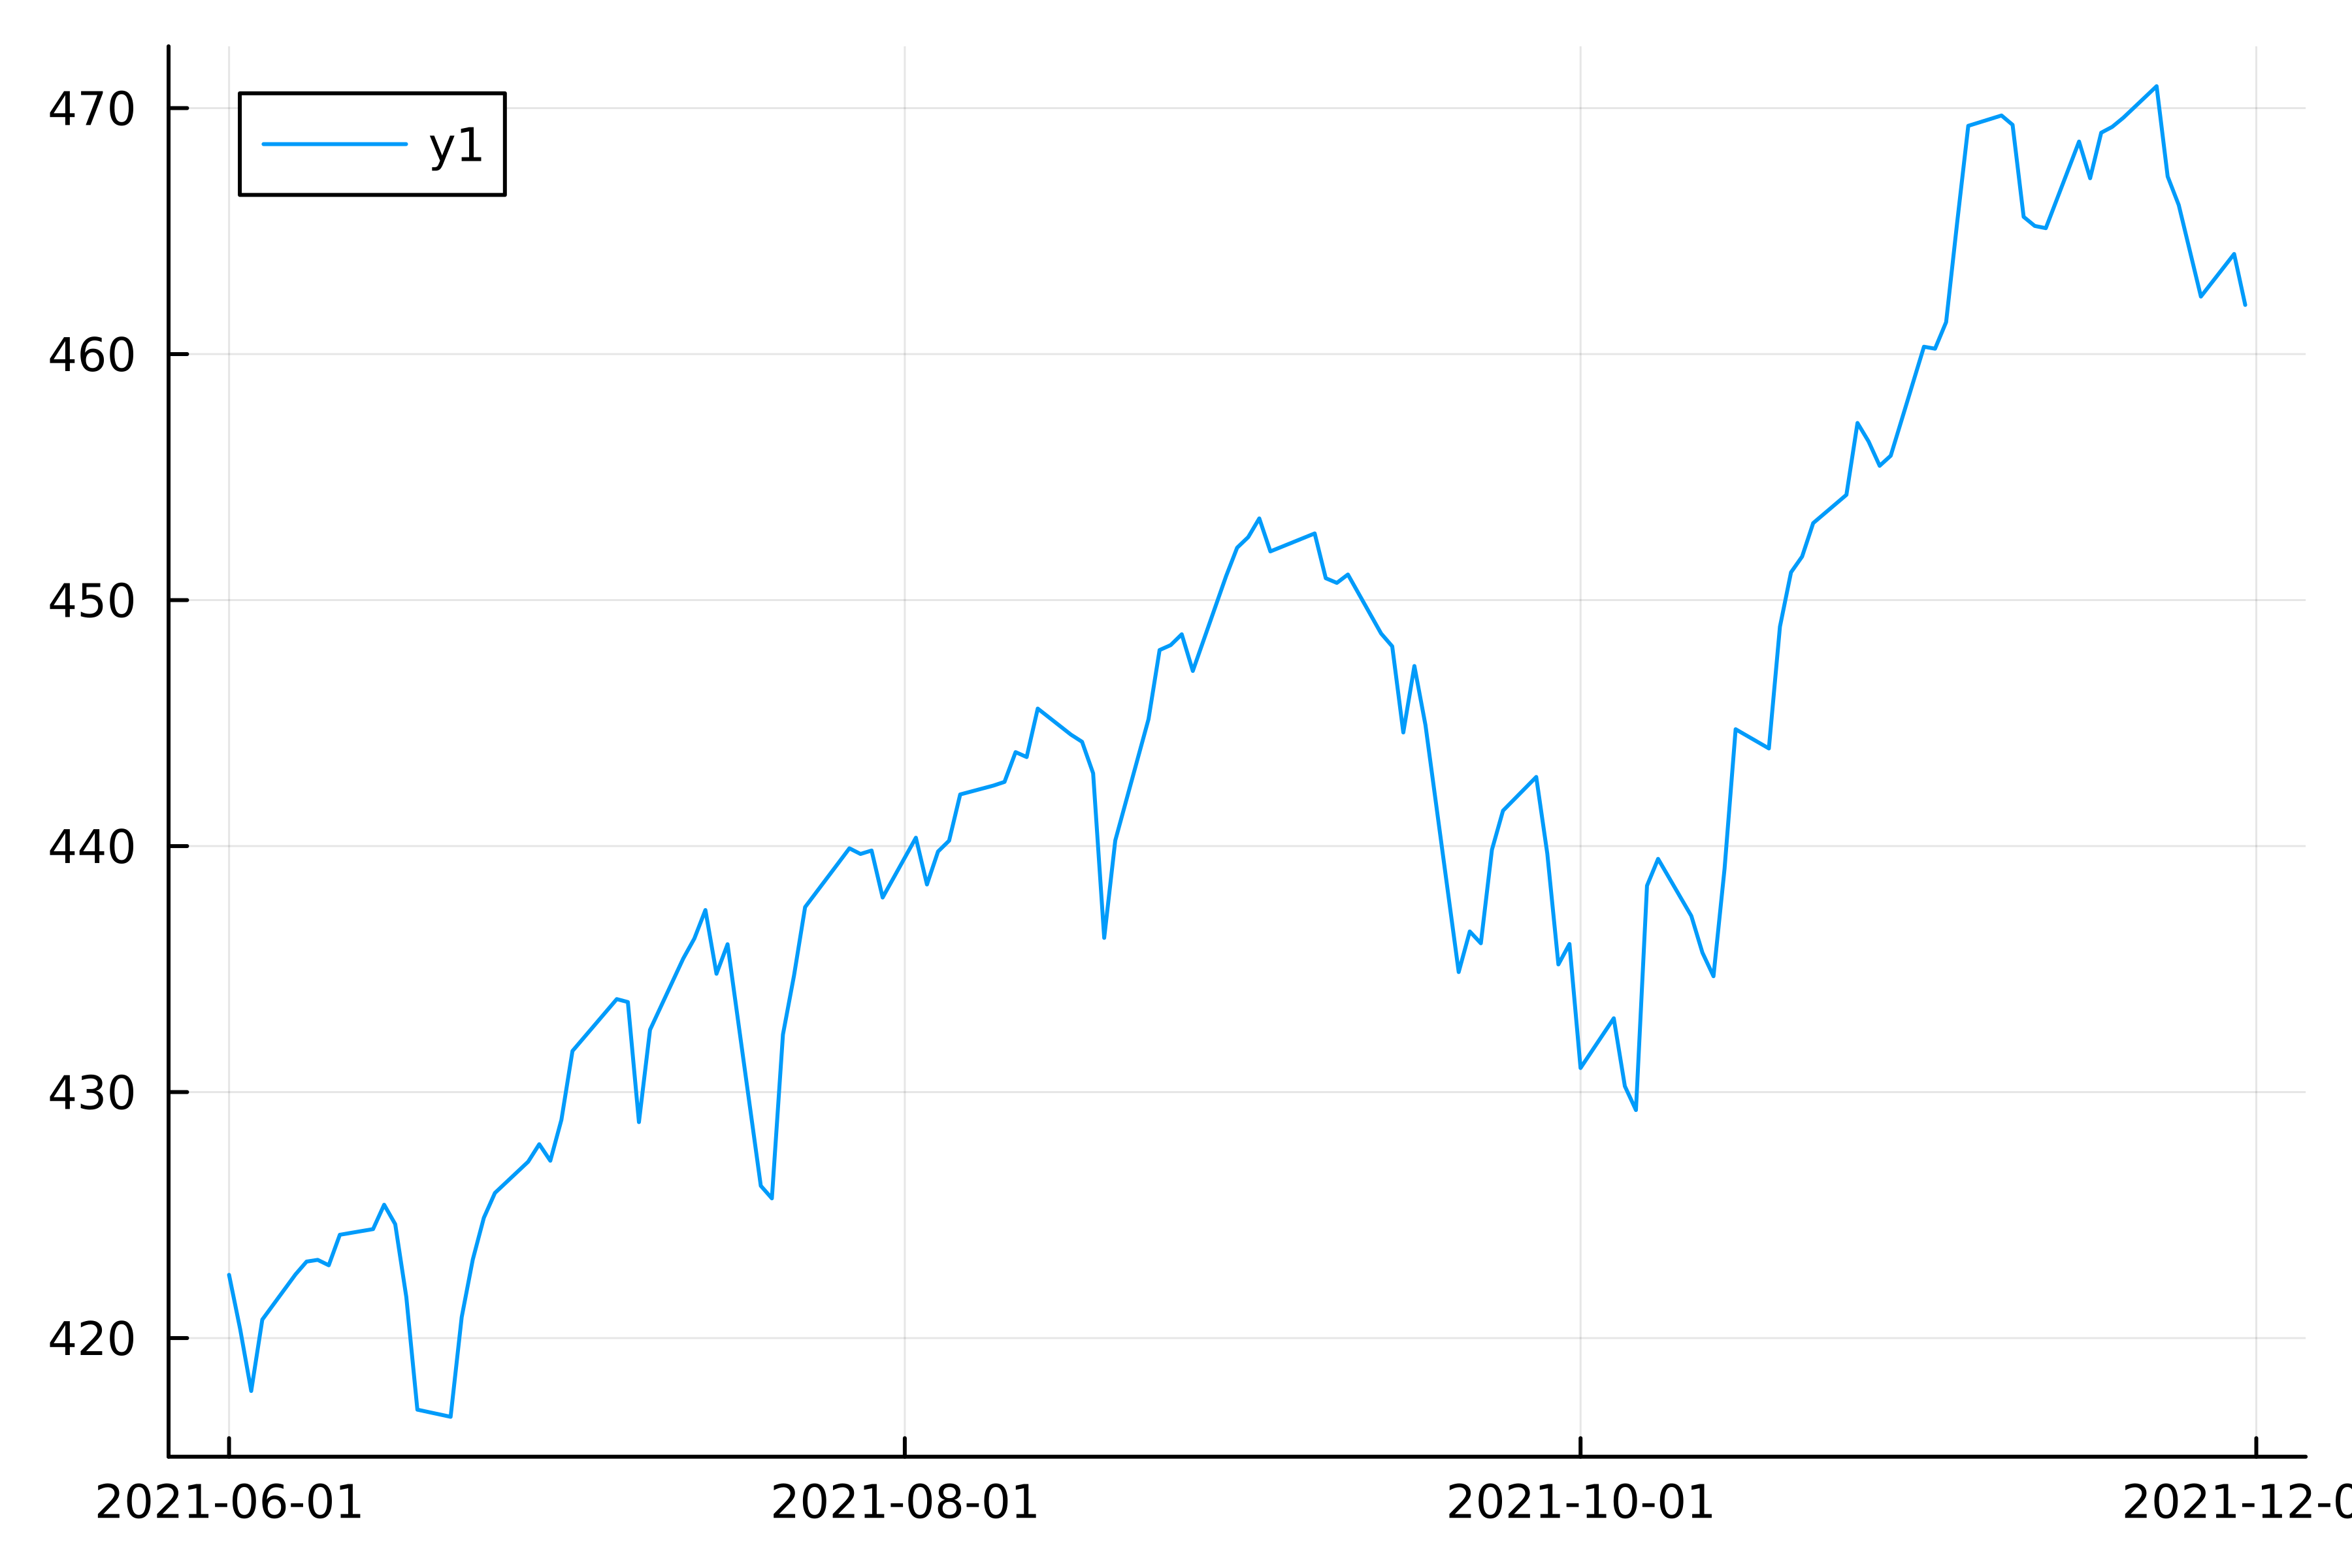
# 시간에 따른 가격 그리기
plot(
    # x축 값
    fund.price_date,
    # y축 값
    fund.open,
)
using CSV, DataFrames using Plots
# 데이터 불러오기 fund = DataFrame(CSV.File("fund.csv"))
# 시간에 따른 가격 그리기 plot( # x축 값 fund.price_date, # y축 값 fund.open, )
using CSV, DataFrames
using Plots

# 데이터 불러오기
fund = DataFrame(CSV.File("fund.csv"))


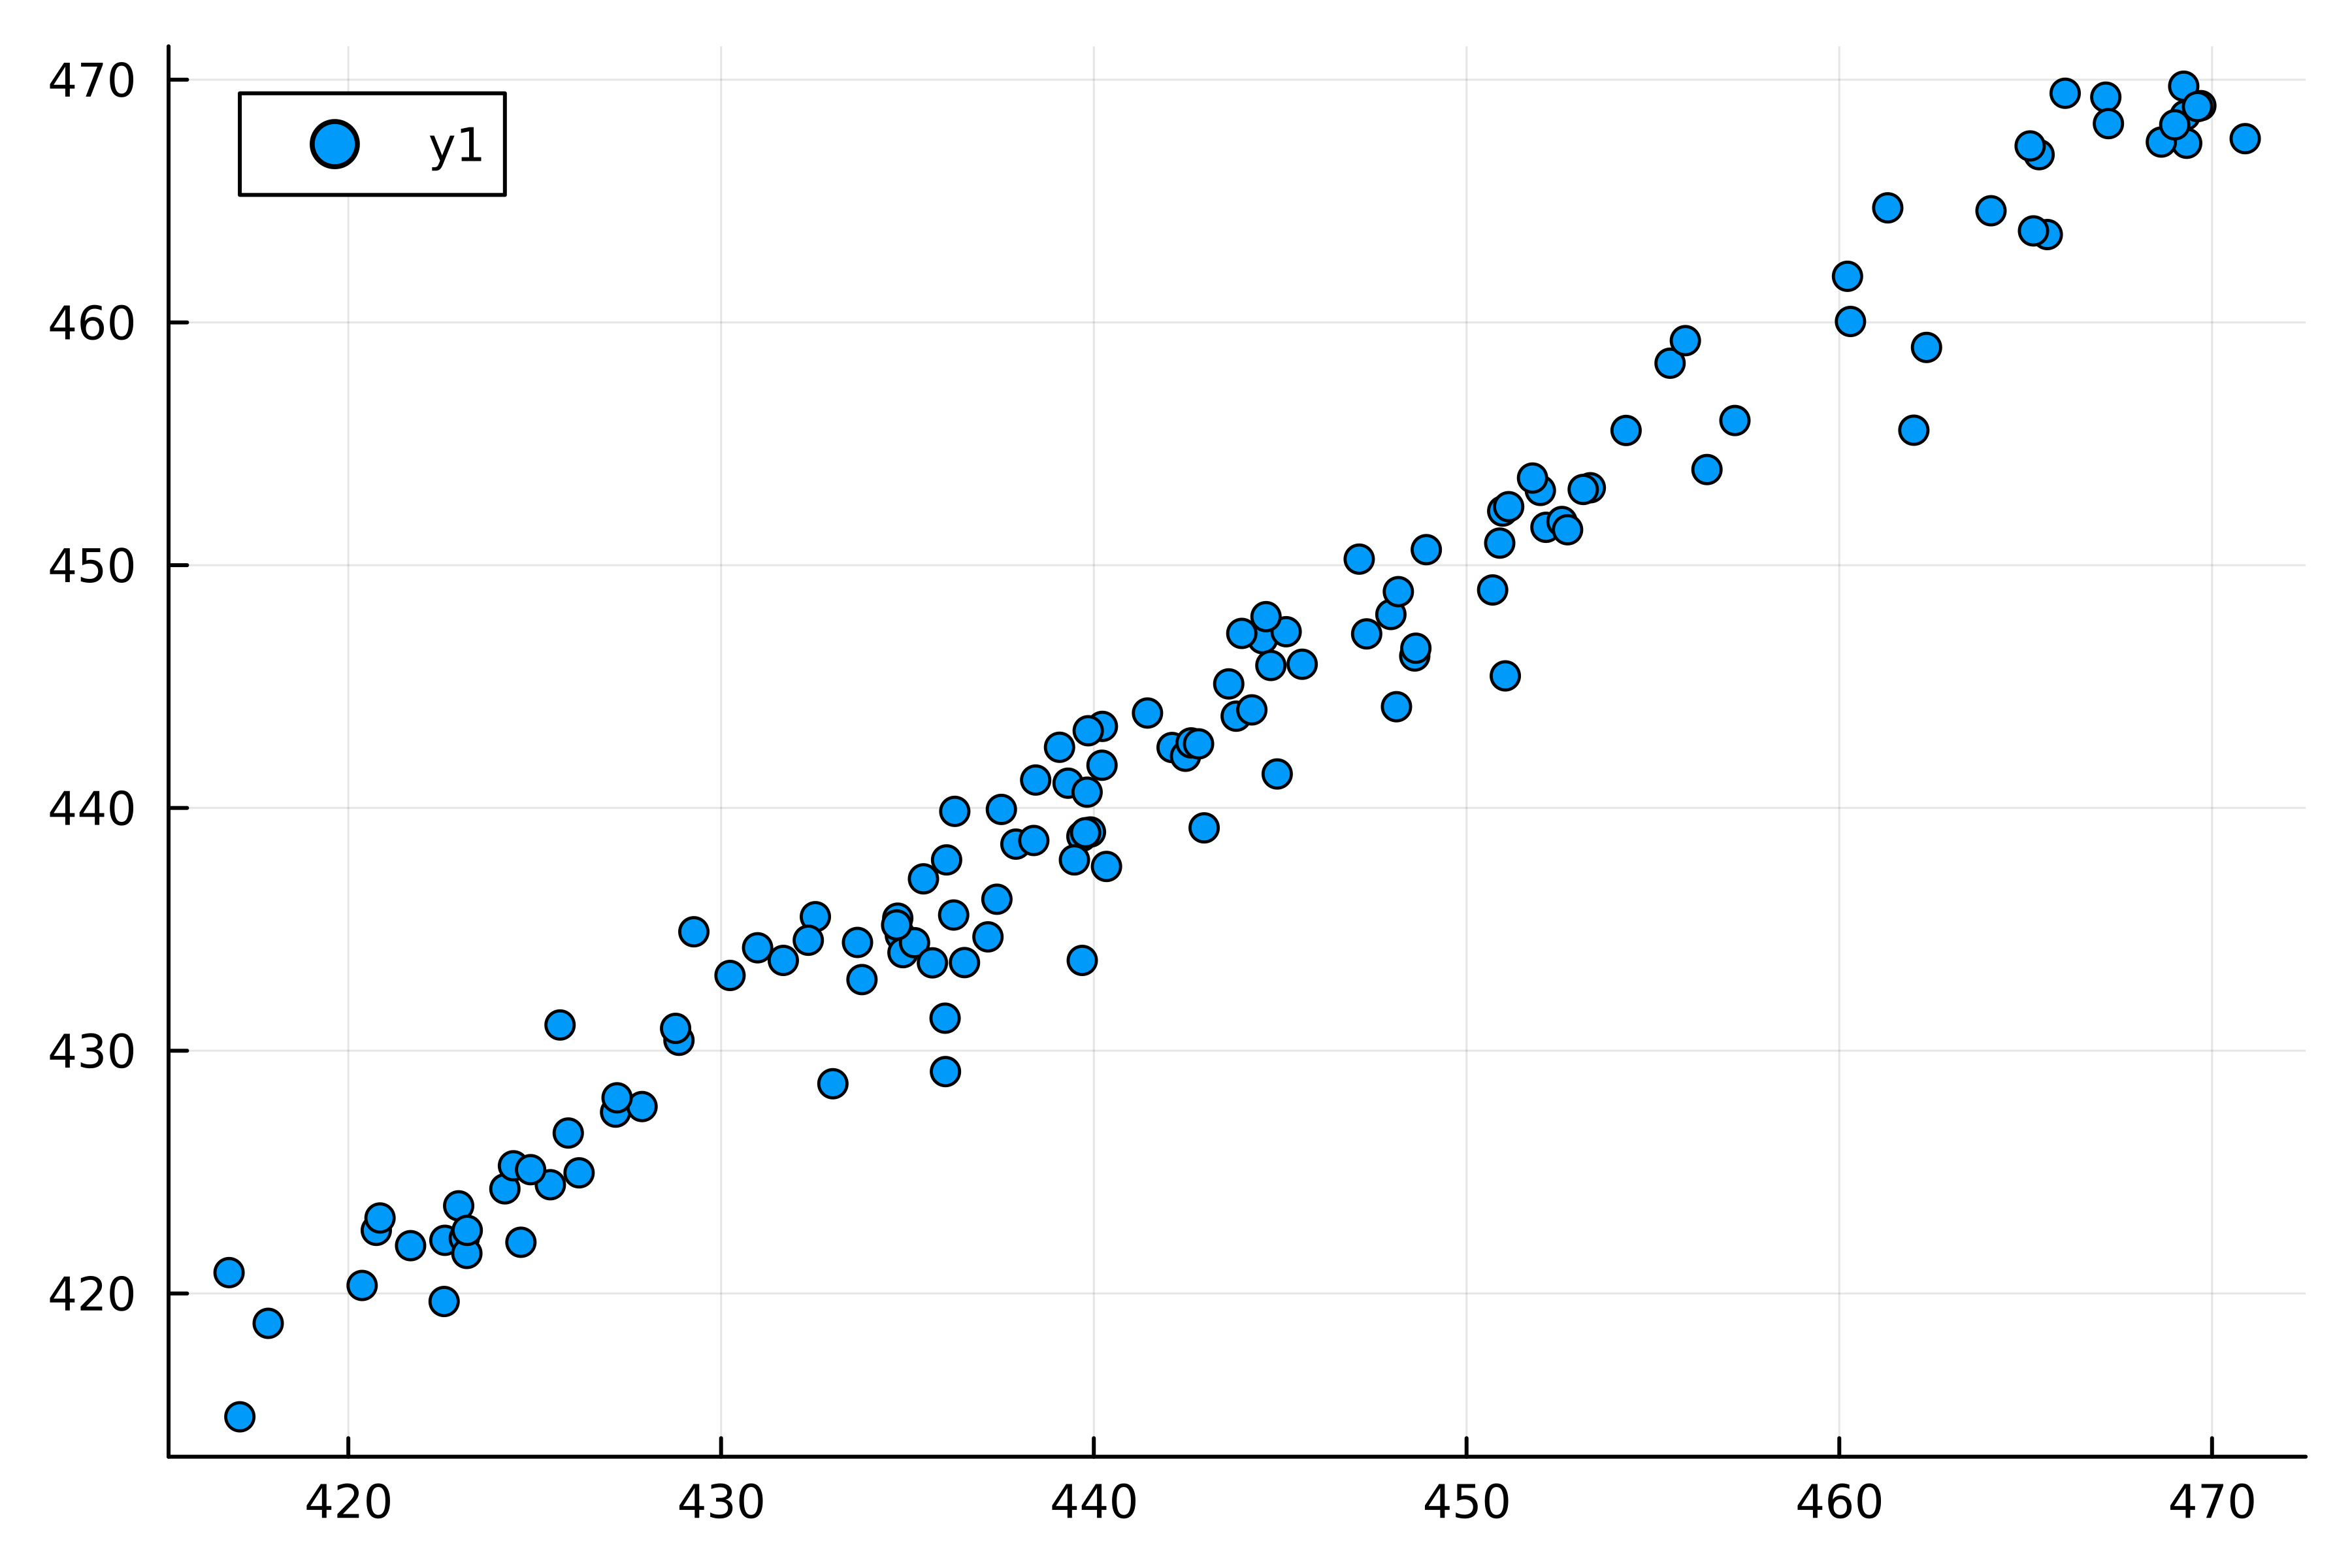
# 시가와 종가 산점도
scatter(
    # x축 값
    fund.open,
    # x축 값
    fund.close,
)
using CSV, DataFrames using Plots # 데이터 불러오기 fund = DataFrame(CSV.File("fund.csv"))
# 시가와 종가 산점도 scatter( # x축 값 fund.open, # x축 값 fund.close, )
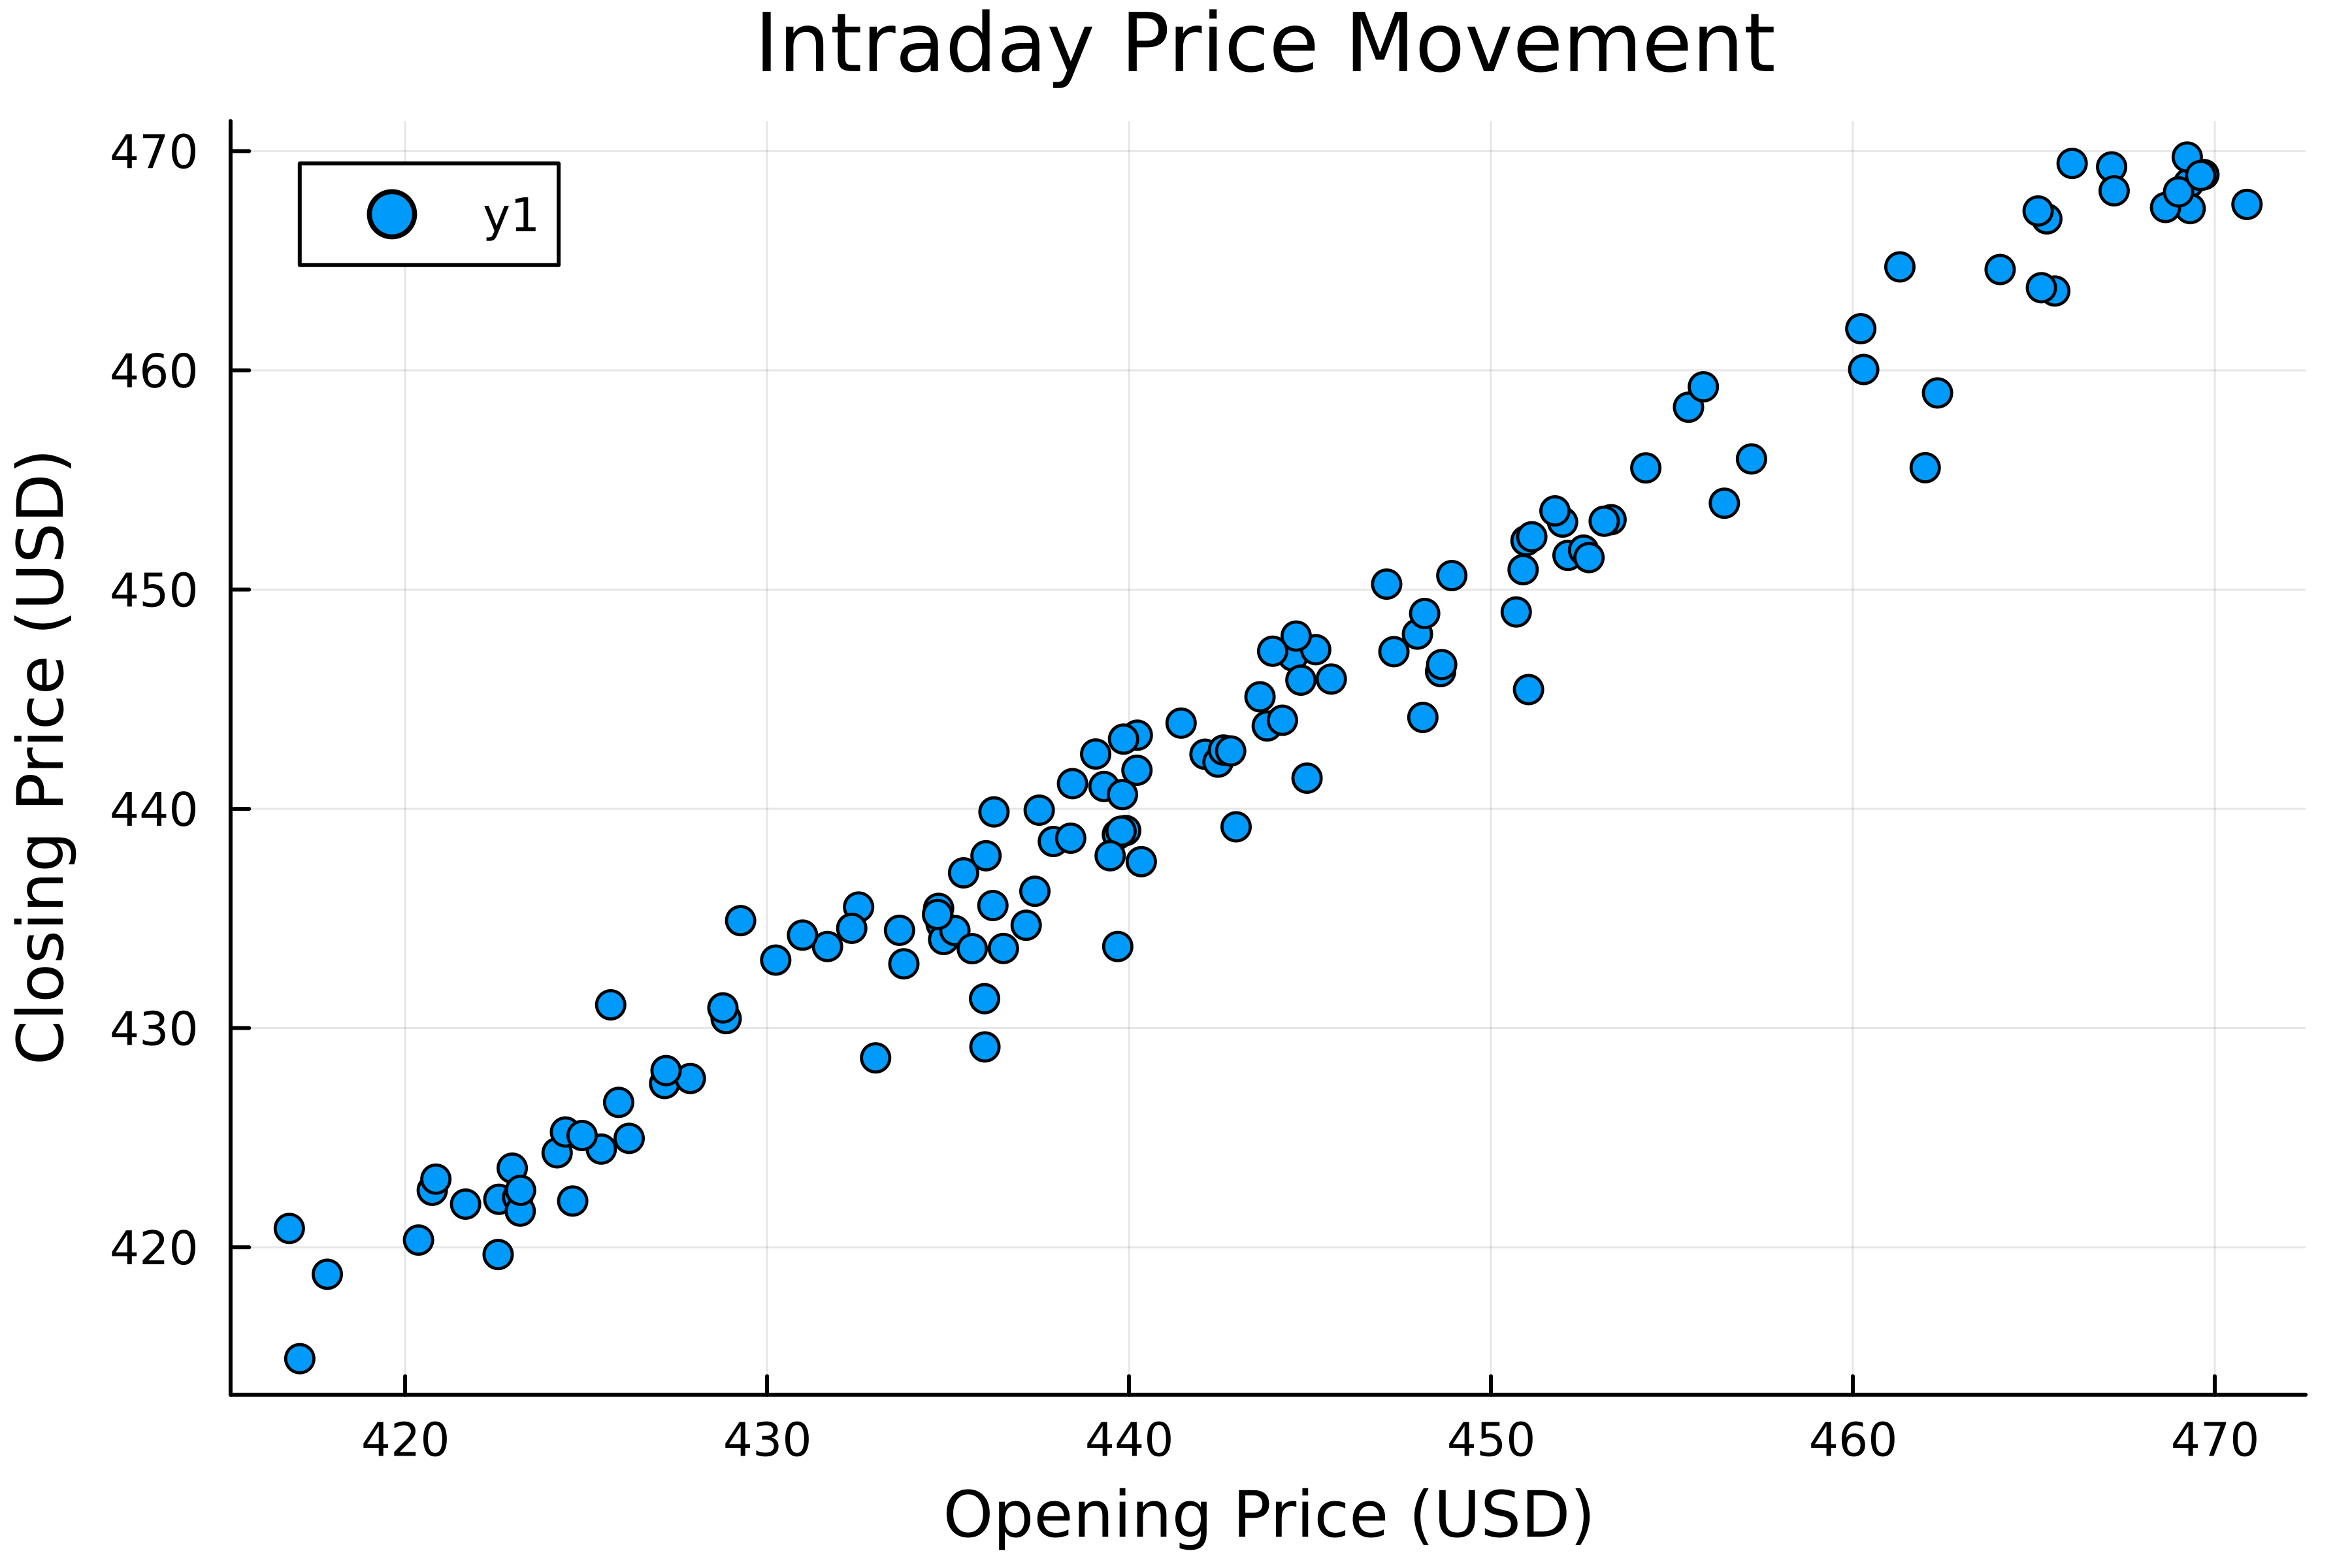
# 시가와 종가 산점도
scatter(
    fund.open,
    fund.close,

    # 제목 추가
    title="Intraday Price Movement",

    # 축 레이블 추가
    xlabel="Opening Price (USD)",
    ylabel="Closing Price (USD)",
)
# 시가와 종가 산점도 scatter( fund.open, fund.close,
# 제목 추가 title="Intraday Price Movement",
# 축 레이블 추가 xlabel="Opening Price (USD)", ylabel="Closing Price (USD)", )
선 그래프
plot(x, y)
산점도
scatter(x, y)
title="My title", xlabel="My x-label", ylabel="My y-label"