Tidyverse로 결과 시각화하기

R에서 확장 가능한 데이터 처리

Michael Kane

Assistant Professor, Yale University

연도별 결측치

library(ggplot2)
library(tidyr)
library(dplyr)


mort %>% bigtable(c("borrower_gender", "year")) %>% as.data.frame()
R에서 확장 가능한 데이터 처리

연도별 결측치

library(ggplot2)
library(tidyr)
library(dplyr)

mort %>% 
  bigtable(c("borrower_gender", "year")) %>% 
  as.data.frame() %>% 
  mutate(Category = c("Male", "Female", "Not Provided", 
                      "Not Applicable", "Missing"))
R에서 확장 가능한 데이터 처리

연도별 결측치

library(ggplot2)
library(tidyr)
library(dplyr)

mort %>% 
  bigtable(c("borrower_gender", "year")) %>% 
  as.data.frame() %>% 
  mutate(Category = c("Male", "Female", "Not Provided", 
                      "Not Applicable", "Missing")) %>%
  pivot_longer(-Category, names_to = "Year", values_to = "Count") %>%
  arrange(Year)
R에서 확장 가능한 데이터 처리

연도별 결측치

library(ggplot2)
library(tidyr)
library(dplyr)

mort %>% 
  bigtable(c("borrower_gender", "year")) %>% 
  as.data.frame() %>% 
  mutate(Category = c("Male", "Female", "Not Provided", 
                      "Not Applicable", "Missing")) %>%
  pivot_longer(-Category, names_to = "Year", values_to = "Count") %>%
  arrange(Year) %>%
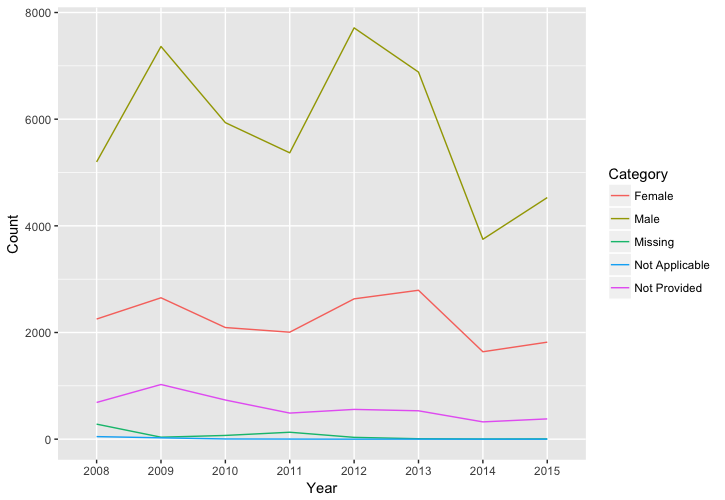
  ggplot(aes(x = Year, y = Count, group = Category, 
                color = Category)) + 
  geom_line()
R에서 확장 가능한 데이터 처리

R에서 확장 가능한 데이터 처리

연습해 봅시다!

R에서 확장 가능한 데이터 처리

Preparing Video For Download...