요약 및 최종 정리

R로 배우는 네트워크 데이터 기반 Predictive Analytics

Bart Baesens, Ph.D.

Professor of Data Science, KU Leuven and University of Southampton

레이블이 있는 네트워크
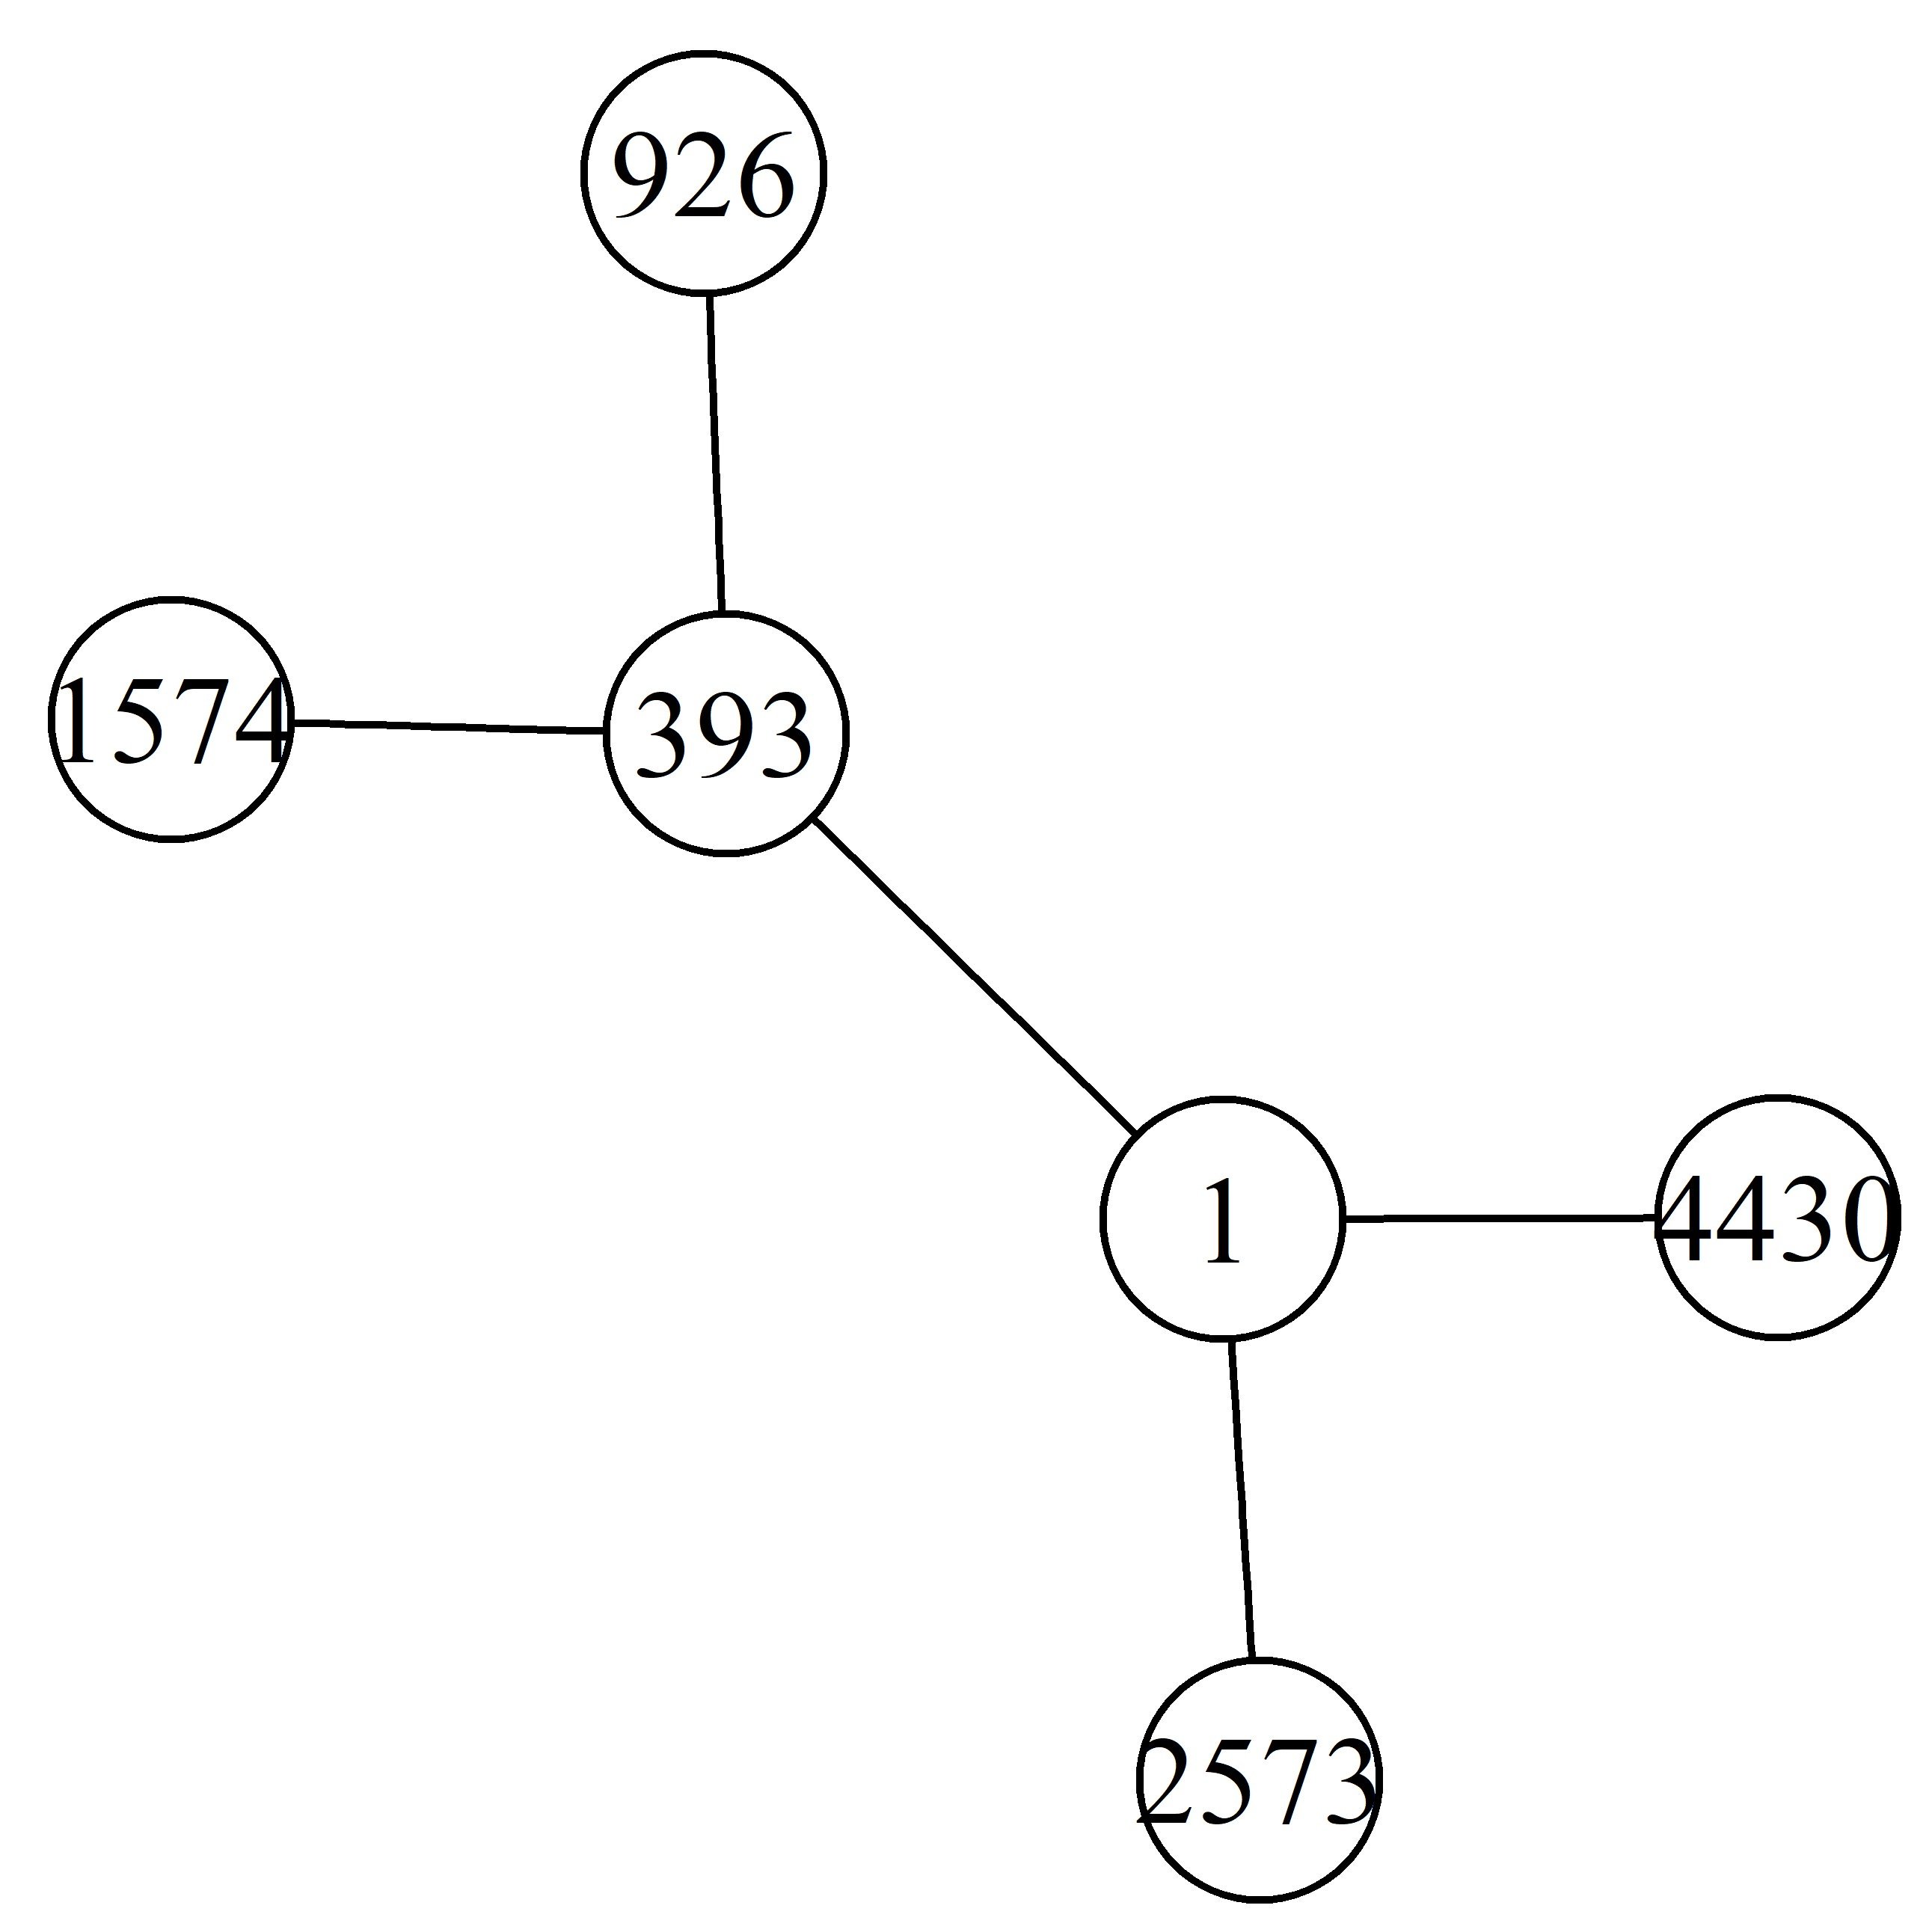
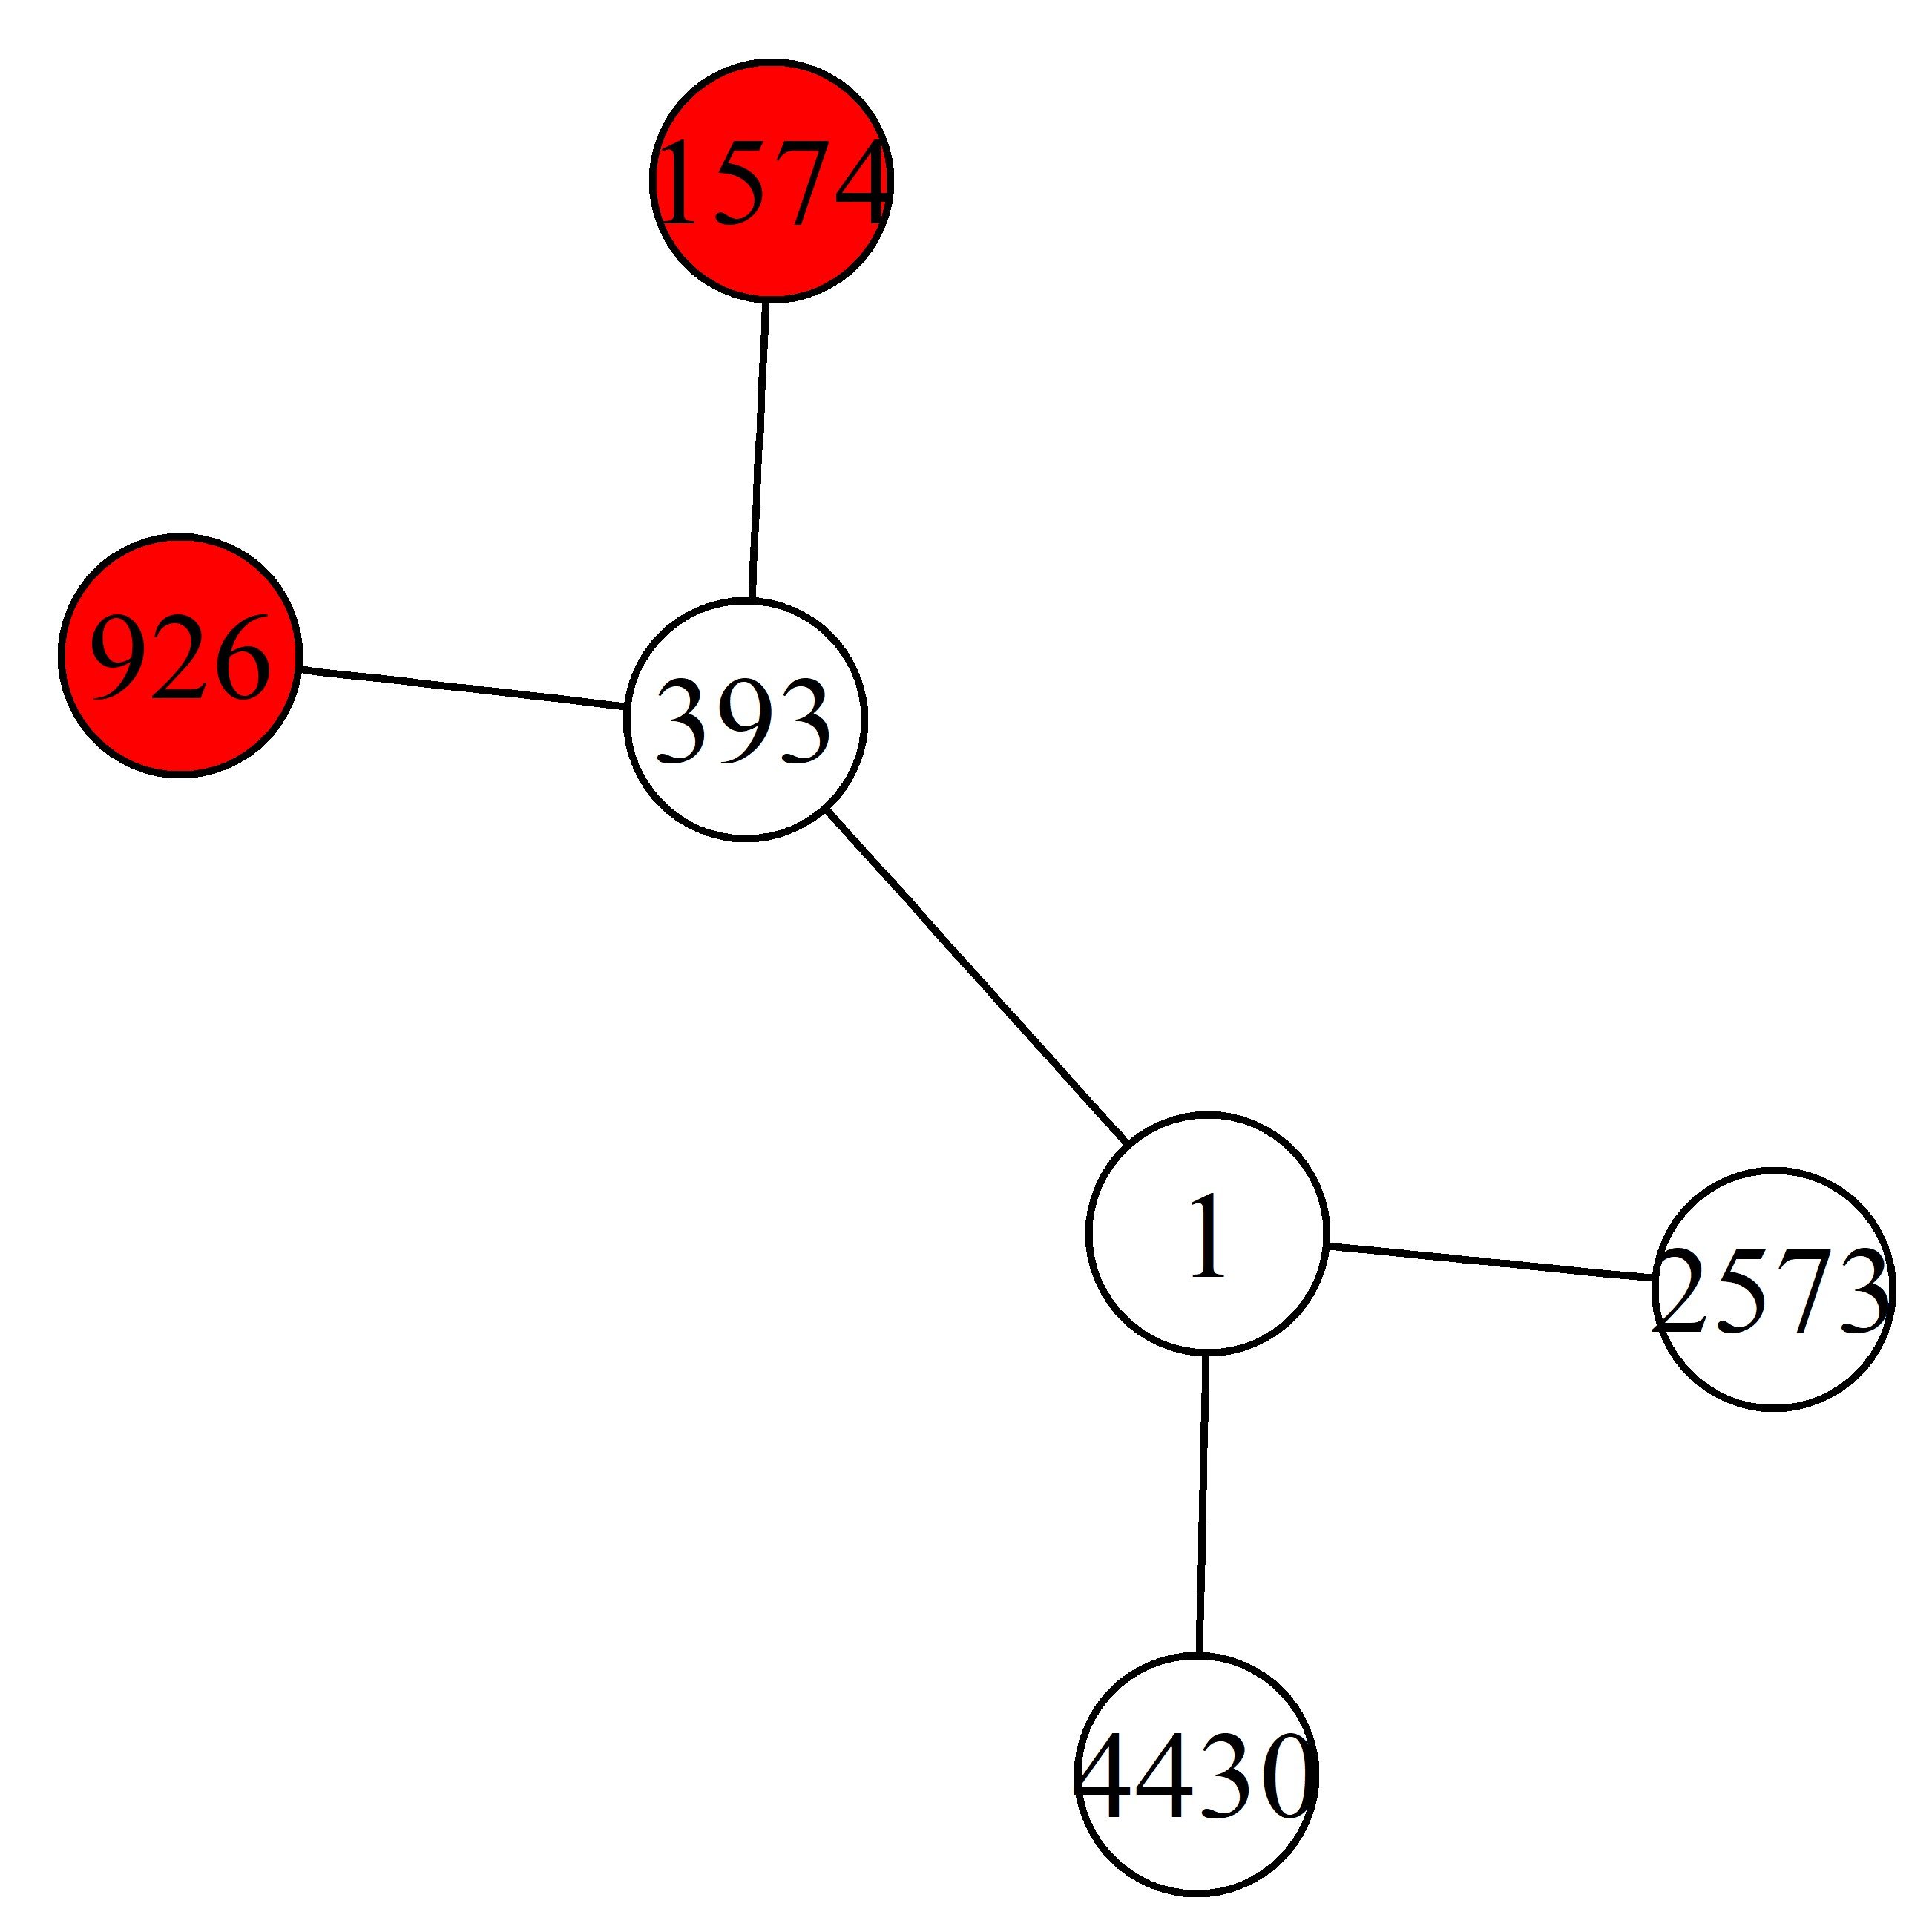
edgeList
  from    to
1    1   393
2    1  2573
3    1  4430
4  393   926
5  393  1574
customers
    id churn
1    1     0
2  393     0
3 2573     0
4 4430     0
5  926     1
6 1574     1

R로 배우는 네트워크 데이터 기반 Predictive Analytics

동류성(Homophily)

유유상종

동질성(Dyadicity): 동일 레이블 노드 간 연결성

이종선호성(Heterophilicty): 반대 레이블 노드 간 연결성

R로 배우는 네트워크 데이터 기반 Predictive Analytics

네트워크 피처화

g
IGRAPH UN-- 10 19 -- 
 attr: name (v/c), label (e/c)
 edges (vertex names):
 A--B A--C A--D A--E B--C B--D C--D C--G D--E D--F D--G E--F F--G F--I G--I G--H H--I H--J I--J
V(g)$degree<-degree(g)
g
IGRAPH UN-- 10 19 -- 
 attr: name (v/c), degree (v/n), triangles (v/n), transitivity
| (v/n), rNeighbors (v/n), averageAge (v/n), pageRank (v/n),
| pPageRank (v/n), label (e/c)
 edges (vertex names):
 A--B A--C A--D A--E B--C B--D C--D C--G D--E D--F D--G E--F F--G F--I G--I G--H H--I H--J I--J
R로 배우는 네트워크 데이터 기반 Predictive Analytics
  1. 데이터프레임 추출:
    dataset <- as_data_frame(g, what='vertices')
    
  2. 데이터셋 전처리:
    • 결측값, 이상값, 상관 변수, 정규화
  3. 모델 구축:
    glm(R~., dataset=training_set, family='binomial')
    
  4. 예측 수행:
    logPredictions <- predict(logModel, newdata=test_set, type="response")
    
  5. 성능 측정:
    auc(test_set$label, logPredictions)
    TopDecileLift(test_set$label, predictions, plot=TRUE)
    
R로 배우는 네트워크 데이터 기반 Predictive Analytics

축하합니다!

R로 배우는 네트워크 데이터 기반 Predictive Analytics

Preparing Video For Download...