네트워크 기반 추론의 과제
R로 배우는 네트워크 데이터 기반 Predictive Analytics

María Óskarsdóttir, Ph.D.
Post-doctoral researcher
첫 번째 과제
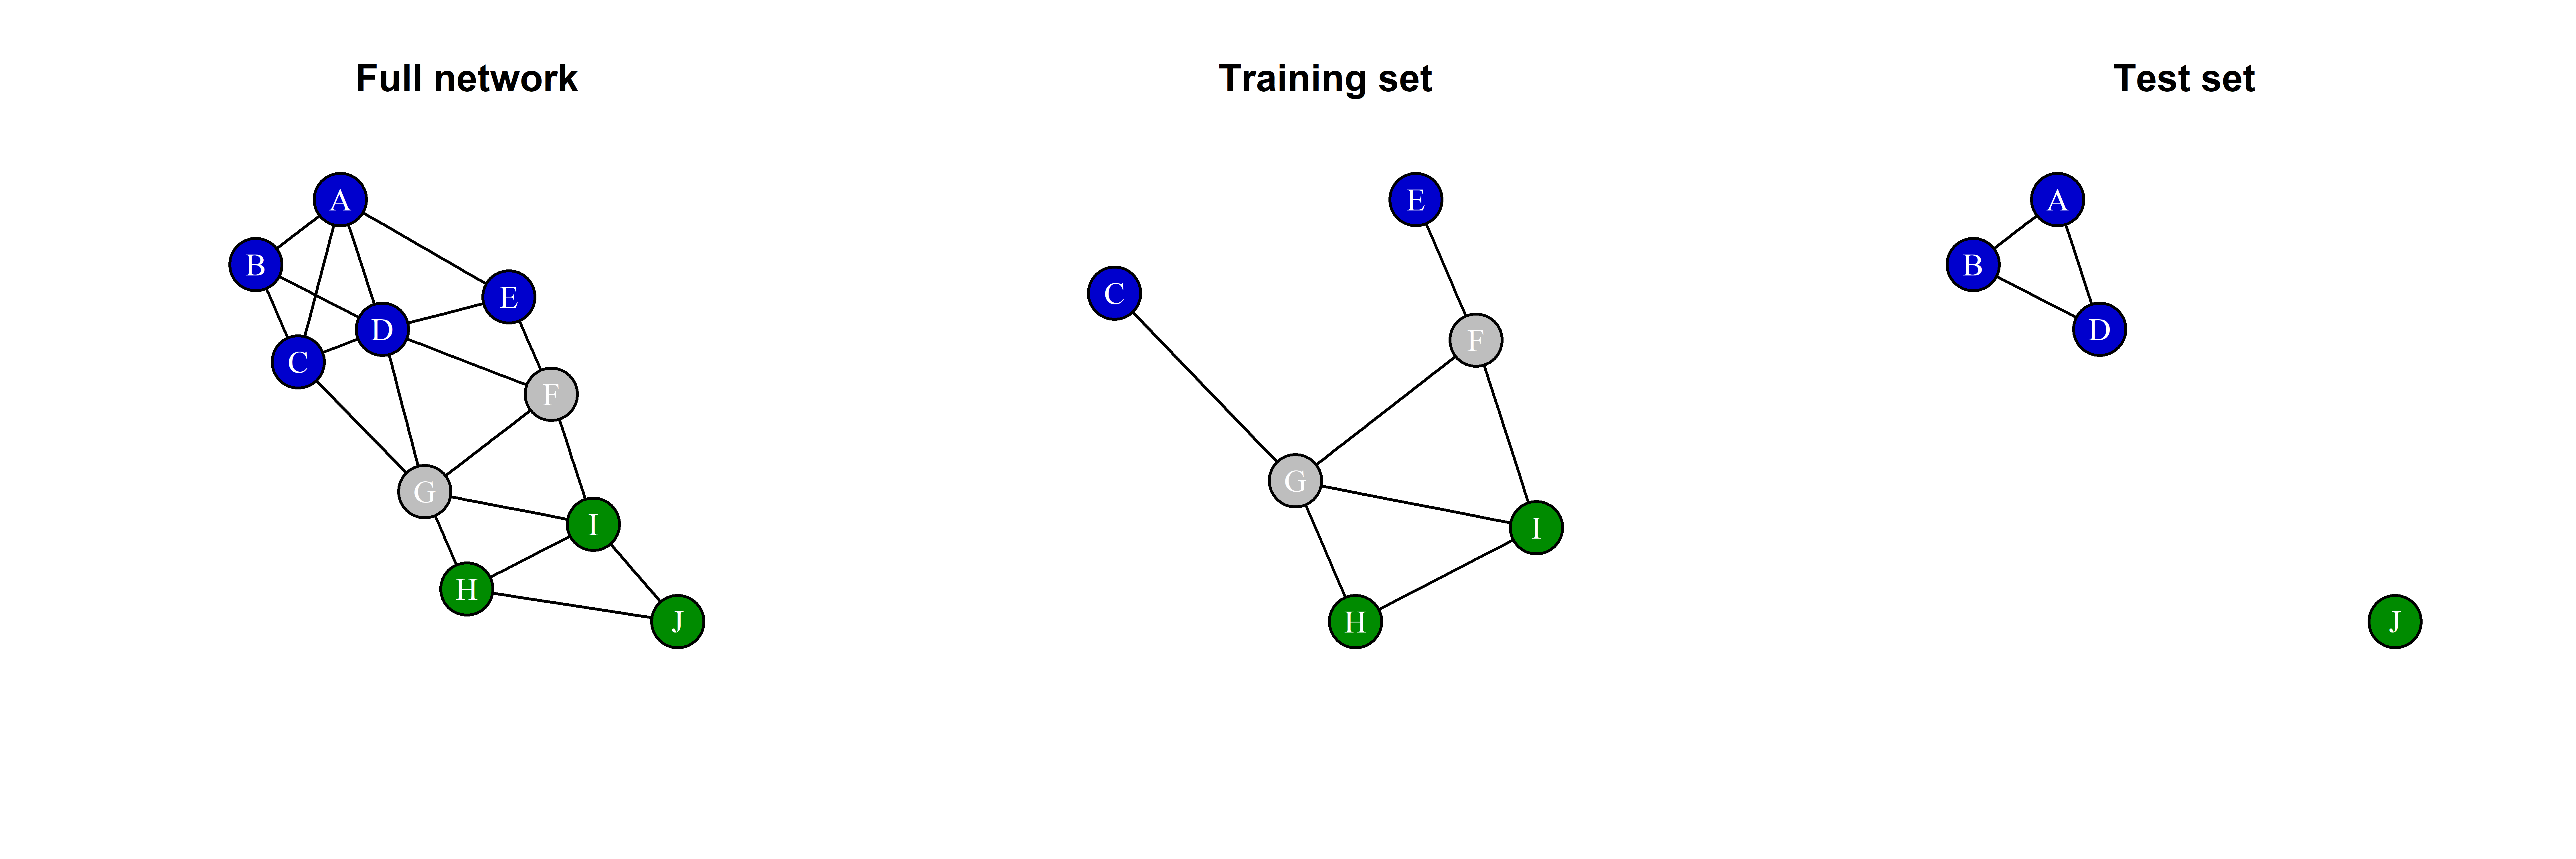
데이터 분할!
set.seed(1001)
sampleVertices <- sample(1:10, 6, replace=FALSE)
plot(induced_subgraph(g, V(g)[sampleVertices]))
plot(induced_subgraph(g, V(g)[-sampleVertices]))
두 번째 과제
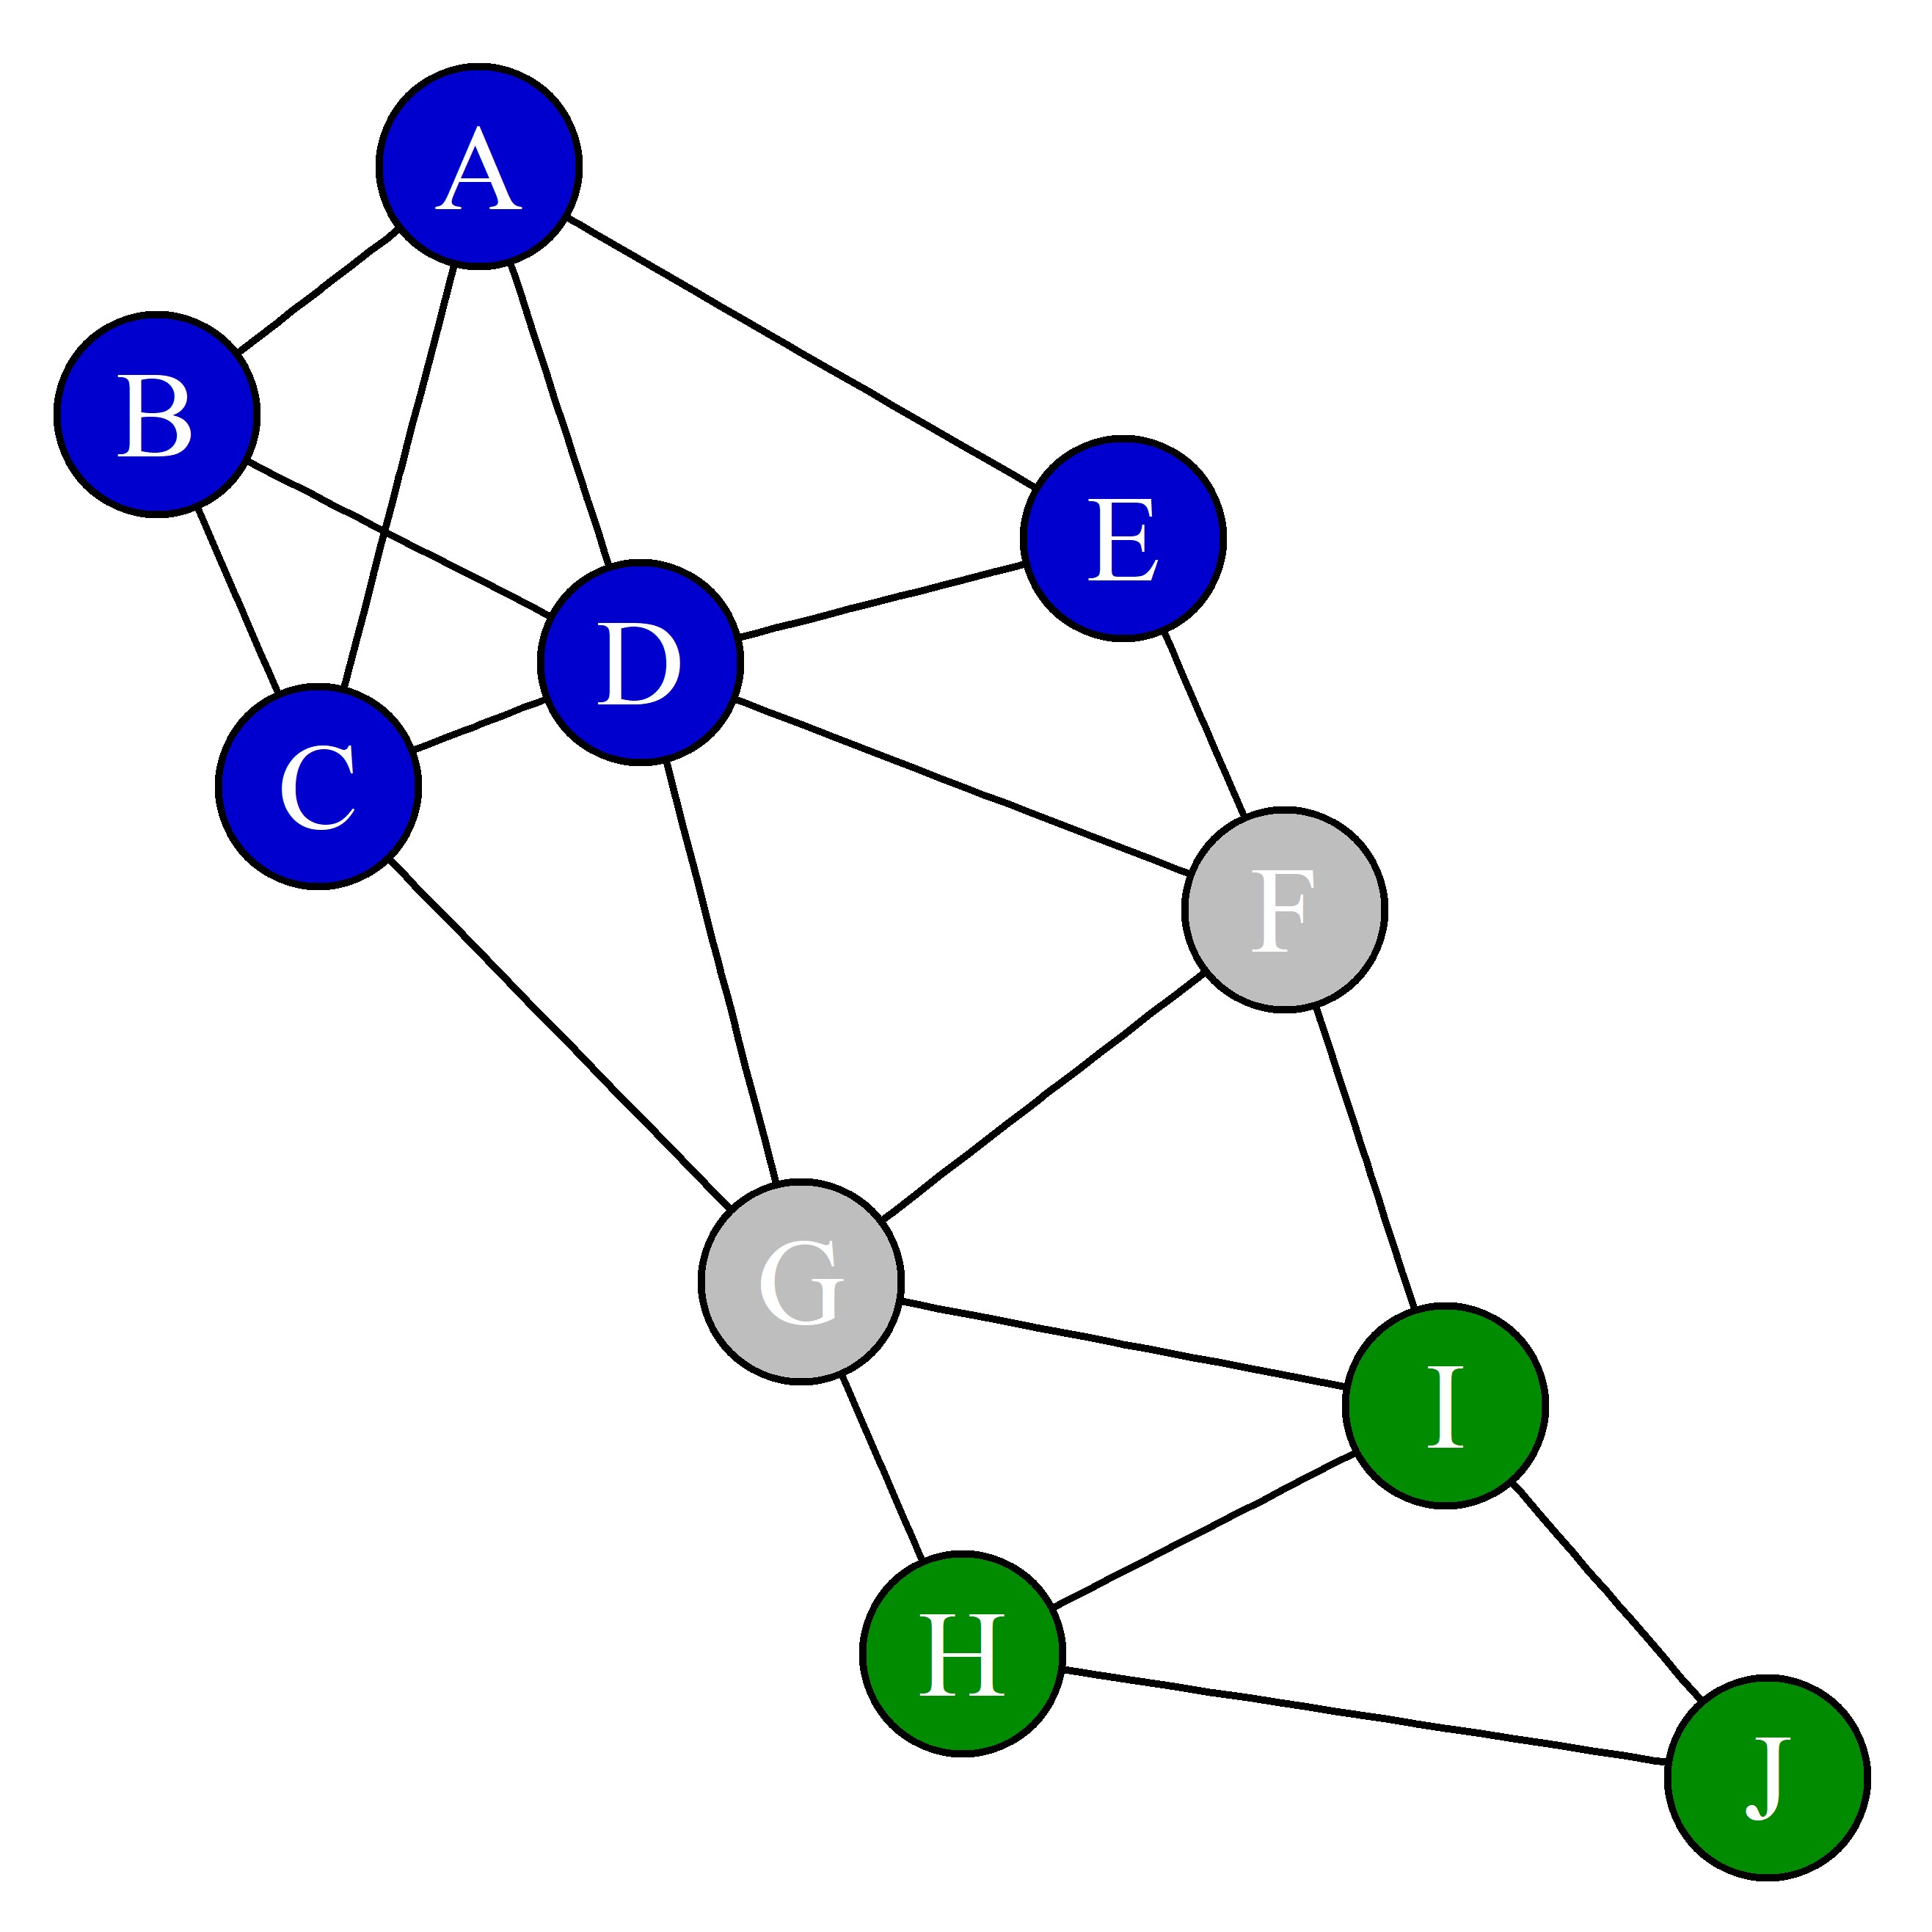
데이터셋의 관측값은 독립 동일 분포(iid)를 따르지 않습니다
세 번째 과제
집합적 추론!
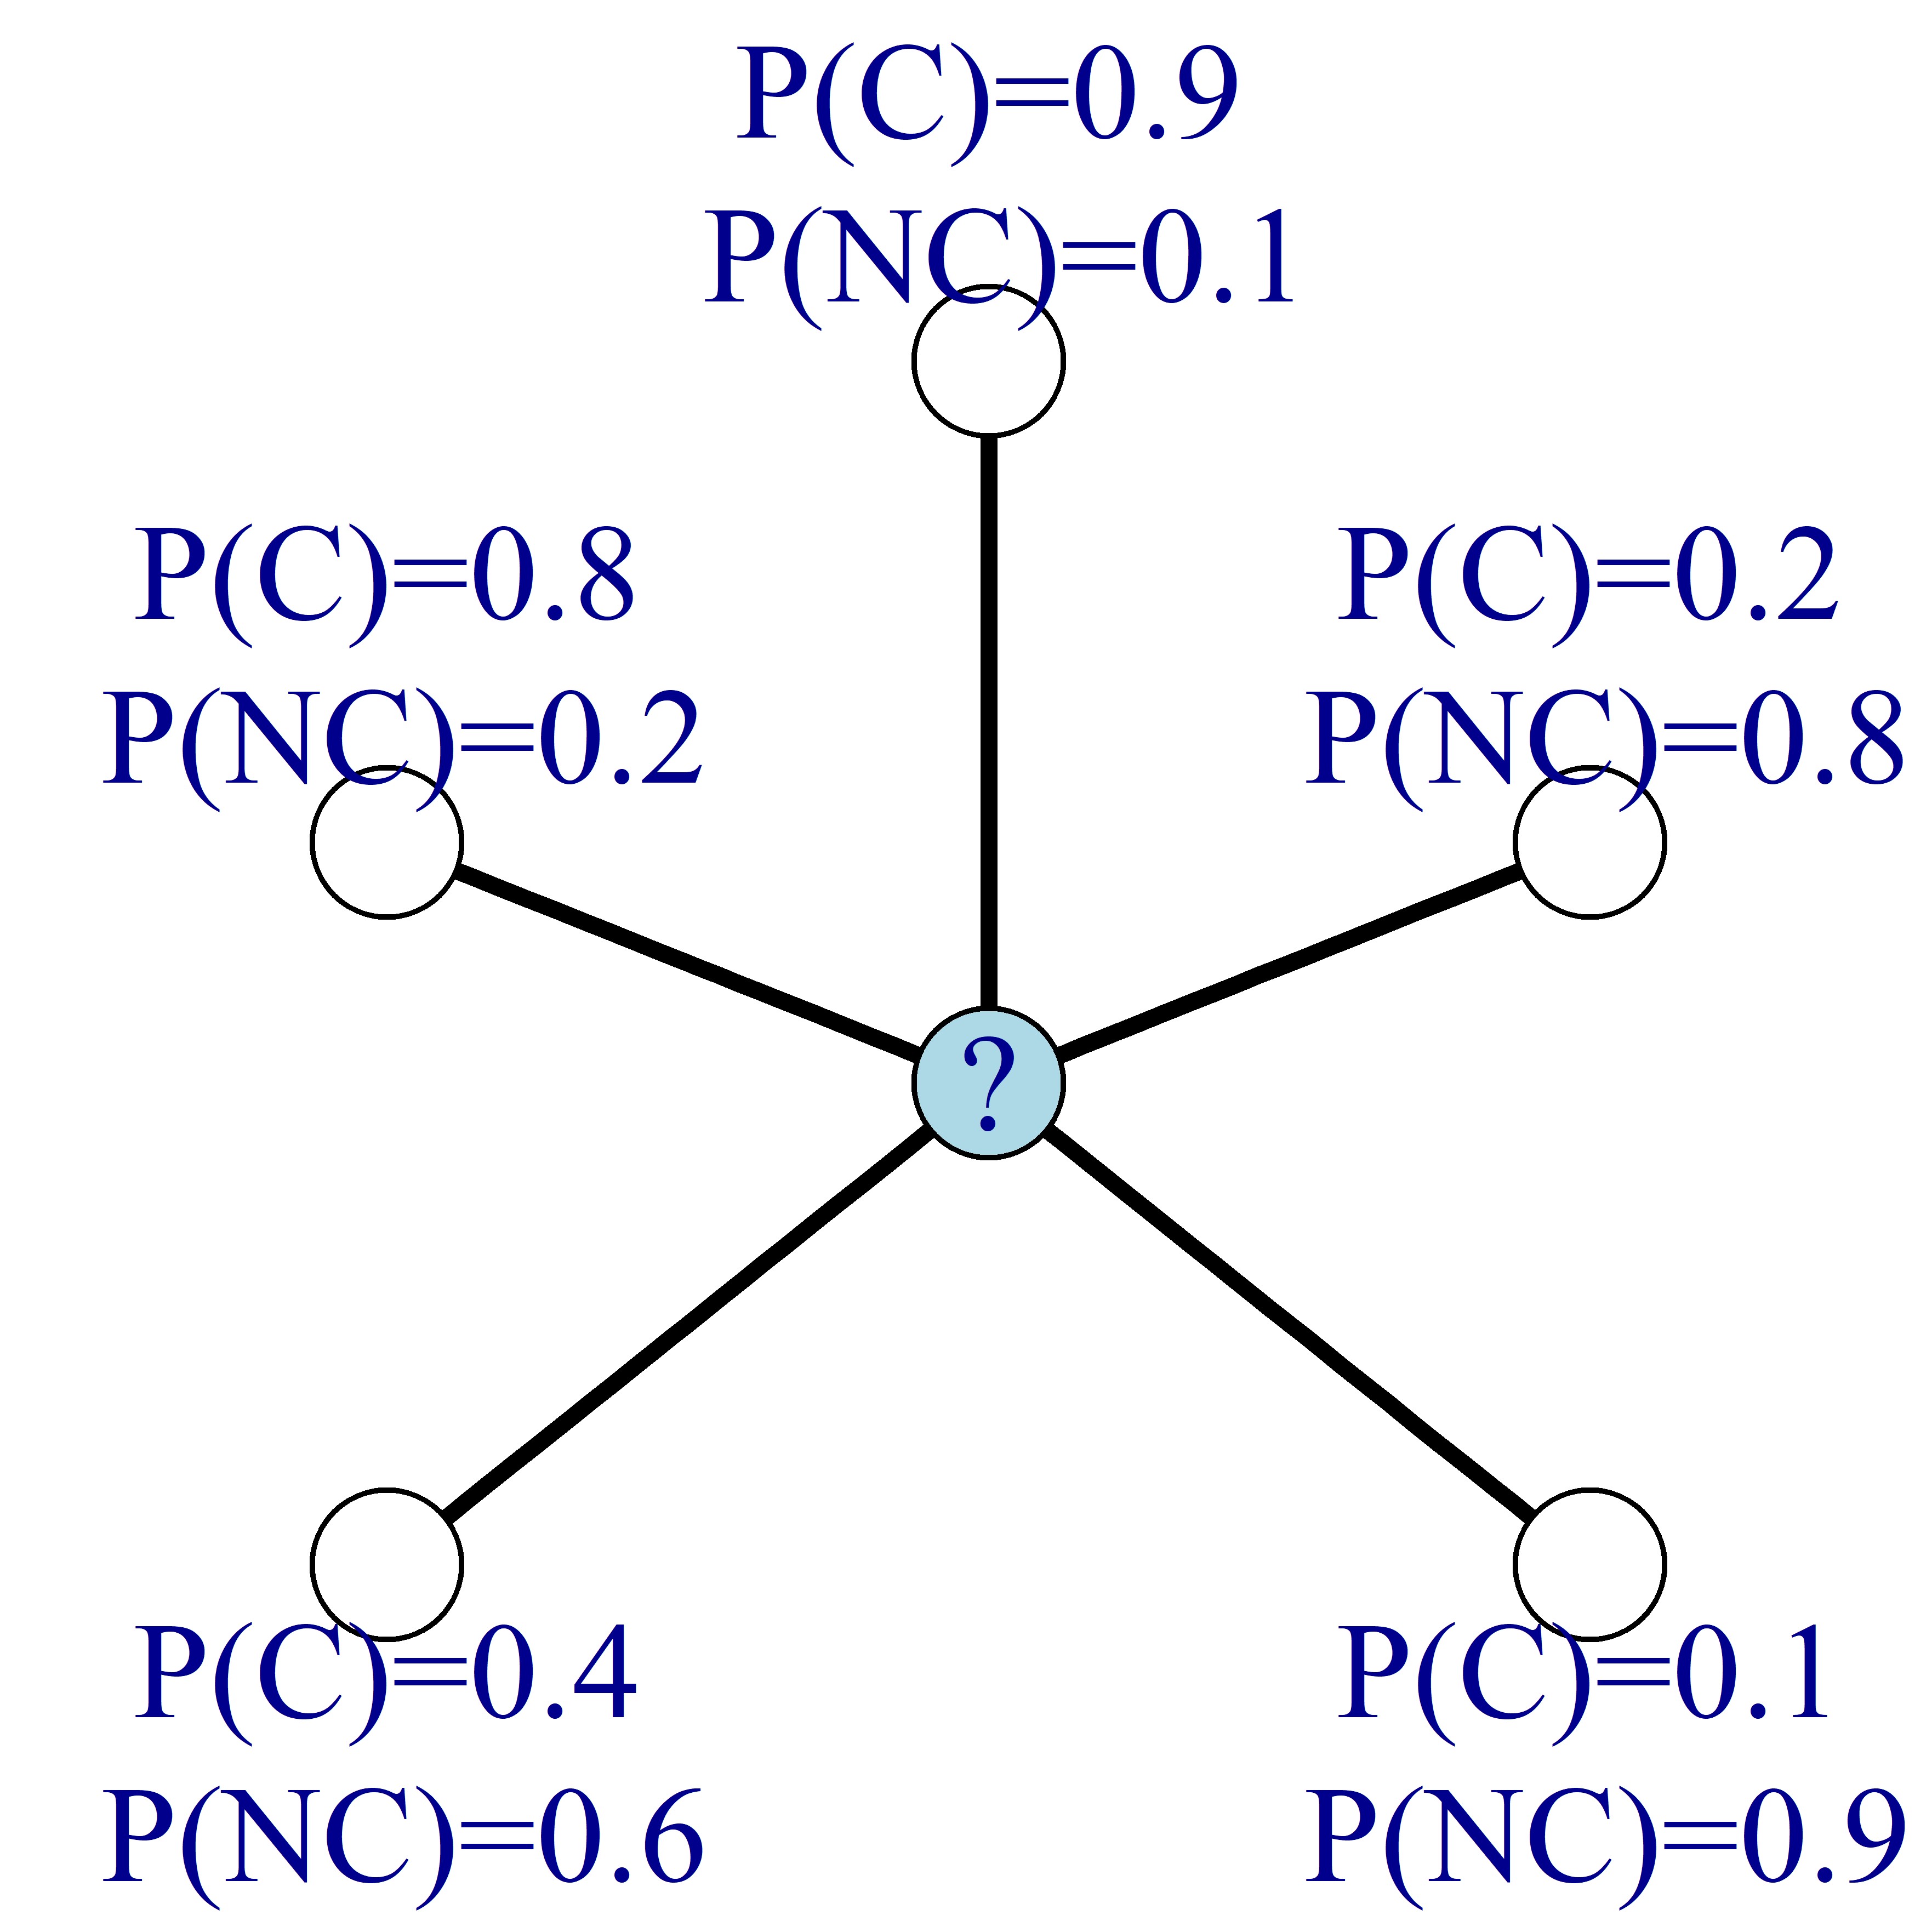
확률적 관계형 이웃 분류기