R로 배우는 Mixture Models
Victor Medina
Researcher at The University of Edinburgh
crimes_matrix <- as.matrix(crimes[,-1])
poisson_mix_model <- stepFlexmix(crimes_matrix ~ 1,
                                 k = 1:15,
                                 nrep = 5,
                                 model = FLXMCmvpois(),
                                 control = list(tolerance = 1e-15, iter = 1000))
flexmix
stepFlexmix
k
nrep
FLXMCmvpois
best_fit <- getModel(poisson_mix_model, which = "BIC")
prior(best_fit)
0.07792208 0.05194805 0.19480519 0.27272727 0.20779224 0.19480517
param_pmm <- data.frame(parameters(best_fit))
param_pmm <- param_pmm %>% mutate(Type = colnames(crimes_matrix))
head(param_pmm)
    Comp.1  Comp.2    Comp.3    Comp.4   Comp.5    Comp.6               Type
1 380.3333  821.75 112.26667  67.57143 216.9375  475.3334            ASSAULT
2 929.5000 2271.50 268.13333 153.14286 574.7500 1204.8667            BATTERY
3 303.8333  418.00  98.60000  52.04762 174.9375  272.9333           BURGLARY
4 601.3333 1074.50 199.66666 116.90476 370.9375  648.6667    CRIMINAL DAMAGE
5 210.5000  223.75  49.73333  25.00000  81.0625  139.0000  CRIMINAL TRESPASS
6 973.1667  438.00 158.80000  61.95238 196.7500  241.4666 DECEPTIVE PRACTICE
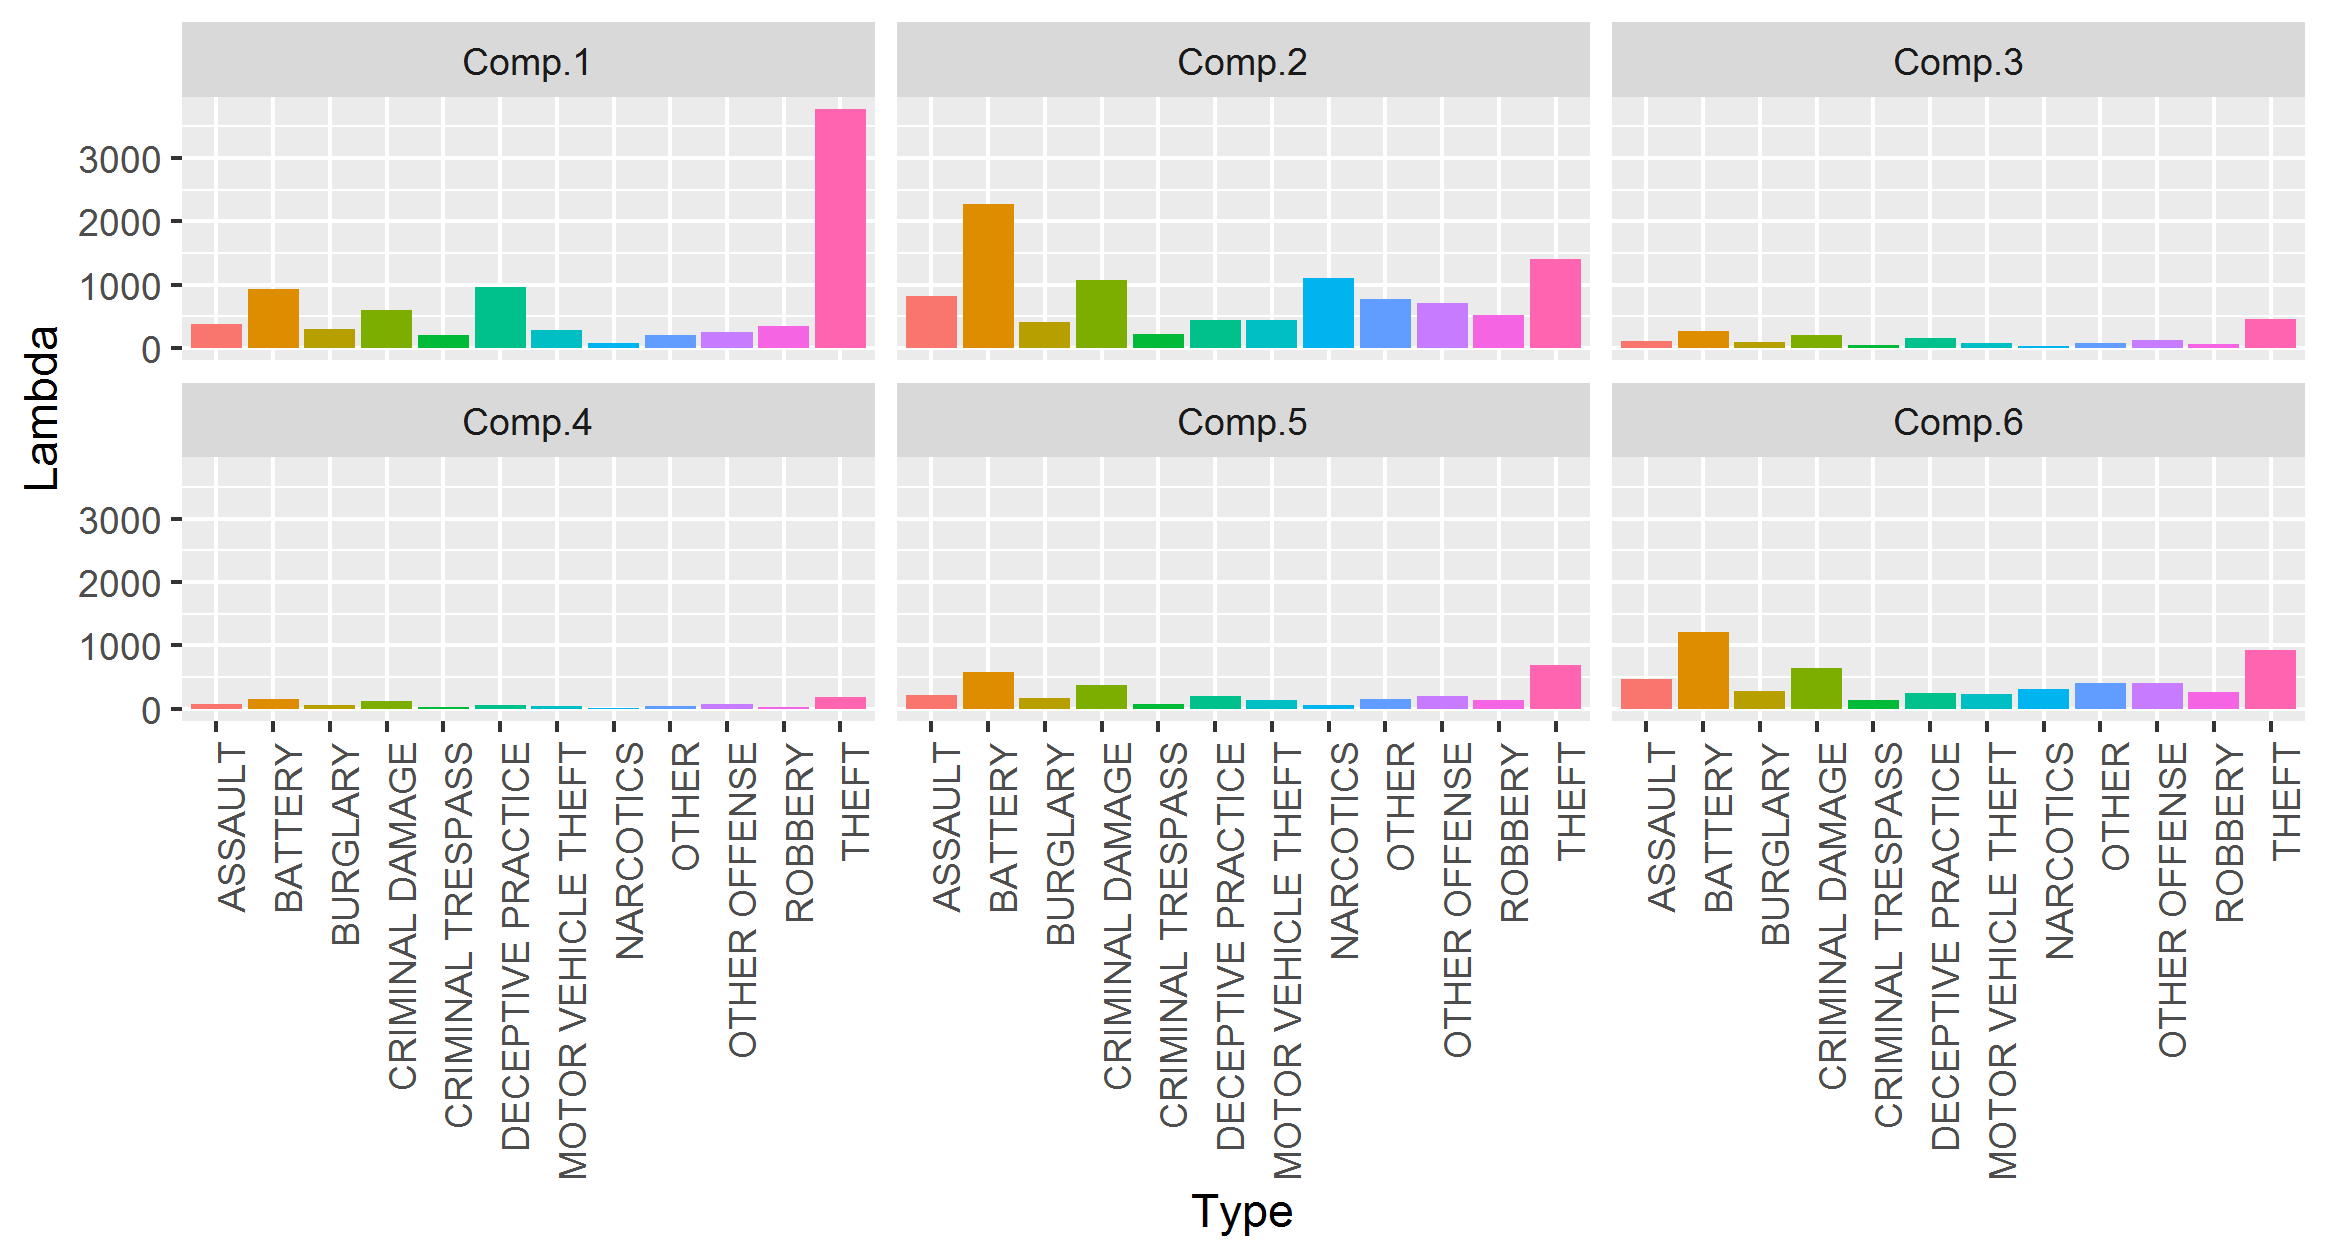
param_pmm %>%
  pivot_longer(-Type, names_to = "Components", values_to = "Lambda") %>%
  ggplot(aes(x = Type, y = Lambda, fill = Type)) +
  geom_bar(stat = "identity") +
  facet_wrap(~ Components) +
  theme(axis.text.x = element_text(angle = 90, hjust = 1),
        legend.position = "none")
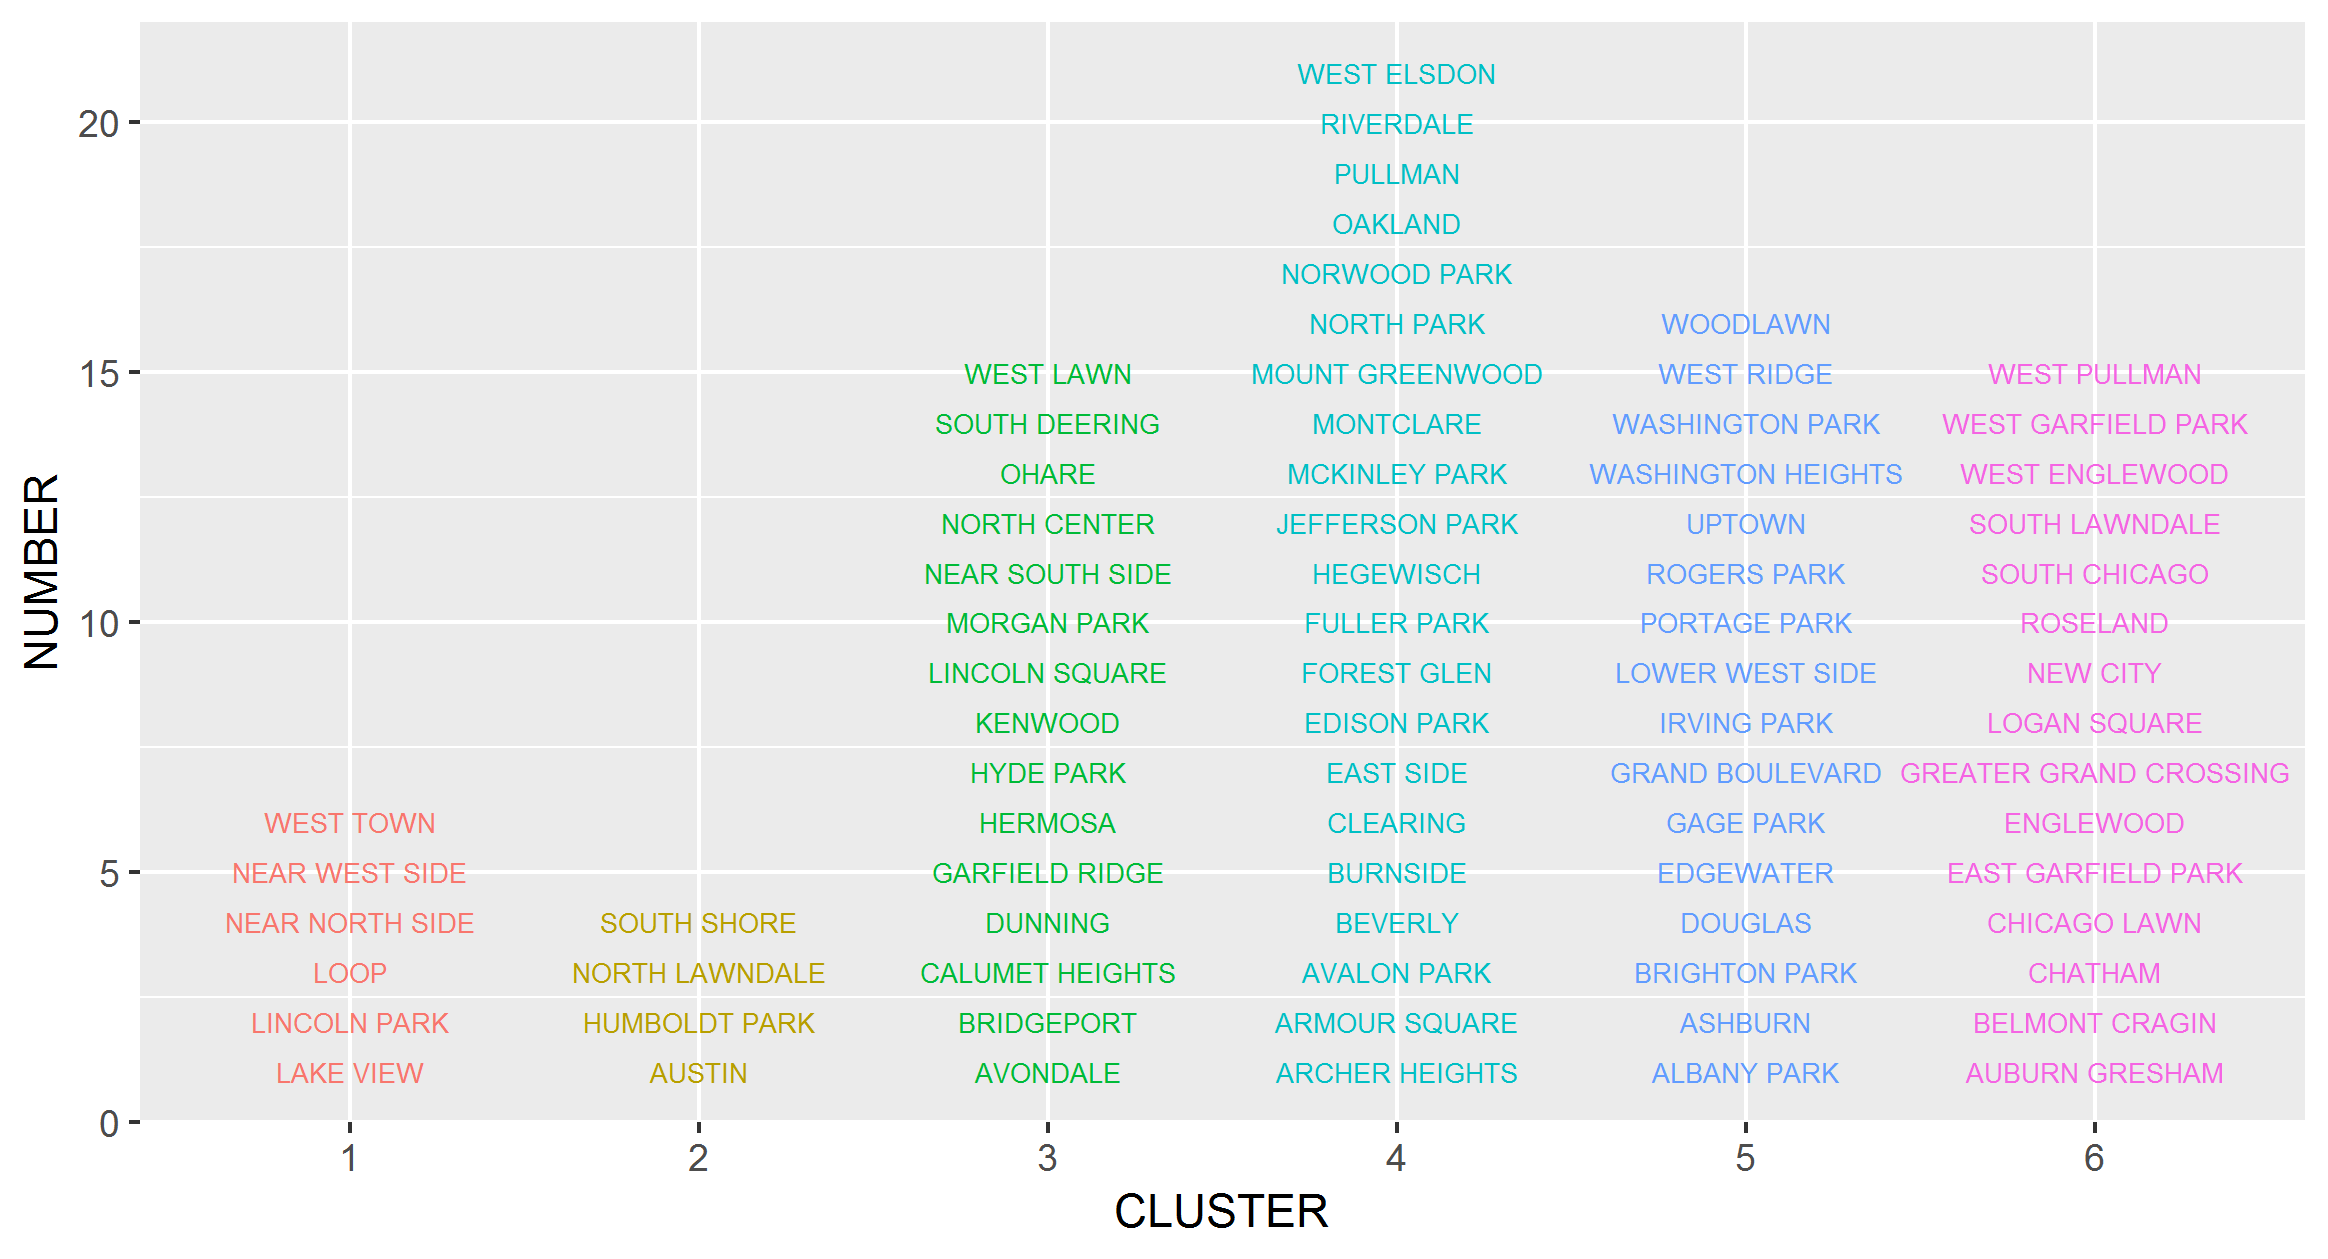
crimes_c <- crimes %>%
  mutate(CLUSTER = factor(clusters(best_fit)))
crimes_c %>%
  group_by(CLUSTER) %>%
  mutate(NUMBER = row_number()) %>%
  ggplot(aes(x = CLUSTER, y = NUMBER, col = CLUSTER)) +
  geom_text(aes(label = COMMUNITY), size = 2.3)+
  theme(legend.position="none")