Lệnh plot

Mô hình hóa phi tuyến với Generalized Additive Models (GAMs) trong R

Noam Ross

Senior Research Scientist, EcoHealth Alliance
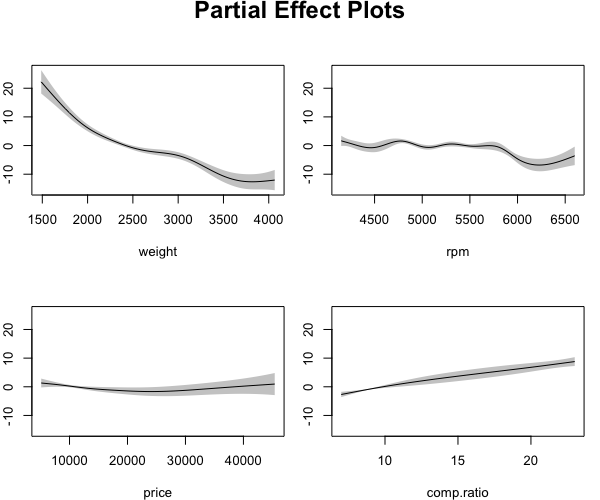
Lệnh plot

plot(gam_model)
?plot.gam
Mô hình hóa phi tuyến với Generalized Additive Models (GAMs) trong R

Mô hình hóa phi tuyến với Generalized Additive Models (GAMs) trong R

Chọn hiệu ứng riêng phần

plot(gam_model, select = c(2, 3))
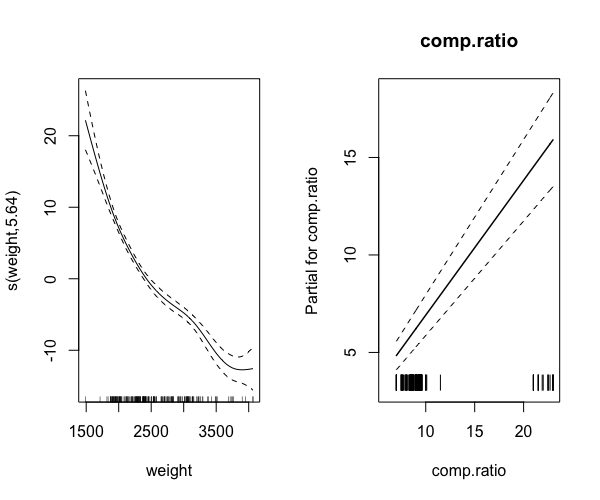
plot(gam_model, pages = 1)
plot(gam_model, pages = 1, all.terms = TRUE)
Mô hình hóa phi tuyến với Generalized Additive Models (GAMs) trong R

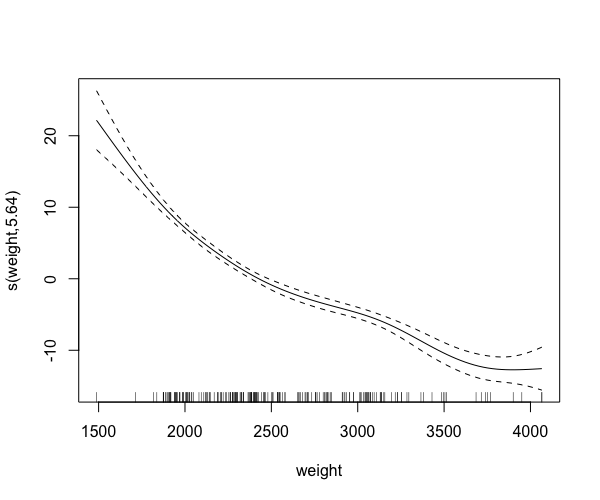
Hiển thị dữ liệu trên biểu đồ

plot(gam_model, rug = TRUE)
Mô hình hóa phi tuyến với Generalized Additive Models (GAMs) trong R

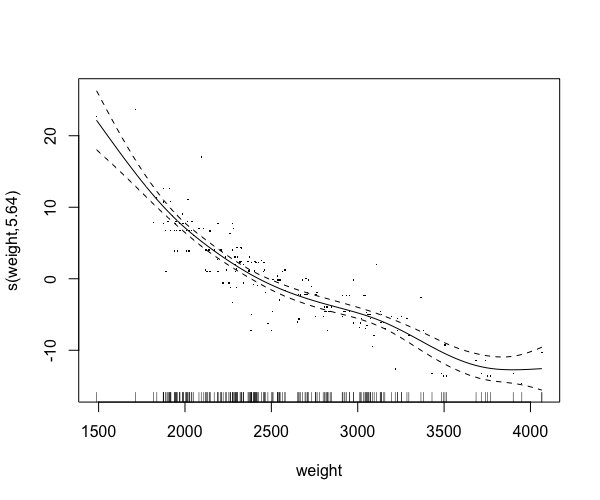
Hiển thị dữ liệu trên biểu đồ (2)

plot(gam_model, residuals = TRUE)
Mô hình hóa phi tuyến với Generalized Additive Models (GAMs) trong R

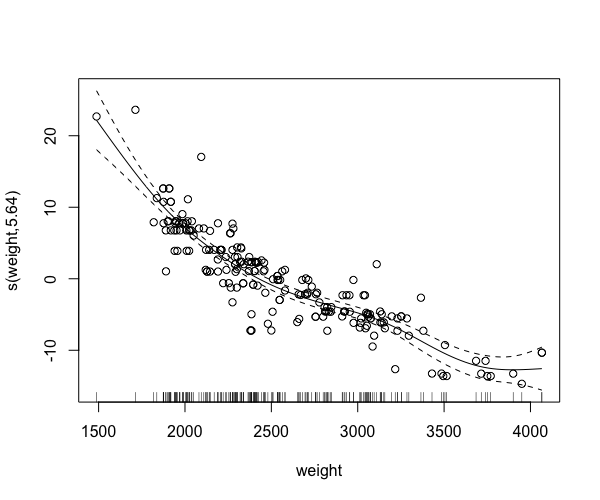
Hiển thị dữ liệu trên biểu đồ (3)

plot(gam_model, rug = TRUE, residuals = TRUE,
     pch = 1, cex = 1)
Mô hình hóa phi tuyến với Generalized Additive Models (GAMs) trong R

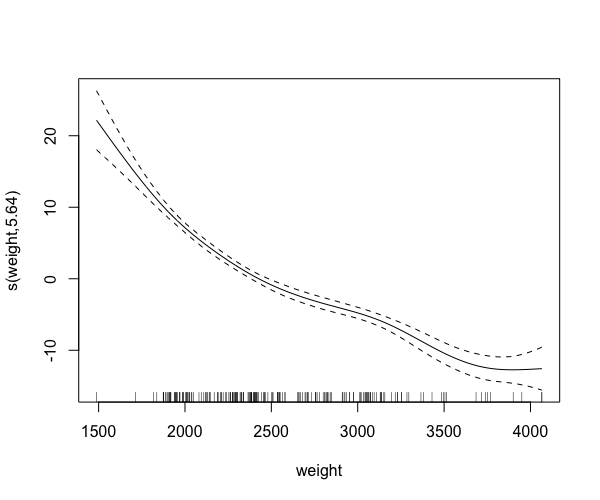
Hiển thị sai số chuẩn

plot(gam_model, se = TRUE)
Mô hình hóa phi tuyến với Generalized Additive Models (GAMs) trong R

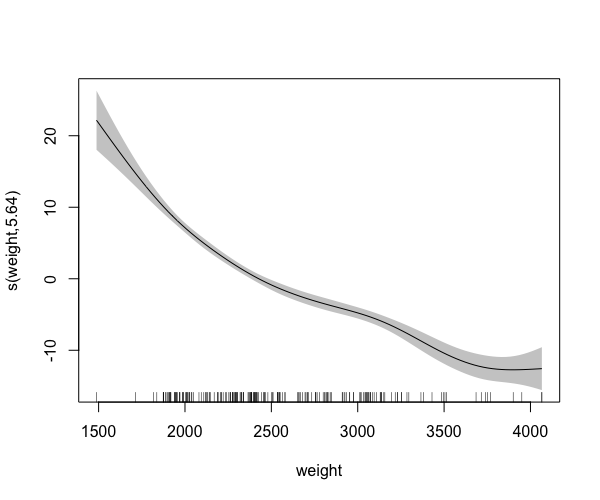
Hiển thị sai số chuẩn (2)

plot(gam_model, shade = TRUE)
Mô hình hóa phi tuyến với Generalized Additive Models (GAMs) trong R

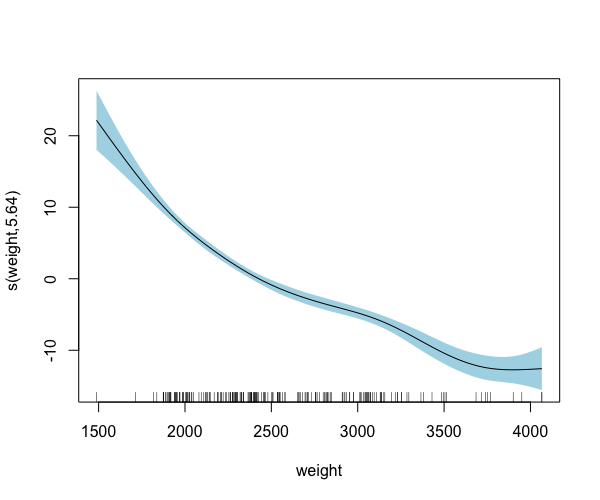
Hiển thị sai số chuẩn

plot(gam_model, shade = TRUE, shade.col = "lightblue")
Mô hình hóa phi tuyến với Generalized Additive Models (GAMs) trong R

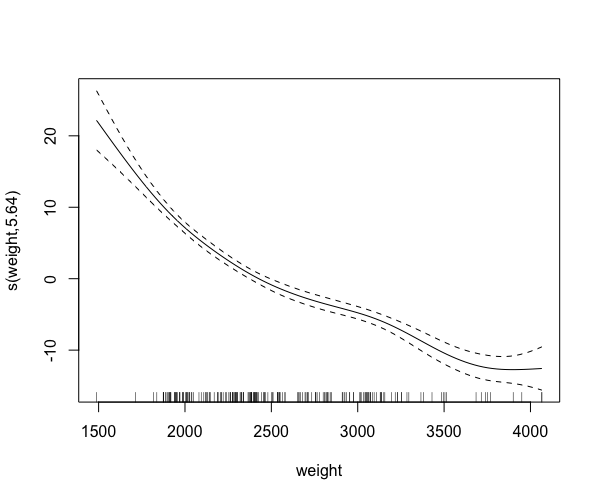
Biến đổi sai số chuẩn

plot(gam_model, seWithMean = TRUE)
Mô hình hóa phi tuyến với Generalized Additive Models (GAMs) trong R

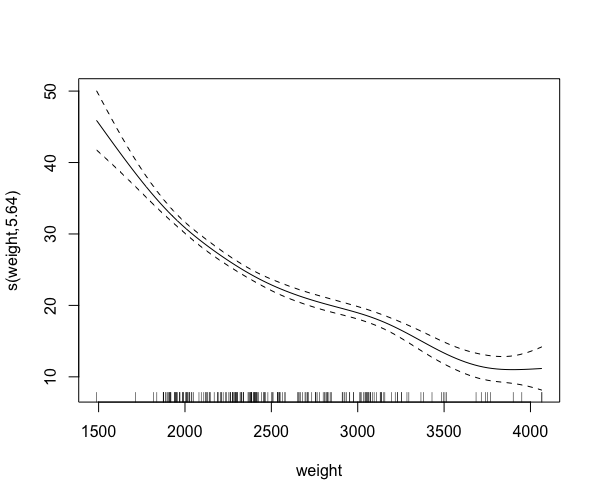
Biến đổi sai số chuẩn (2)

plot(gam_model, seWithMean = TRUE, shift = coef(gam_model)[1])
Mô hình hóa phi tuyến với Generalized Additive Models (GAMs) trong R

Giờ hãy vẽ vài biểu đồ!

Mô hình hóa phi tuyến với Generalized Additive Models (GAMs) trong R

Preparing Video For Download...