Python中級
Hugo Bowne-Anderson
Data Scientist at DataCamp
多くの選択肢
さまざまなグラフの種類
豊富なカスタマイズ
選択は以下によって決る
データ
伝えたいストーリー
population.py
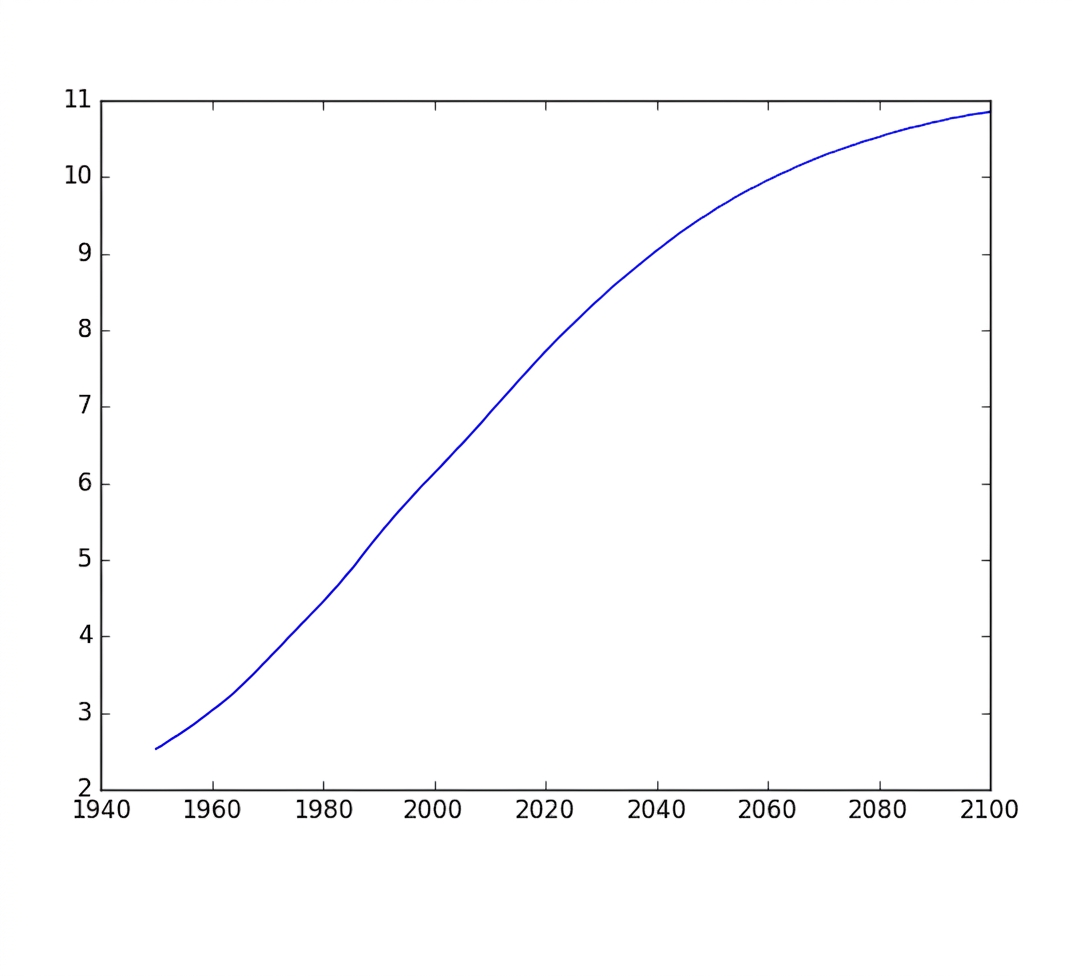
import matplotlib.pyplot as plt
year = [1950, 1951, 1952, ..., 2100]
pop = [2.538, 2.57, 2.62, ..., 10.85]

plt.plot(year, pop)

plt.show()
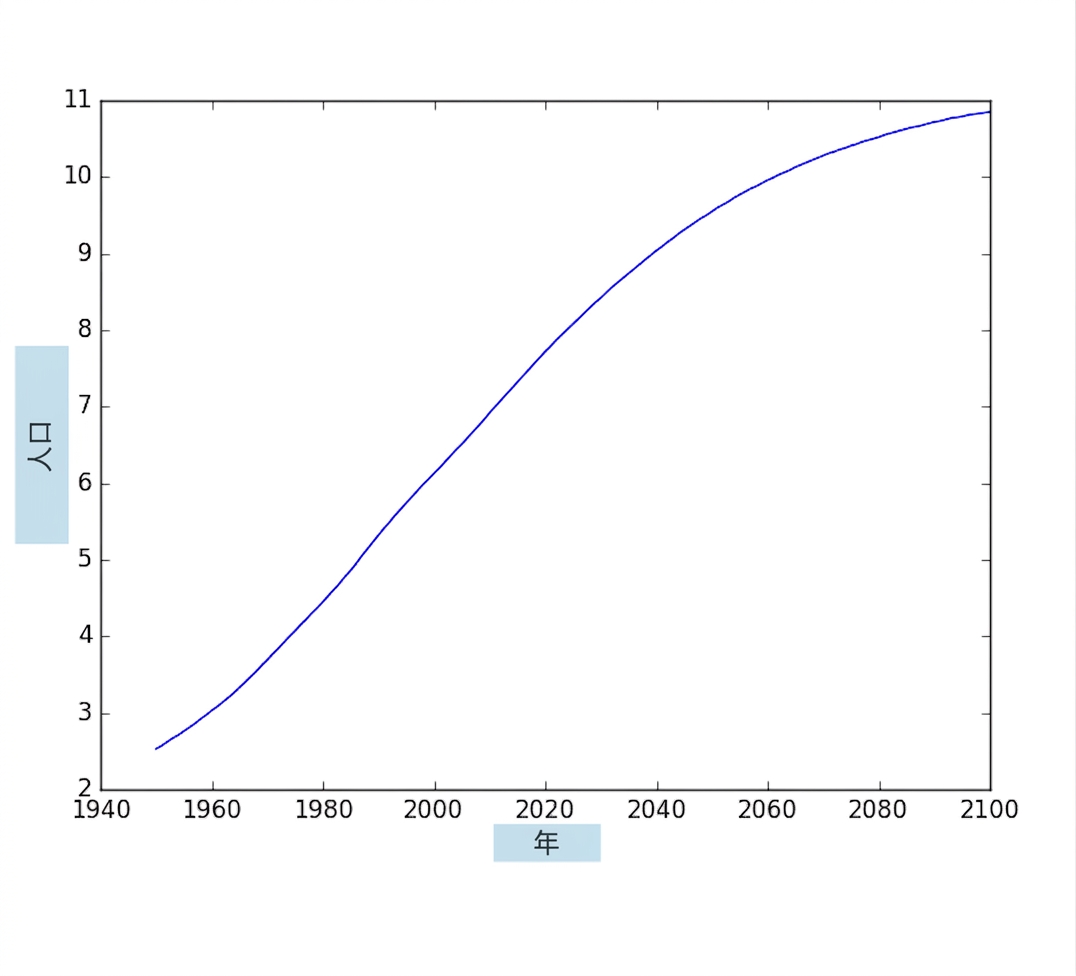
import matplotlib.pyplot as plt
year = [1950, 1951, 1952, ..., 2100]
pop = [2.538, 2.57, 2.62, ..., 10.85]

plt.plot(year, pop)


plt.xlabel('Year')
plt.ylabel('Population')


plt.show()
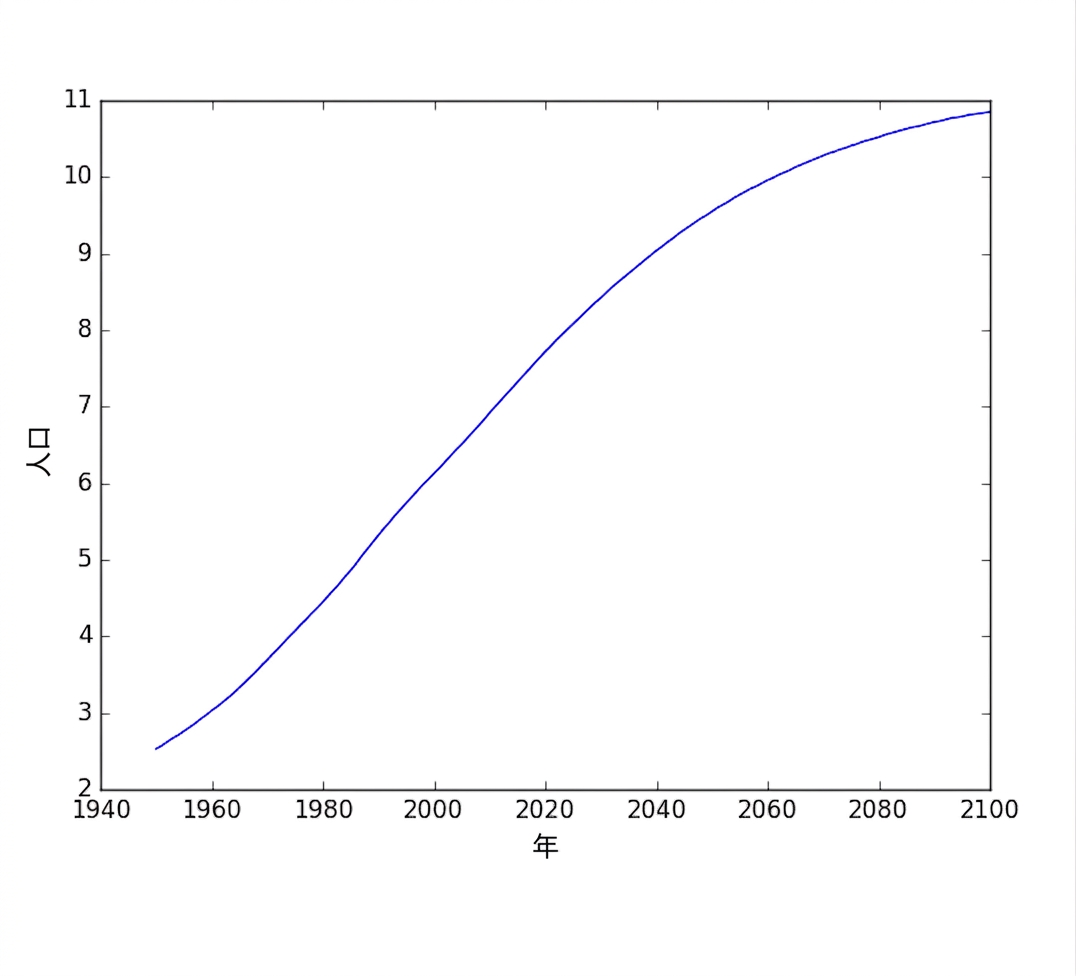
import matplotlib.pyplot as plt
year = [1950, 1951, 1952, ..., 2100]
pop = [2.538, 2.57, 2.62, ..., 10.85]

plt.plot(year, pop)


plt.xlabel('Year')
plt.ylabel('Population')


plt.show()
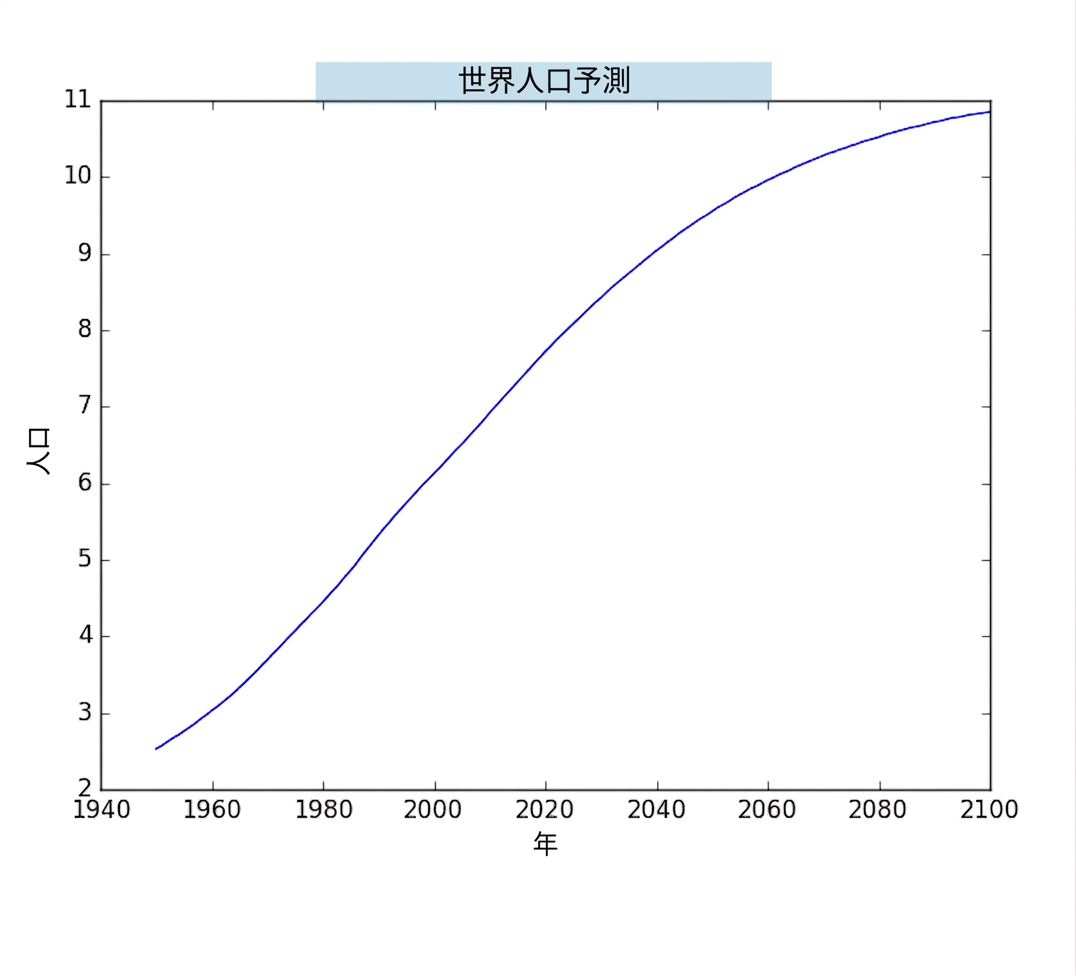
import matplotlib.pyplot as plt
year = [1950, 1951, 1952, ..., 2100]
pop = [2.538, 2.57, 2.62, ..., 10.85]

plt.plot(year, pop)


plt.xlabel('Year')
plt.ylabel('Population')

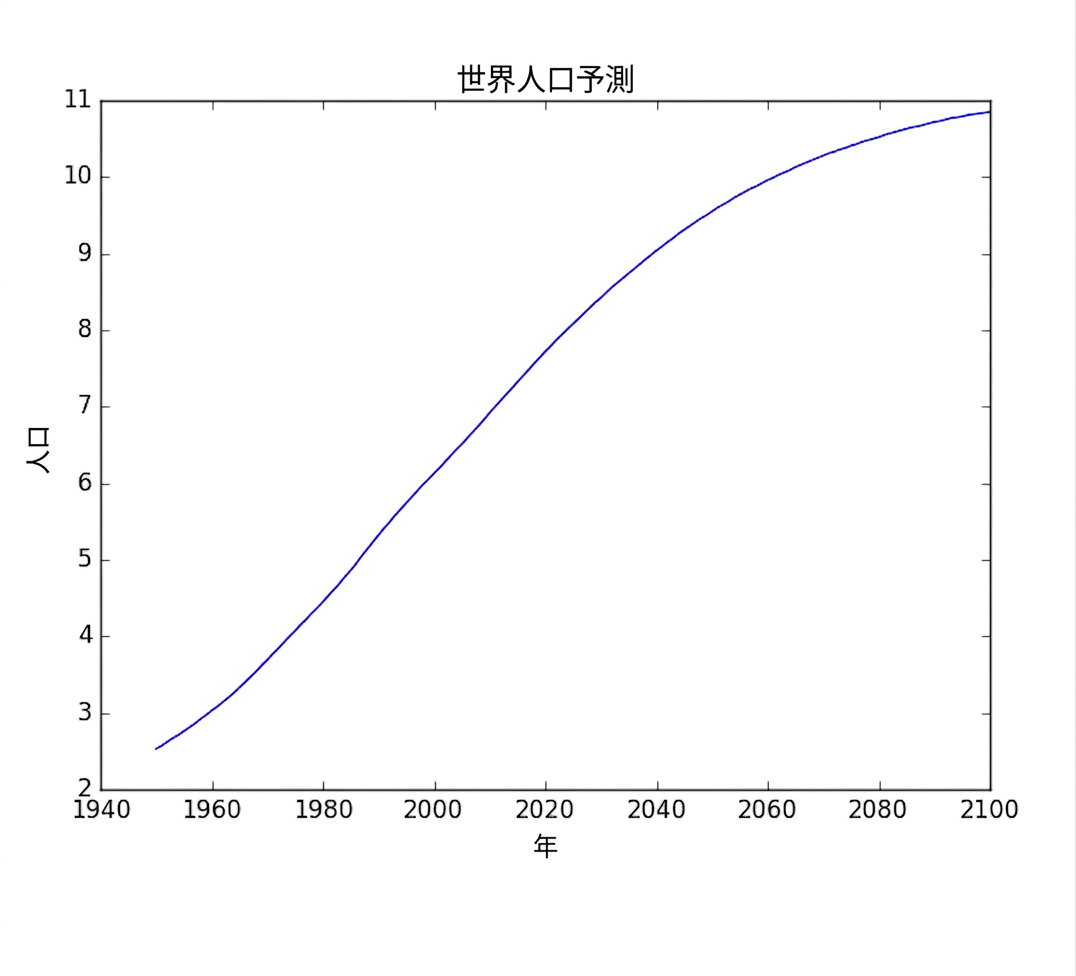
plt.title('World Population Projections')


plt.show()
plt.title('World Population Projections')
import matplotlib.pyplot as plt
year = [1950, 1951, 1952, ..., 2100]
pop = [2.538, 2.57, 2.62, ..., 10.85]

plt.plot(year, pop)


plt.xlabel('Year')
plt.ylabel('Population')

plt.title('World Population Projections')

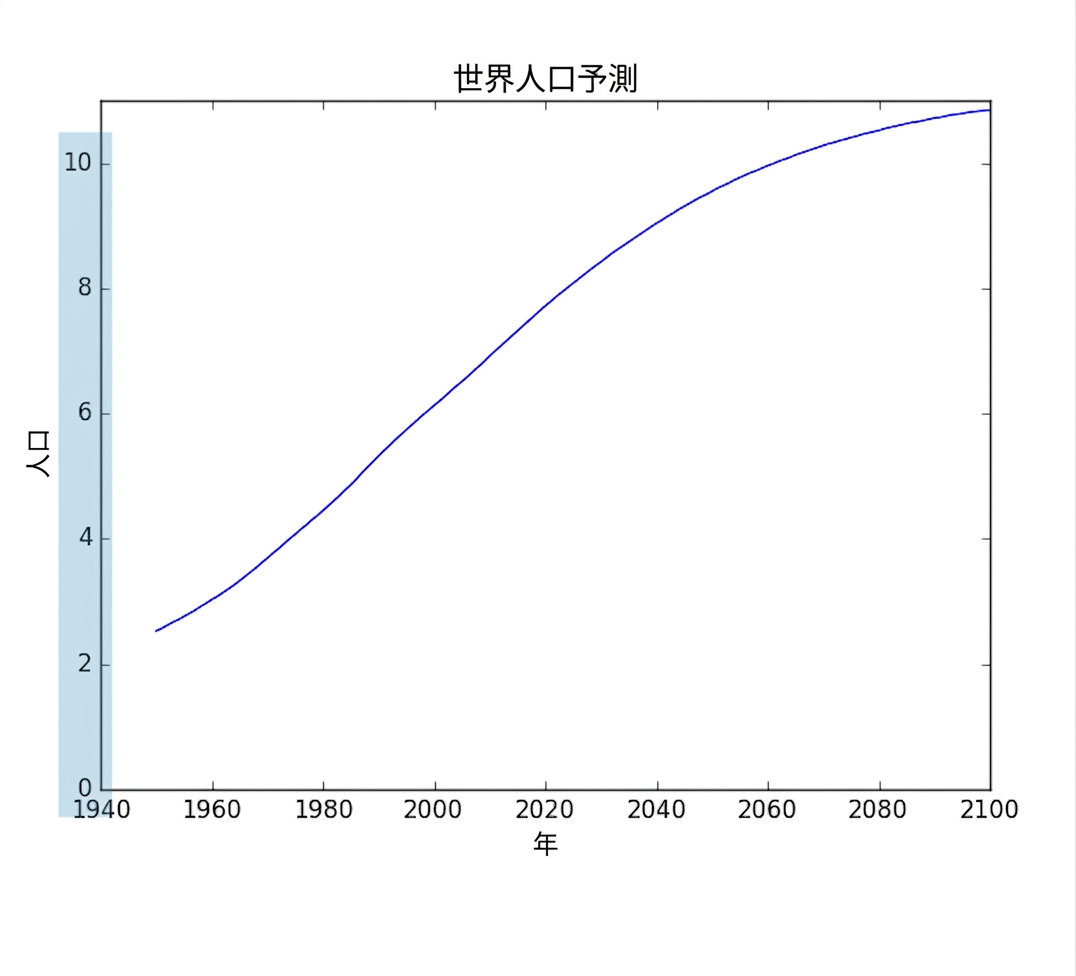
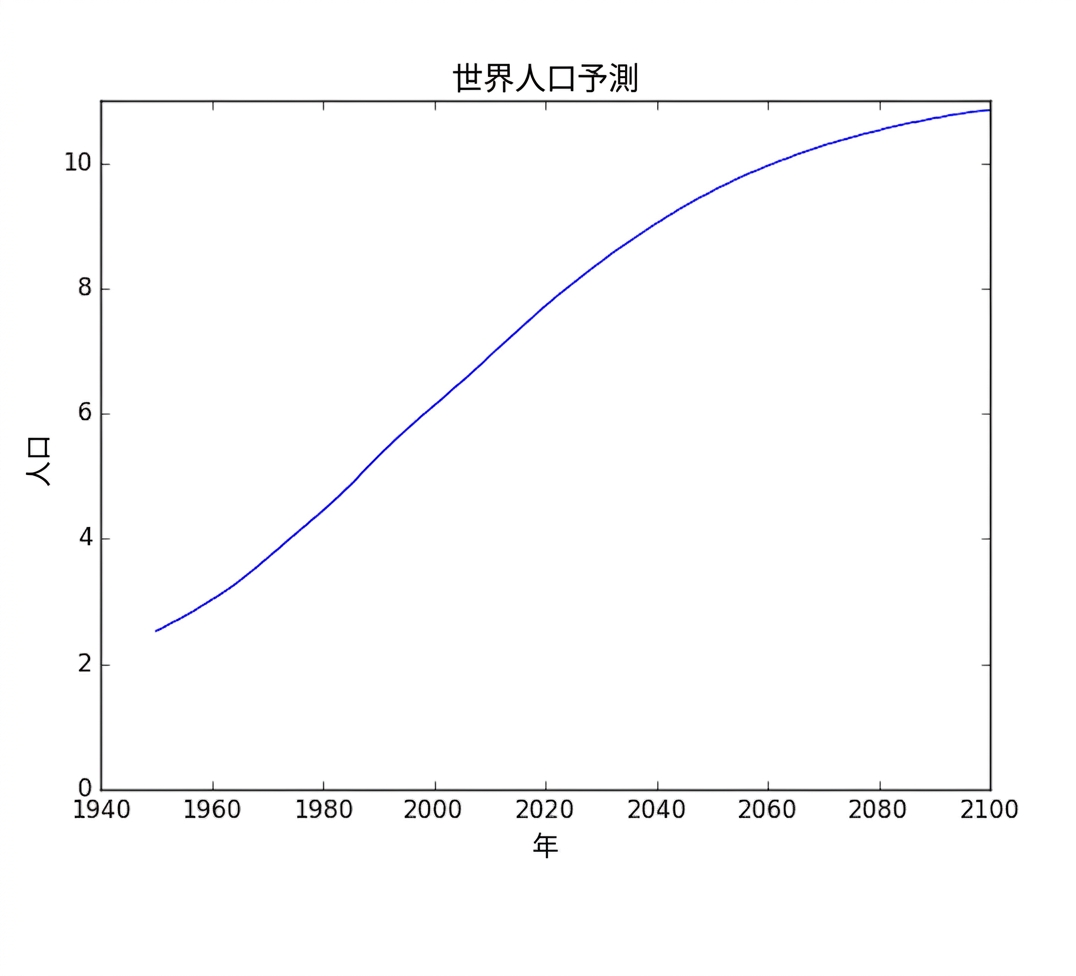
plt.yticks([0, 2, 4, 6, 8, 10])


plt.show()
plt.yticks([0, 2, 4, 6, 8, 10])
import matplotlib.pyplot as plt
year = [1950, 1951, 1952, ..., 2100]
pop = [2.538, 2.57, 2.62, ..., 10.85]

plt.plot(year, pop)


plt.xlabel('Year')
plt.ylabel('Population')

plt.title('World Population Projections')

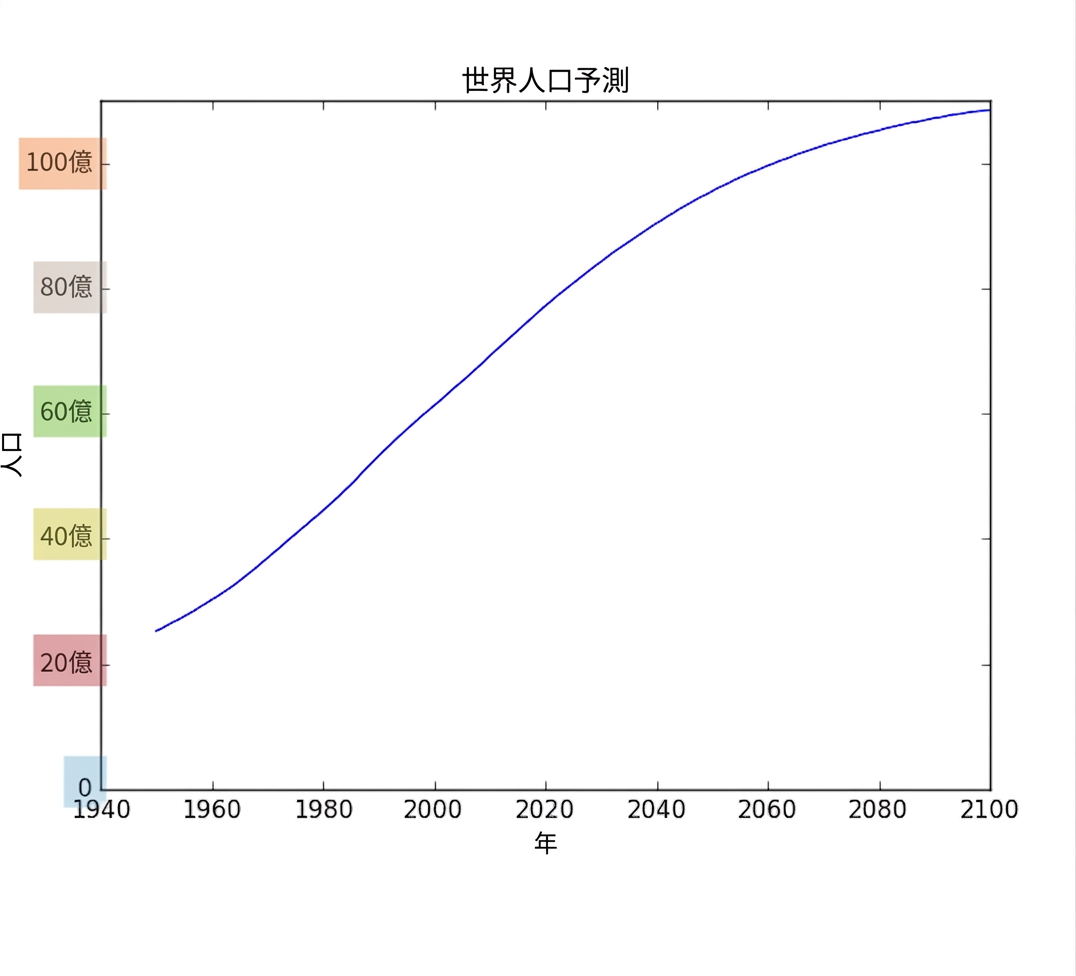
plt.yticks([0, 2, 4, 6, 8, 10],

           ['0', '2B', '4B', '6B', '8B', '10B'])


plt.show()
plt.yticks([0, 2, 4, 6, 8, 10],
['0', '2B', '4B', '6B', '8B', '10B'])
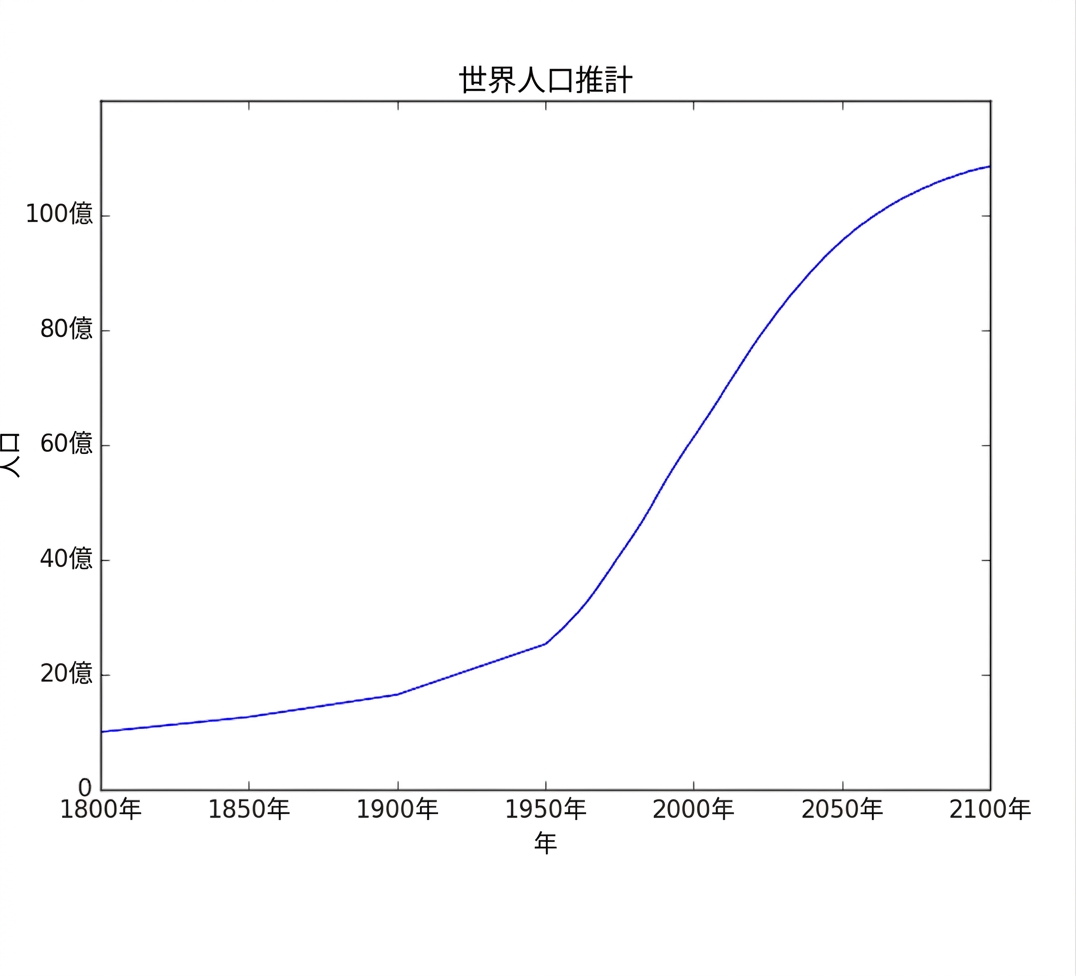
import matplotlib.pyplot as plt
year = [1950, 1951, 1952, ..., 2100]
pop = [2.538, 2.57, 2.62, ..., 10.85]


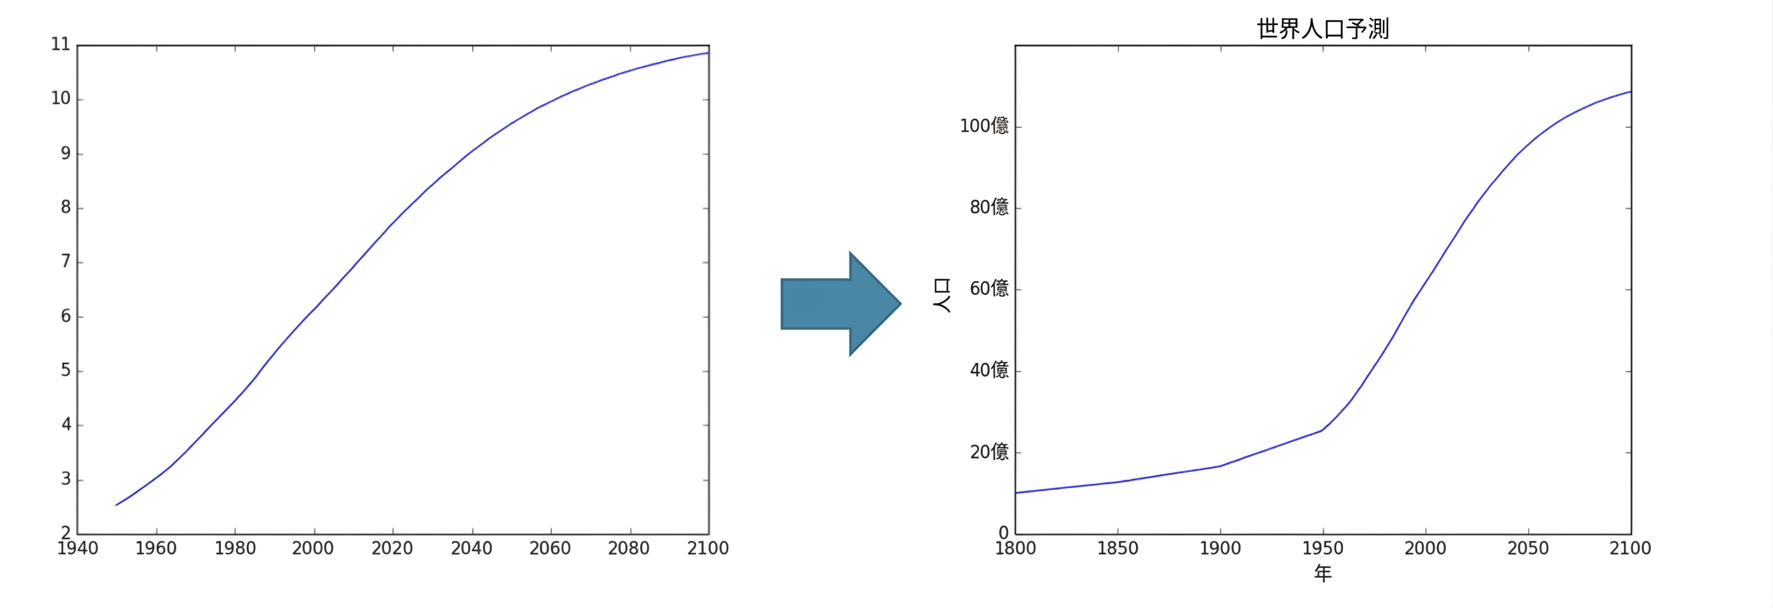
# Add more data
year = [1800, 1850, 1900] + year
pop = [1.0, 1.262, 1.650] + pop


plt.plot(year, pop)


plt.xlabel('Year')
plt.ylabel('Population')

plt.title('World Population Projections')

plt.yticks([0, 2, 4, 6, 8, 10],

           ['0', '2B', '4B', '6B', '8B', '10B'])


plt.show()
import matplotlib.pyplot as plt year = [1950, 1951, 1952, ..., 2100] pop = [2.538, 2.57, 2.62, ..., 10.85]
# Add more data year = [1800, 1850, 1900] + year pop = [1.0, 1.262, 1.650] + pop
plt.plot(year, pop)