散布度

Python を使った統計学入門

Maggie Matsui

Content Developer, DataCamp

散布度とは?
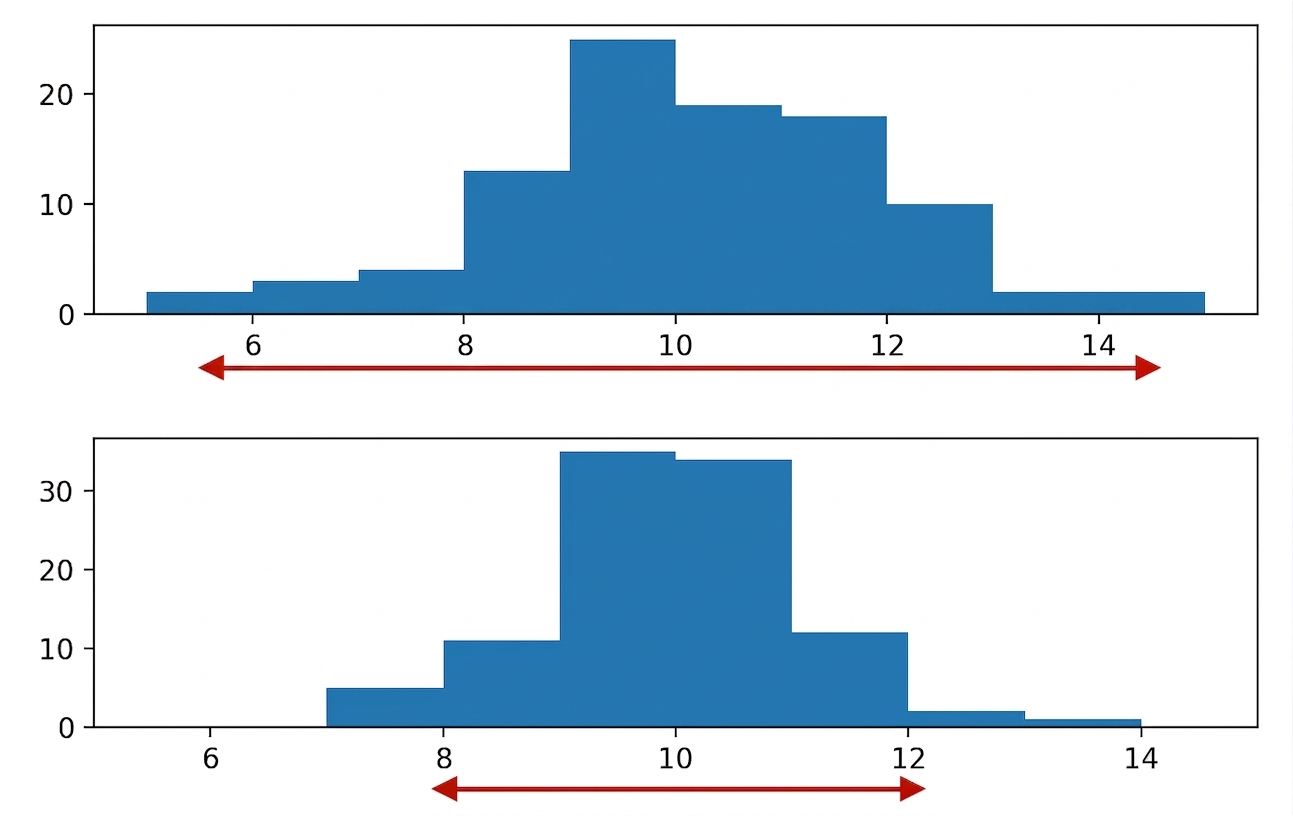
2つのヒストグラム: 1つは狭く、データがわずかな値にしか広がっていない。もう1つは広く、データがより多くの値に広がっている。

Python を使った統計学入門

分散

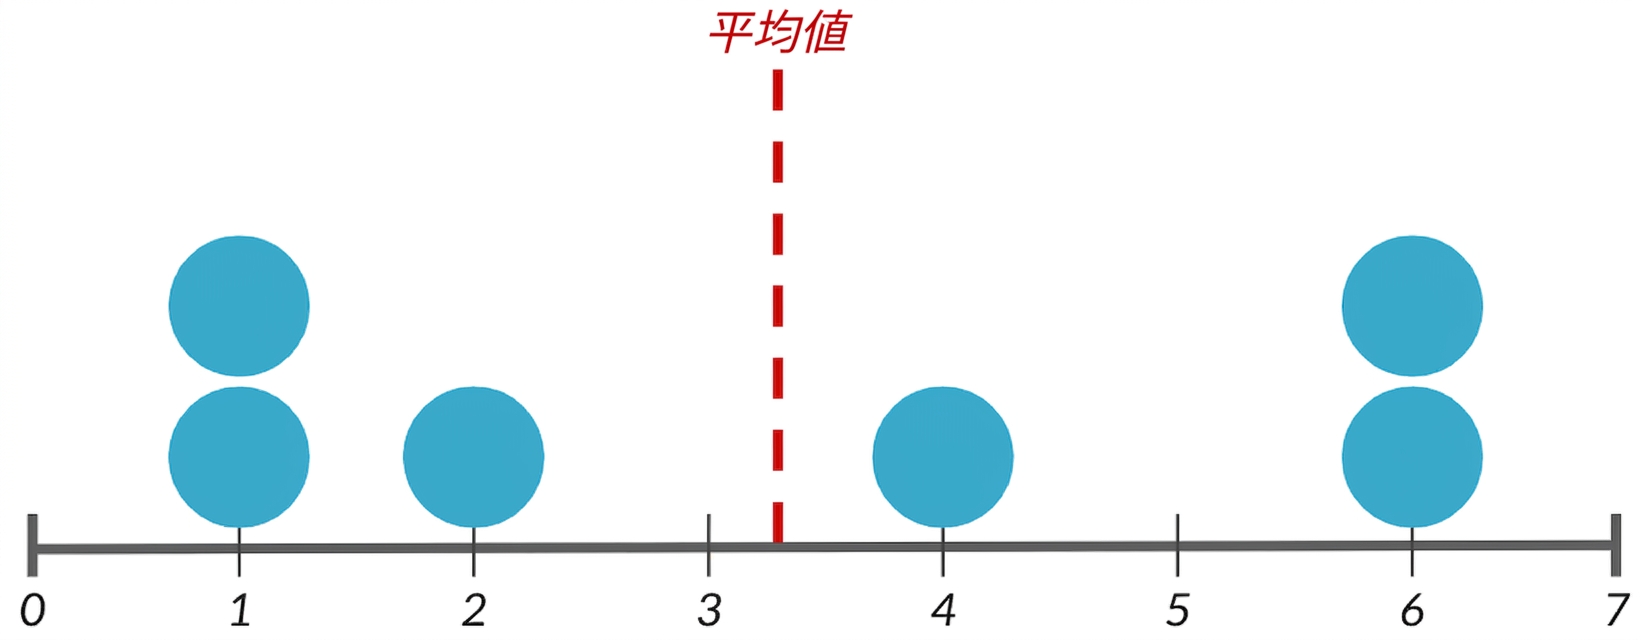
各データポイントからデータの平均値までの平均距離

平均を表す中央の赤い線がある7つのデータ点のドットプロット。

Python を使った統計学入門

分散

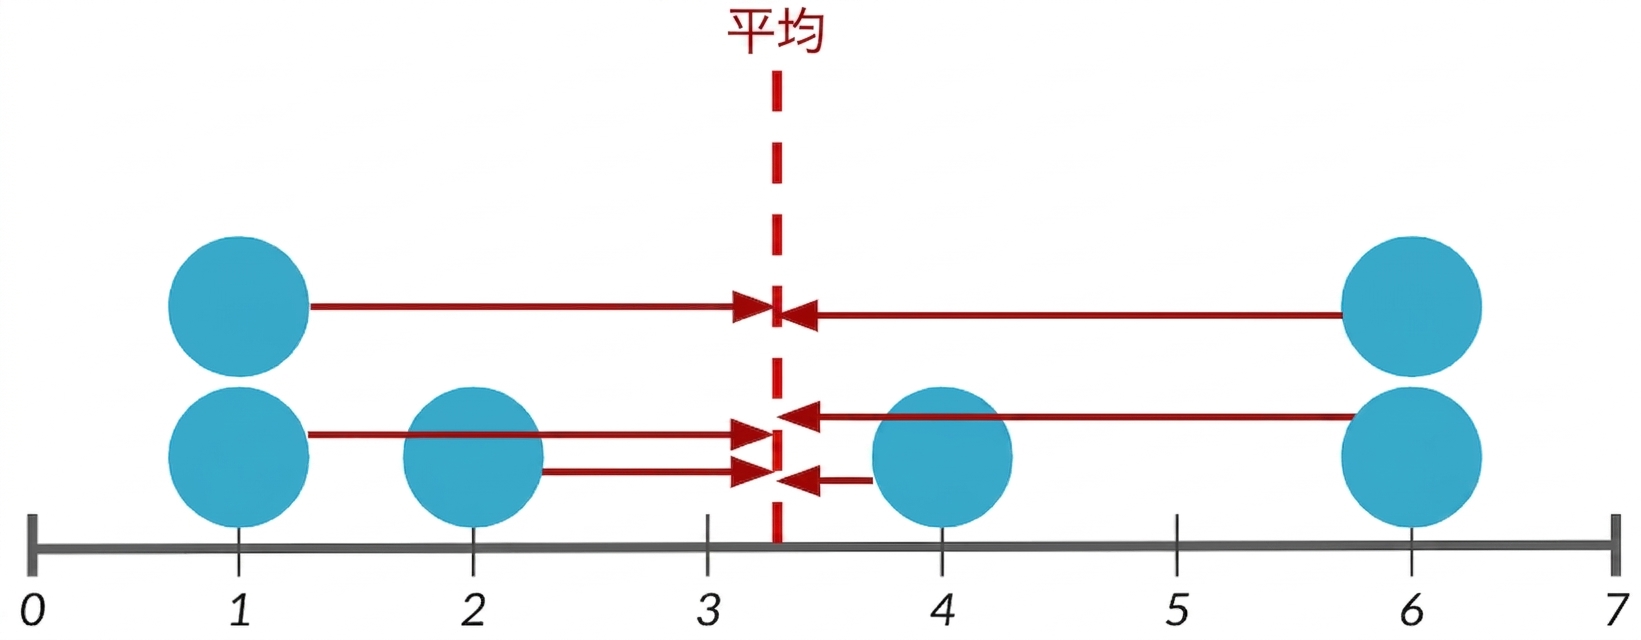
各データポイントからデータの平均値までの平均距離

7つのデータポイントのドットプロット。中央の赤い線は平均を表す。 各点と平均線の間に矢印が描かれている。

Python を使った統計学入門

分散の計算

1. 各データポイントから平均値を引く

dists = msleep['sleep_total'] - 
        np.mean(msleep['sleep_total'])
print(dists)
0     1.666265
1     6.566265
2     3.966265
3     4.466265
4    -6.433735
      ...

2. 各距離を二乗する

sq_dists = dists ** 2
print(sq_dists)
0      2.776439
1     43.115837
2     15.731259
3     19.947524
4     41.392945
      ...
Python を使った統計学入門

分散の計算

3. 二乗した距離を合計する

sum_sq_dists = np.sum(sq_dists)
print(sum_sq_dists)
1624.065542

4. データポイント数から1を引いた数で割る

variance = sum_sq_dists / (83 - 1)
print(variance)
19.805677

np.var()を使用

np.var(msleep['sleep_total'], ddof=1)
19.805677

ddof=1ではない場合、母分散標本分散の代わりに計算される:

np.var(msleep['sleep_total'])
19.567055
Python を使った統計学入門

標準偏差

np.sqrt(np.var(msleep['sleep_total'], ddof=1))
4.450357
np.std(msleep['sleep_total'], ddof=1)
4.450357
Python を使った統計学入門

平均絶対偏差

dists = msleep['sleep_total'] - np.mean(msleep['sleep_total'])

np.mean(np.abs(dists))
3.566701

標準偏差 vs. 平均絶対偏差

  • 標準偏差は距離を二乗し、短い距離より長い距離の方に強いペナルティを課す。
  • 平均絶対偏差は、各距離に等しくペナルティを課す。
  • どちらかが他方より優れているわけではないが、SD のほうが MAD より一般的。
Python を使った統計学入門

分位数

np.quantile(msleep['sleep_total'], 0.5)
10.1

$$

                    **_0.5 quantile = median_**

分位数:

np.quantile(msleep['sleep_total'], [0, 0.25, 0.5, 0.75, 1])
array([ 1.9 ,  7.85, 10.1 , 13.75, 19.9 ])
Python を使った統計学入門

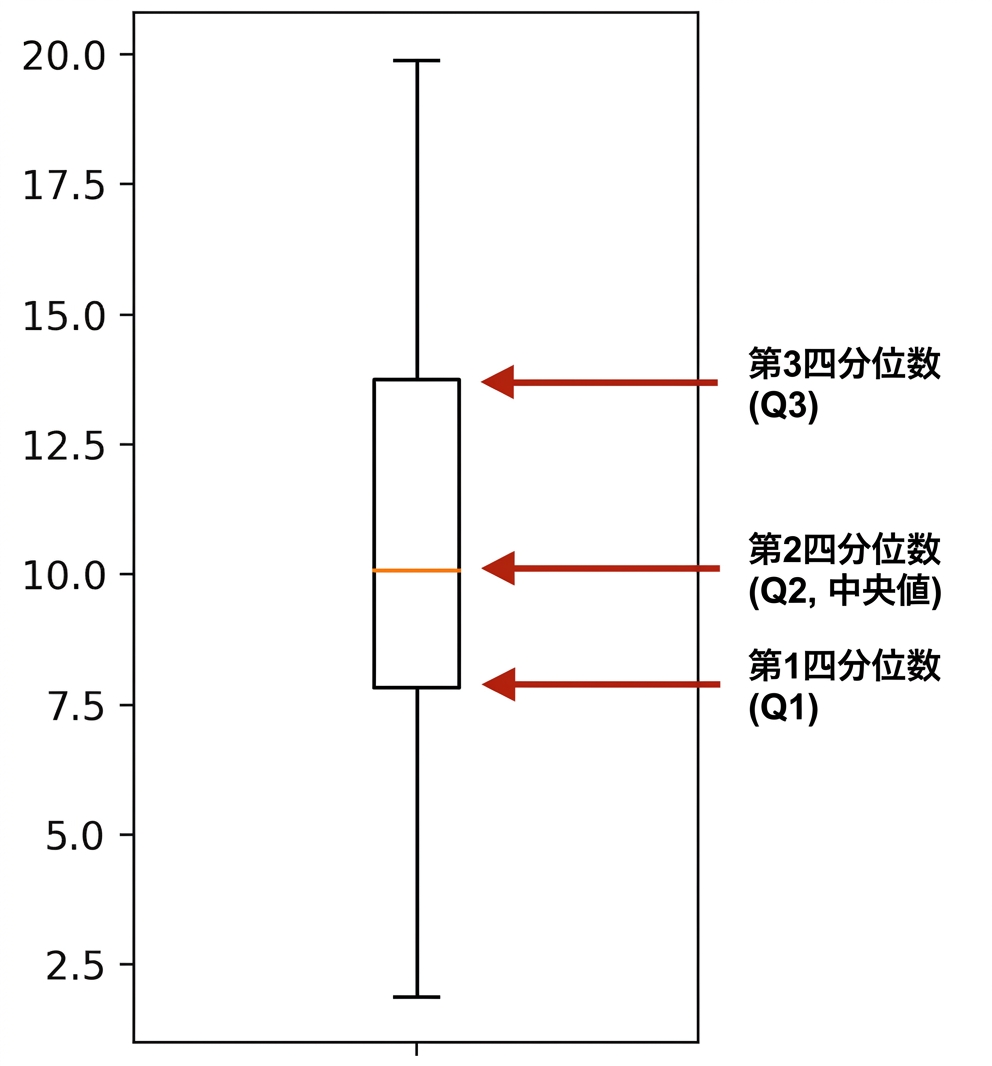
箱ひげ図で四分位数を使用する

import matplotlib.pyplot as plt
plt.boxplot(msleep['sleep_total'])
plt.show()

sleep_total boxplot.png

Python を使った統計学入門

np.linspace() を使用した四分位数

np.quantile(msleep['sleep_total'], [0, 0.2, 0.4, 0.6, 0.8, 1])
array([ 1.9 ,  6.24,  9.48, 11.14, 14.4 , 19.9 ])

np.linspace(start, stop, num)

np.quantile(msleep['sleep_total'], np.linspace(0, 1, 5))
array([ 1.9 ,  7.85, 10.1 , 13.75, 19.9 ])
Python を使った統計学入門

四分位範囲(IQR)

箱ひげ図の箱の高さ

np.quantile(msleep['sleep_total'], 0.75) - np.quantile(msleep['sleep_total'], 0.25)
5.9
from scipy.stats import iqr
iqr(msleep['sleep_total'])
5.9
Python を使った統計学入門

外れ値

外れ値: 他のものと大きく異なるデータポイント

実質的な違いはどのようにしたら分かるのか?データポイントが外れ値の場合:

  • $\text{data} < \text{Q1} - 1.5\times\text{IQR}$ または
  • $\text{data} > \text{Q3} + 1.5\times\text{IQR}$
Python を使った統計学入門

外れ値を見つける

from scipy.stats import iqr
iqr = iqr(msleep['bodywt'])

lower_threshold = np.quantile(msleep['bodywt'], 0.25) - 1.5 * iqr upper_threshold = np.quantile(msleep['bodywt'], 0.75) + 1.5 * iqr
msleep[(msleep['bodywt'] < lower_threshold) | (msleep['bodywt'] > upper_threshold)]
                    name   vore  sleep_total    bodywt
4                    Cow  herbi          4.0   600.000
20        Asian elephant  herbi          3.9  2547.000
22                 Horse  herbi          2.9   521.000
...
Python を使った統計学入門

まとめて行う場合

msleep['bodywt'].describe()
count      83.000000
mean      166.136349
std       786.839732
min         0.005000
25%         0.174000
50%         1.670000
75%        41.750000
max      6654.000000
Name: bodywt, dtype: float64
Python を使った統計学入門

練習しましょう!

Python を使った統計学入門

Preparing Video For Download...