ドットプロット

データ可視化への理解

Richie Cotton

Data Evangelist at DataCamp

ドットプロットはどんなときに使うべきか?

  1. カテゴリ変数があるとき
  2. 各カテゴリの数値を対数スケールで示したいとき
  3. 各カテゴリごとに複数の数値を示したいとき
データ可視化への理解

近隣恒星と褐色矮星

距離(光年) 質量(太陽質量)
太陽 0.0000158 1.0000
プロキシマ・ケンタウリ 4.2441000 0.1221
ケンタウルス座α星A 4.3650000 1.1000
ケンタウルス座α星B 4.3650000 0.9070
バーナード星 5.9577000 0.1040
ルーマン16A 6.5029000 0.0320
... ... ...
データ可視化への理解

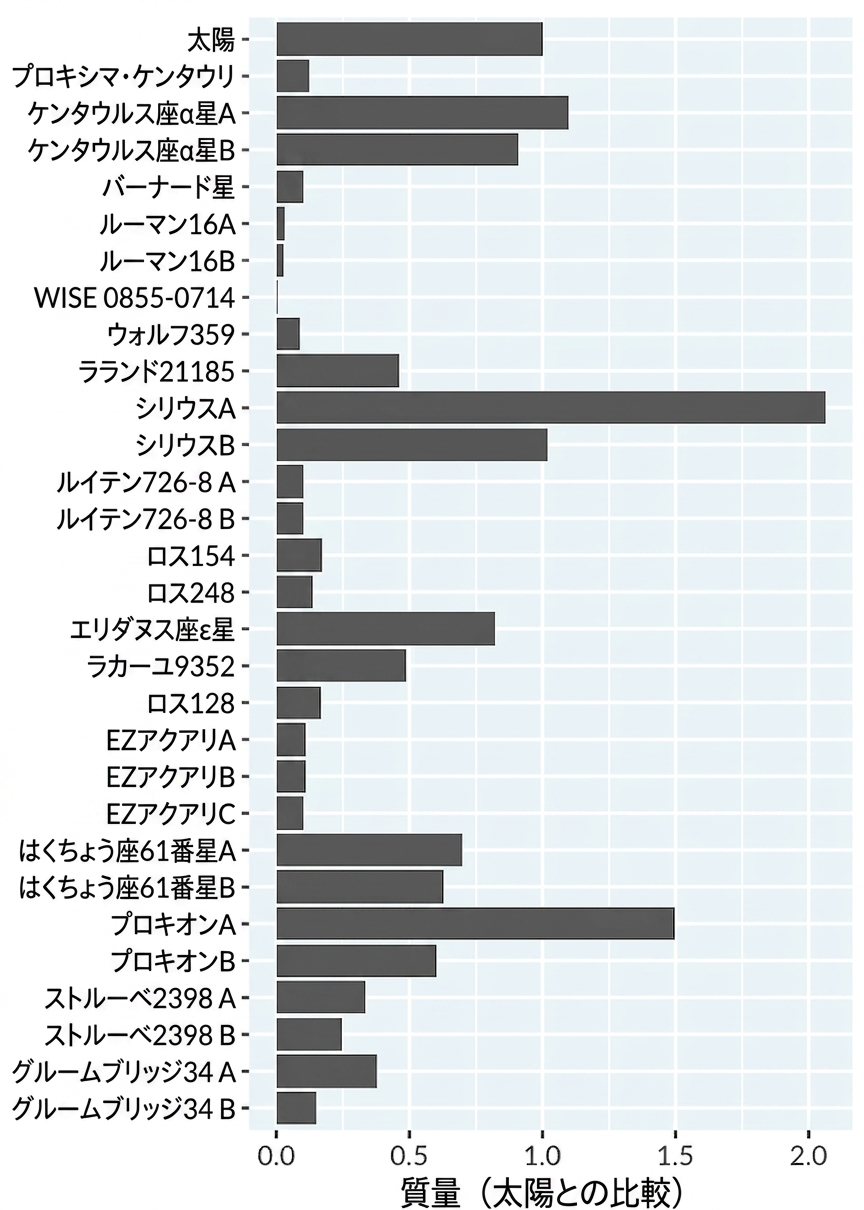
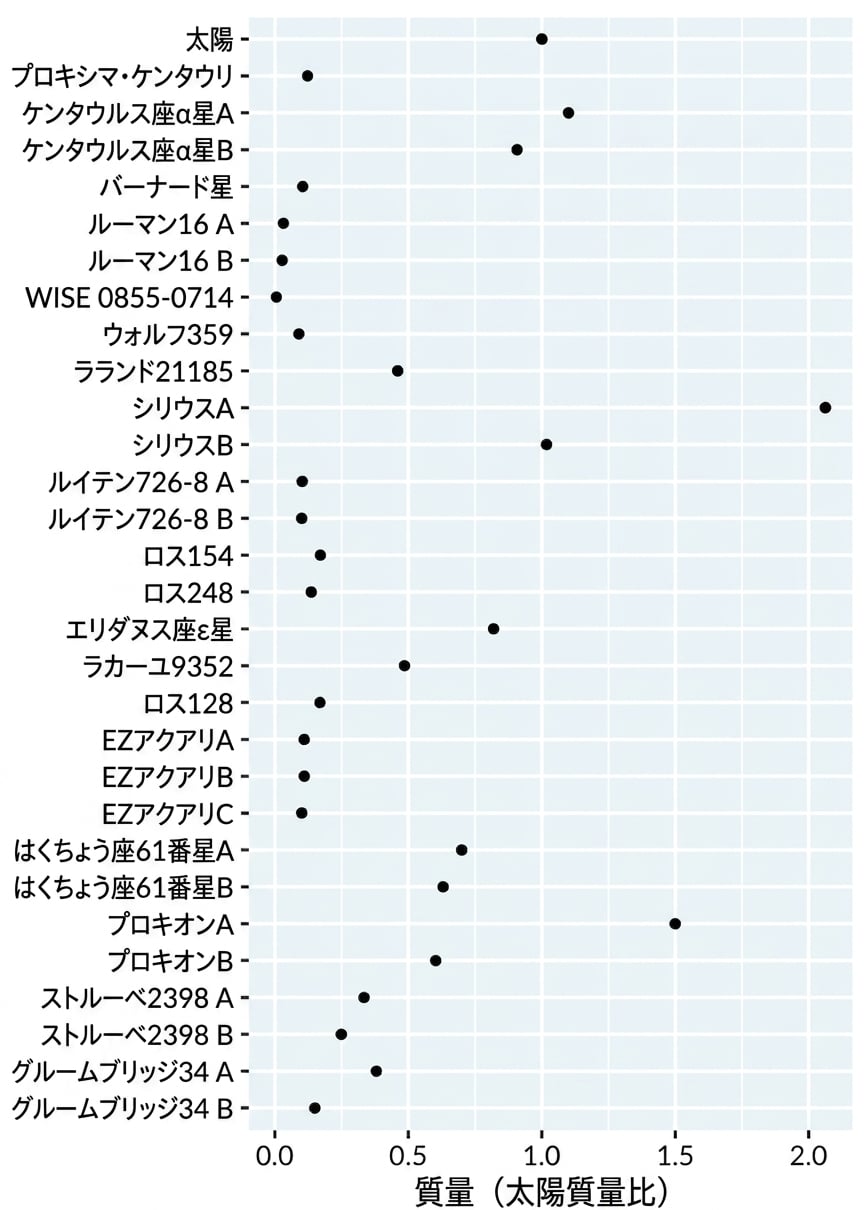
棒グラフ vs. ドットプロット

A bar plot of the mass of nearby stars relative to The Sun. Stars are ordered from nearest to furthest.

A dot plot of the mass of nearby stars relative to The Sun. Stars are ordered from nearest to furthest.

データ可視化への理解

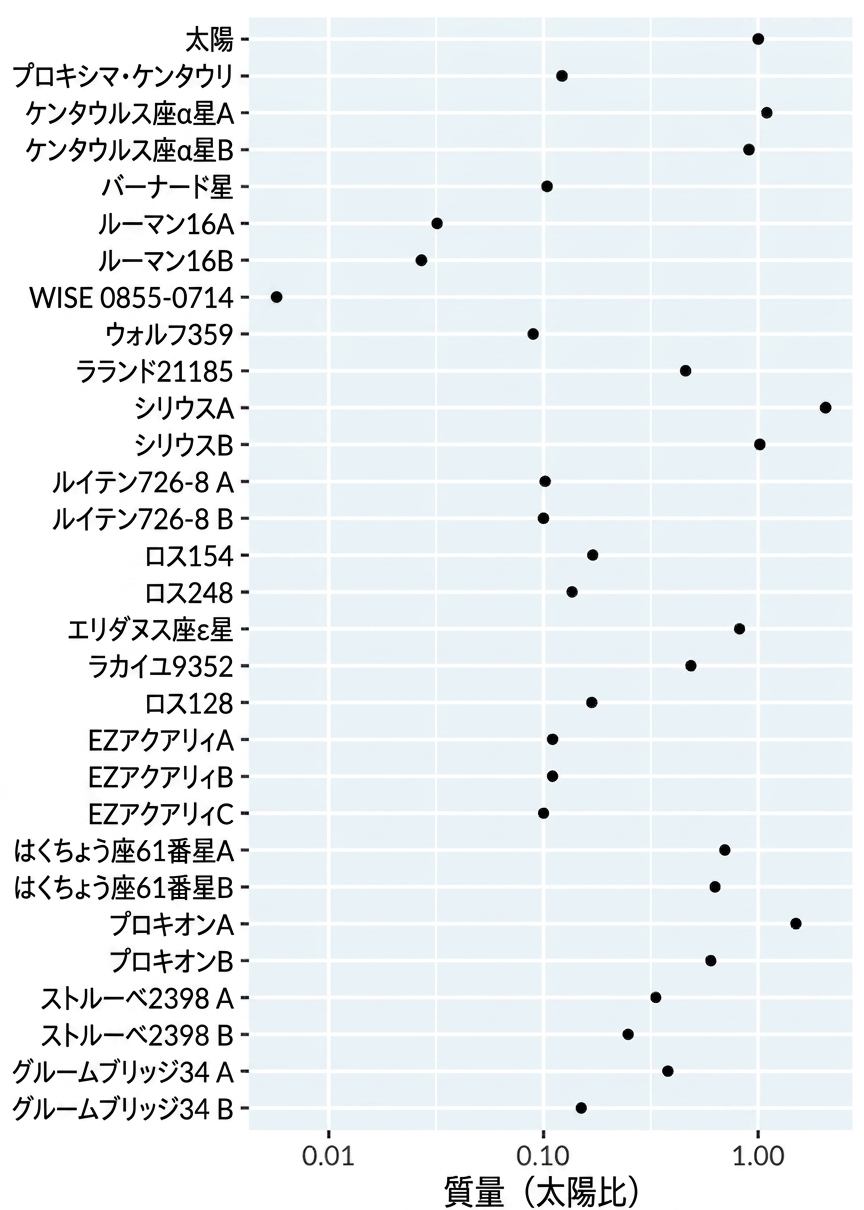
対数スケール

A bar plot of the mass of nearby stars relative to The Sun. Stars are ordered from nearest to furthest. The x-axis is on a logarithmic scale.

データ可視化への理解

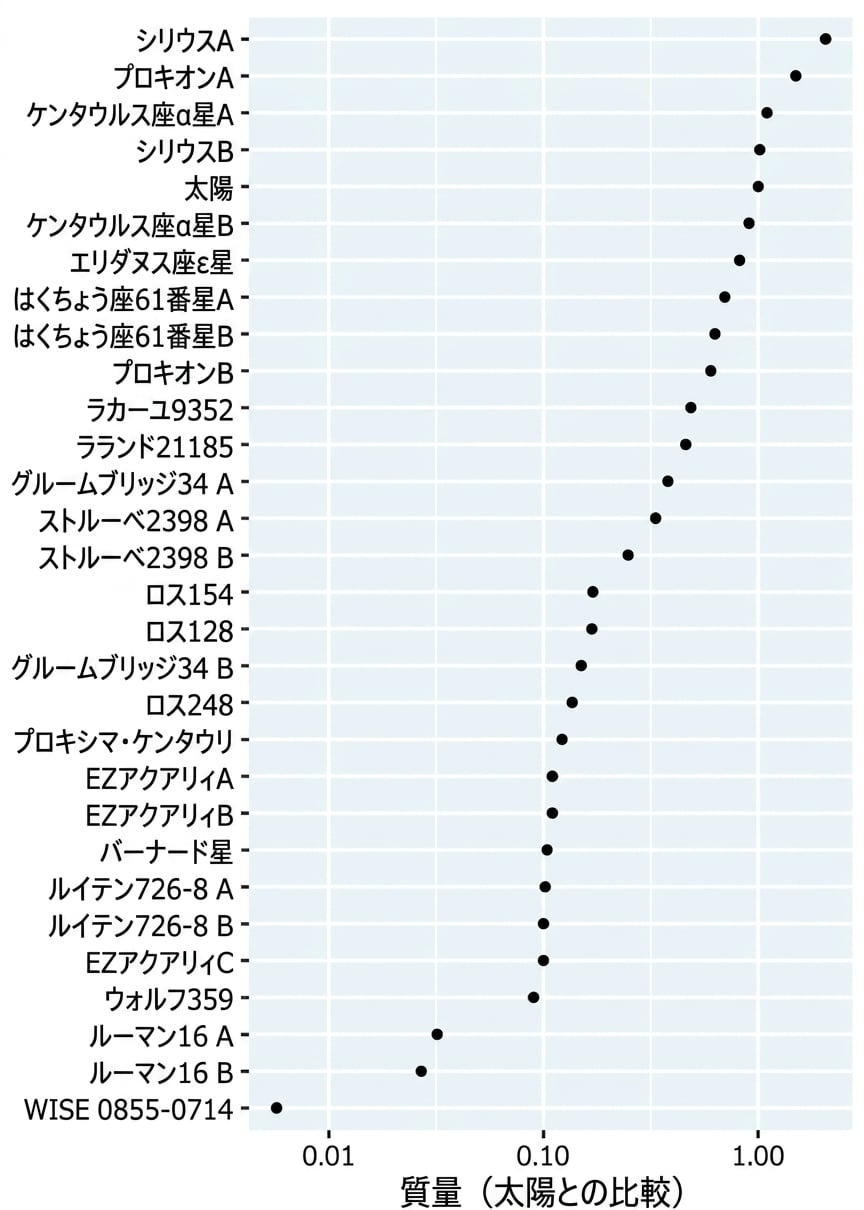
行の並べ替え

A bar plot of the mass of nearby stars relative to The Sun. Stars are ordered from heaviest to lightest. The x-axis is on a logarithmic scale.

データ可視化への理解

練習しましょう!

データ可視化への理解

Preparing Video For Download...