色を利用する

データ可視化への理解

Richie Cotton

Data Evangelist at DataCamp

色空間: 赤・緑・青
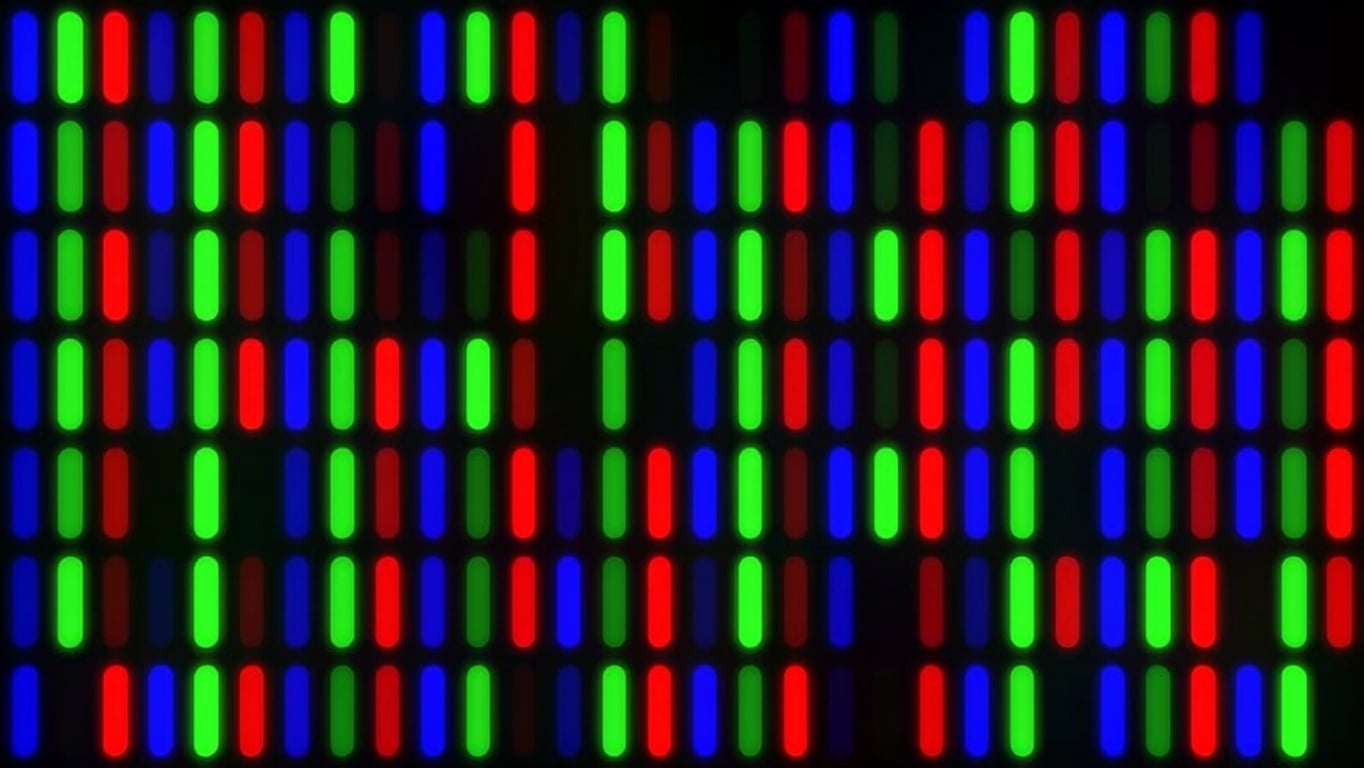
shutterstock_1622648830.jpg

データ可視化への理解

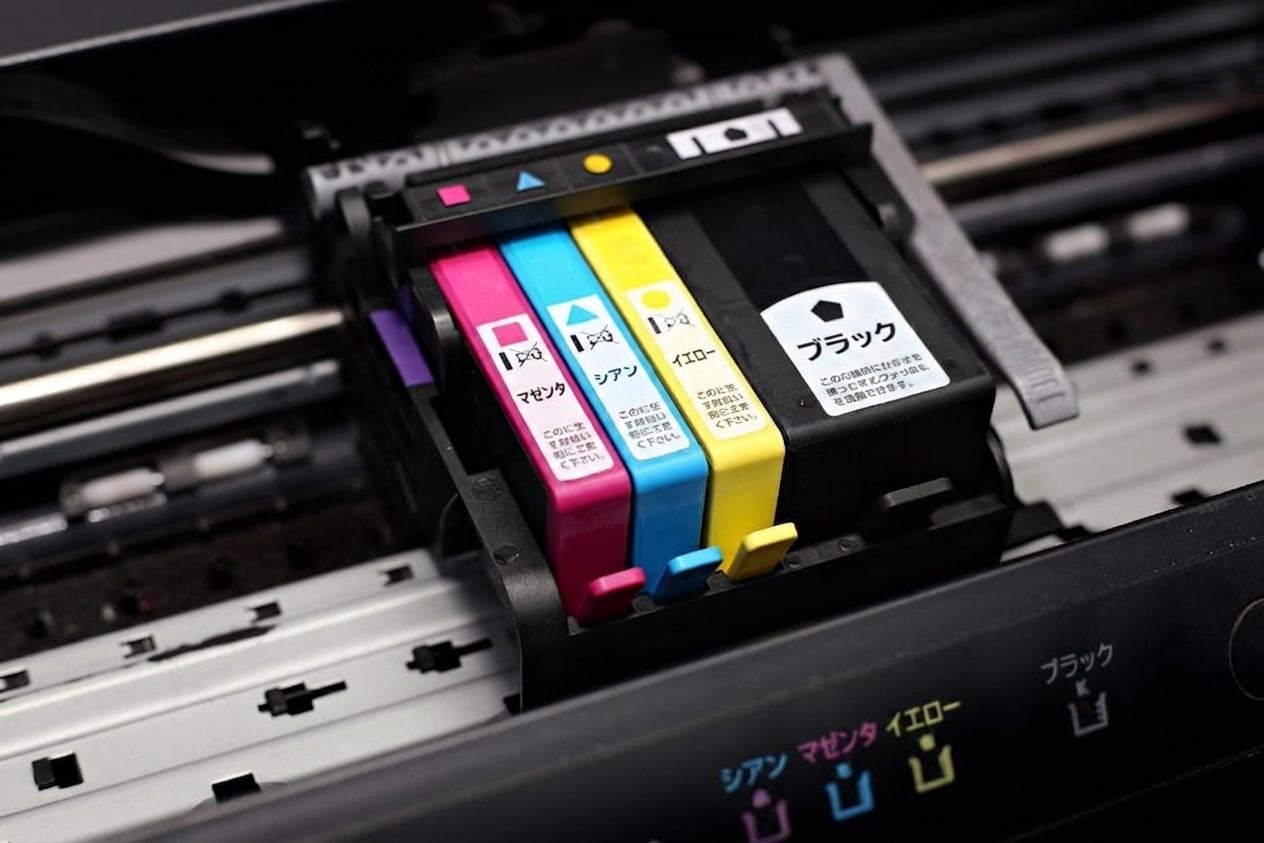
色空間: シアン-マゼンタ-イエロー-ブラック

shutterstock_505703968.jpg

データ可視化への理解

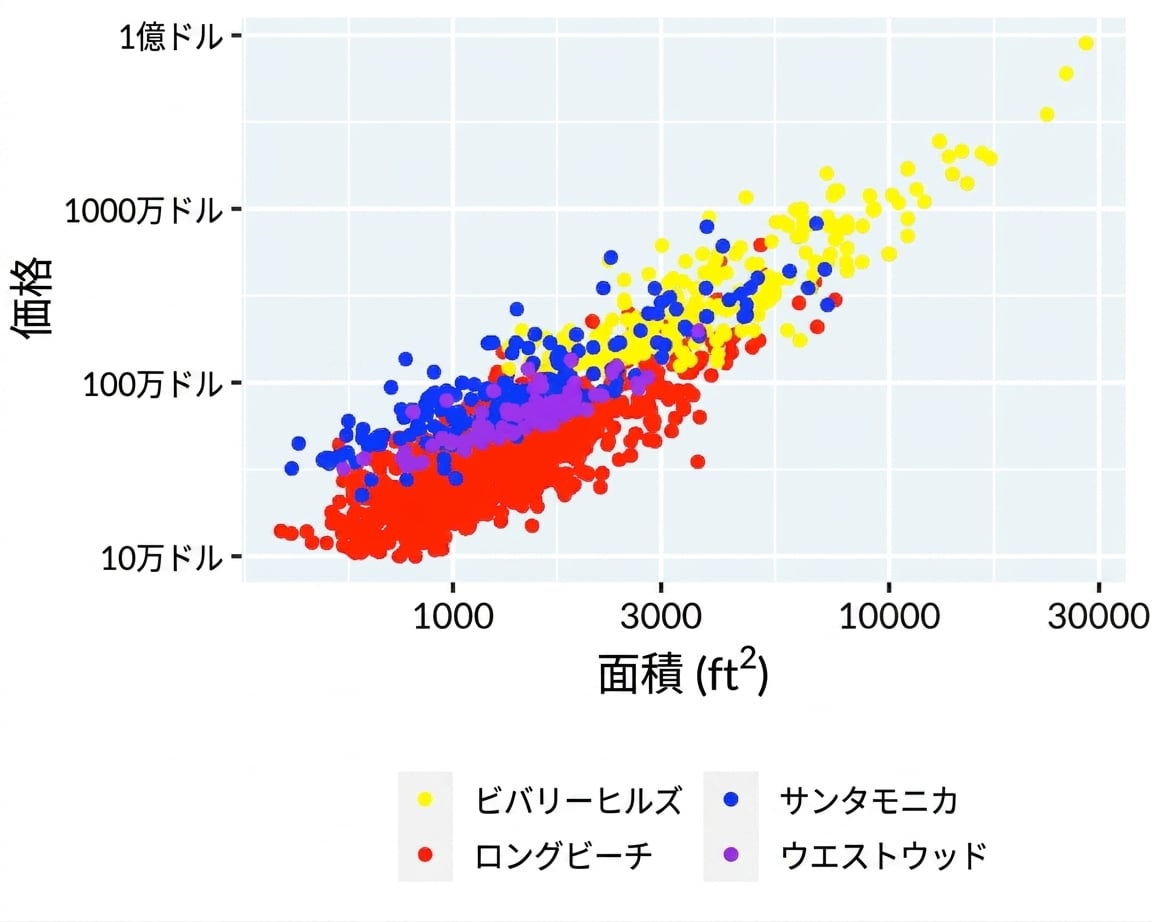
グラフにおける色の選択

Scatter plott of price vs area with a bad color palette

  • それぞれの色は同様に目立って見えるべき
  • グラフ内のある色と隣の色までの知覚的距離は一定であるべき
データ可視化への理解

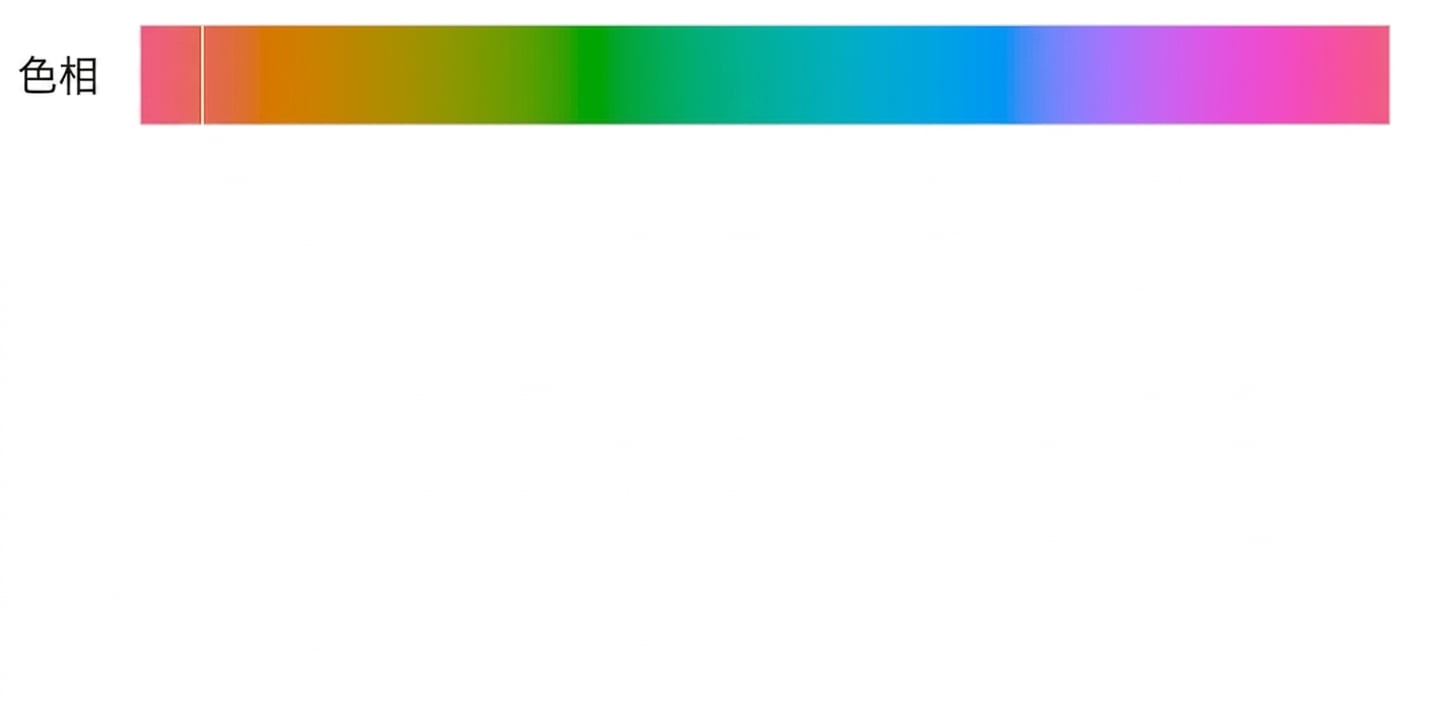
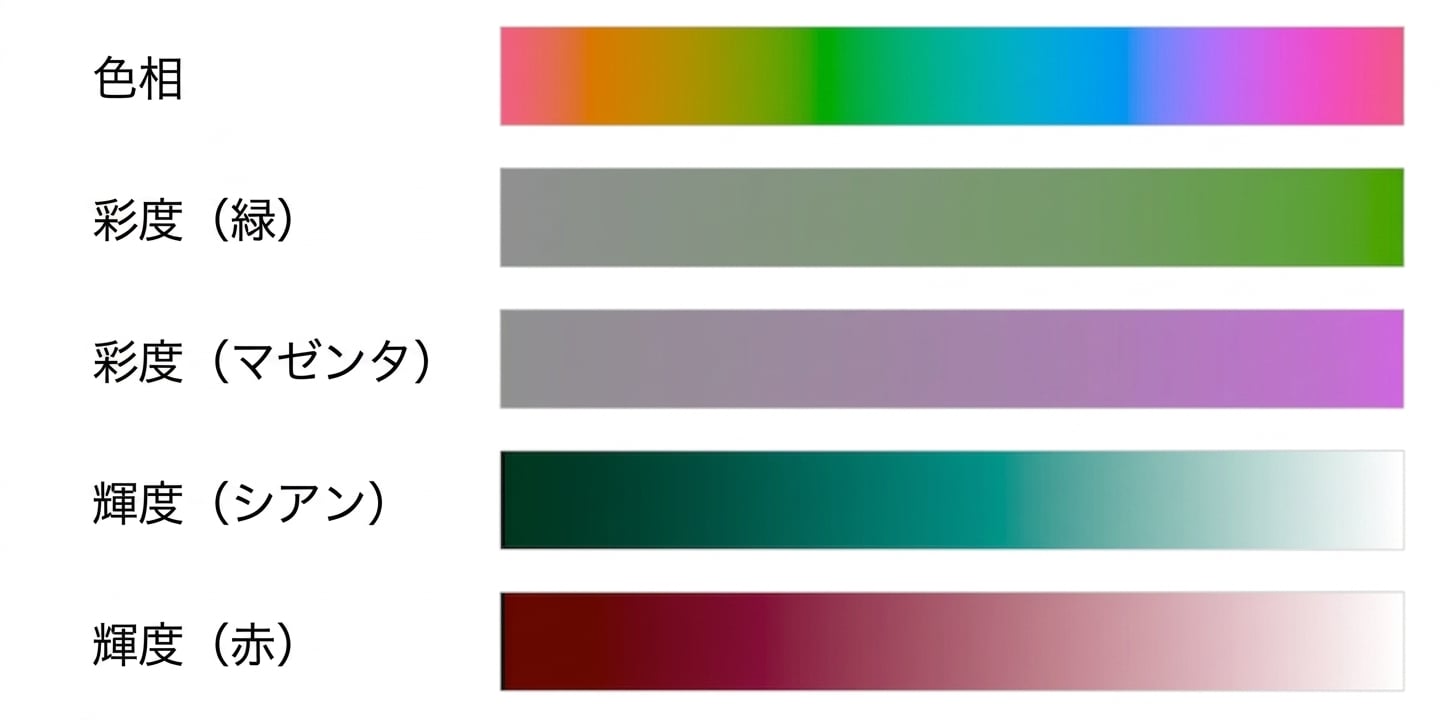
色空間: 色相・彩度・輝度

Hue color swatch

データ可視化への理解

色空間: 色相・彩度・輝度

Chrome and luminance color swatches

データ可視化への理解

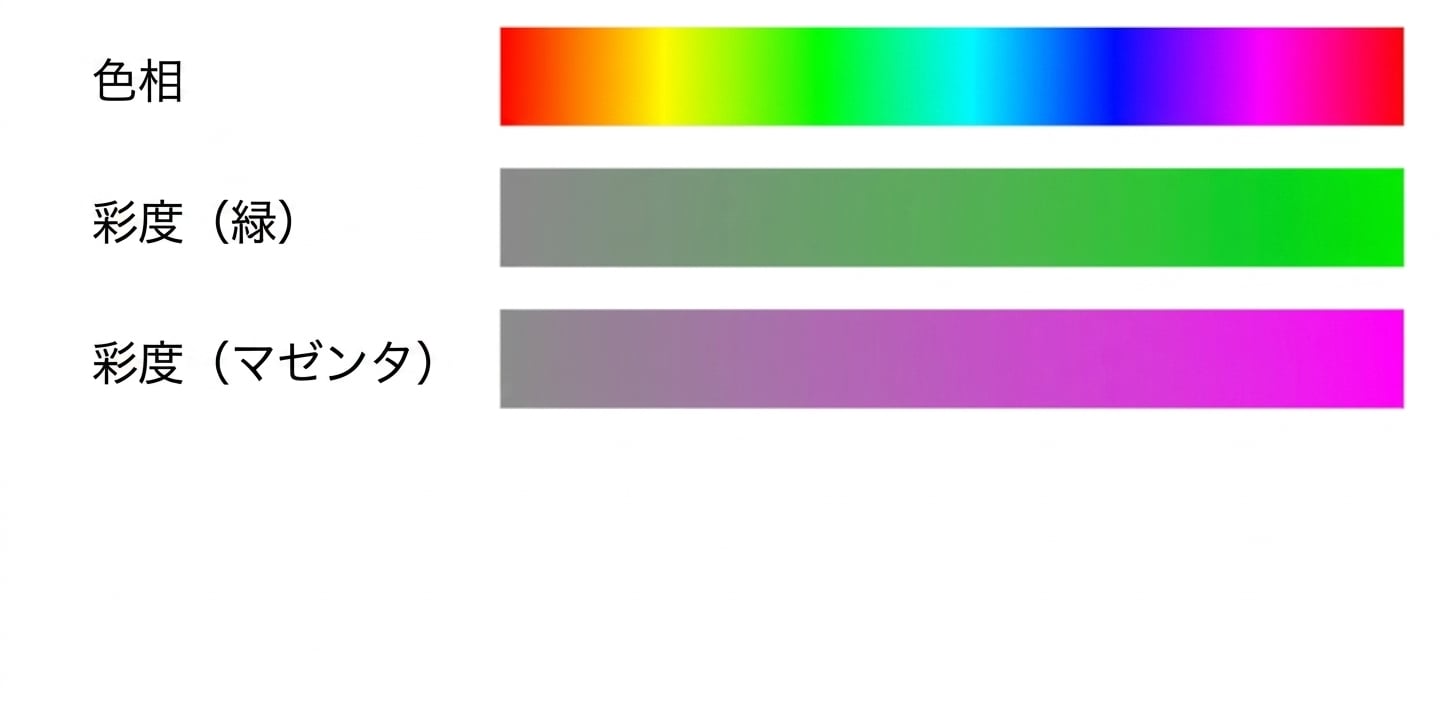
色空間: 色相・彩度・輝度

Hue, chrome, and luminance color swatches

データ可視化への理解

3種類のカラースケール:質的カラースケール

種類 目的 変えるもの
質的 順序なしカテゴリの区別 色相

Color swatch for qualitative data

データ可視化への理解

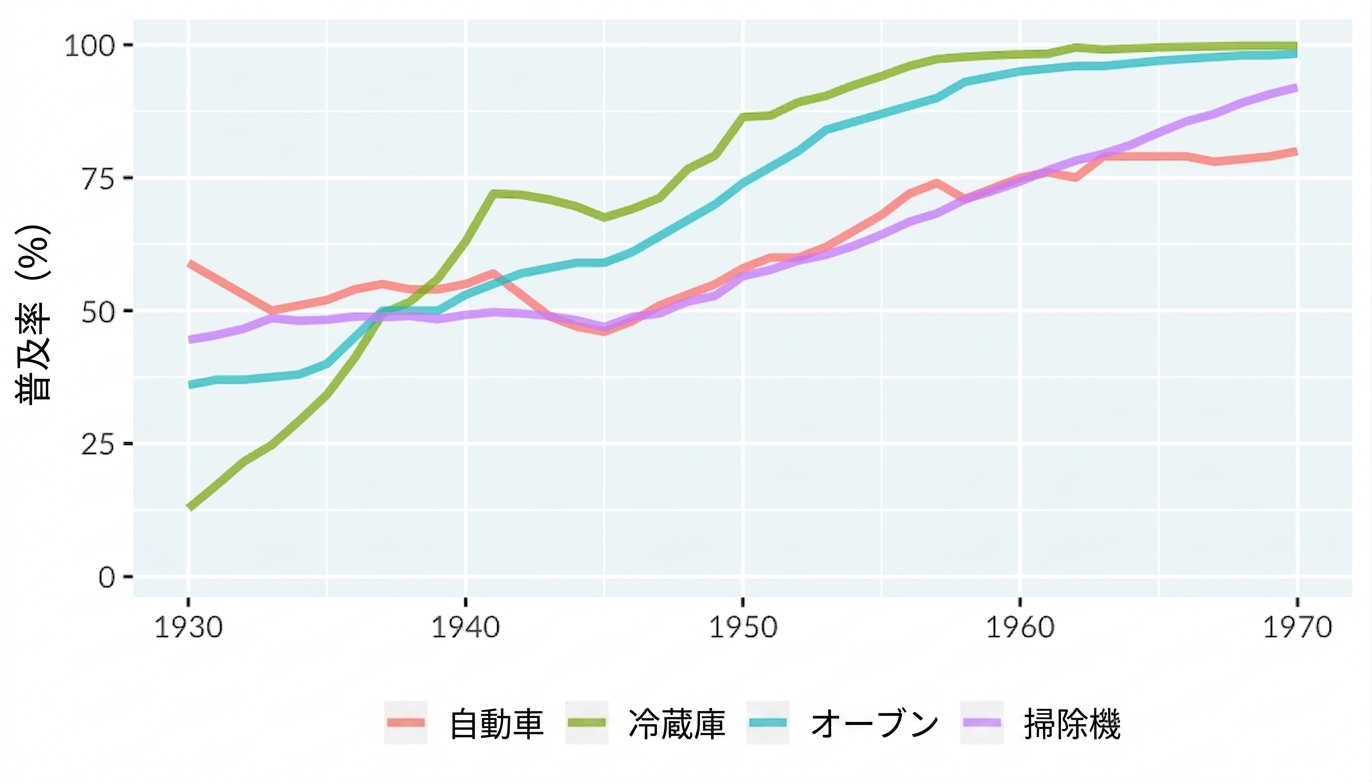
質的スケールの例

A line plot of technology adoption by households in the United States. The x-axis runs from 1930 to 1970, and the y-axis runs from 0 to 100 percent. There are four lines representing adoption of automobiles, refrigerators, stoves, and vacuums.

データ可視化への理解

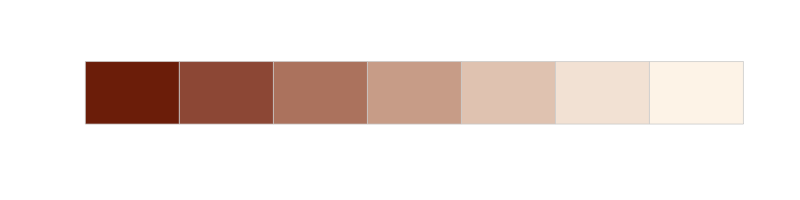
3種類のカラースケール:連続的カラースケール

種類 目的 変えるもの
連続的 順序を提示 彩度または輝度

Swatch for sequential color scale

データ可視化への理解

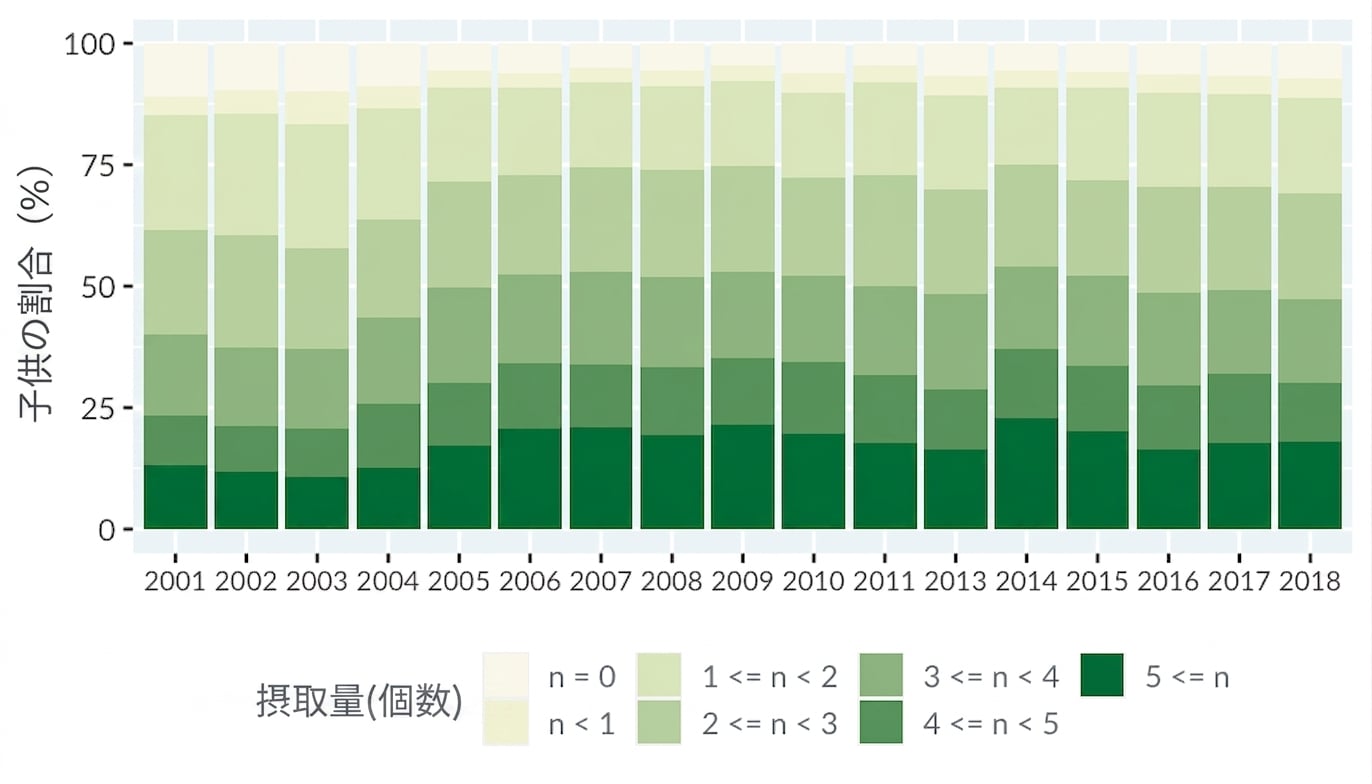
連続的スケールの例

Bar plot of vegetable consumption by year

データ可視化への理解

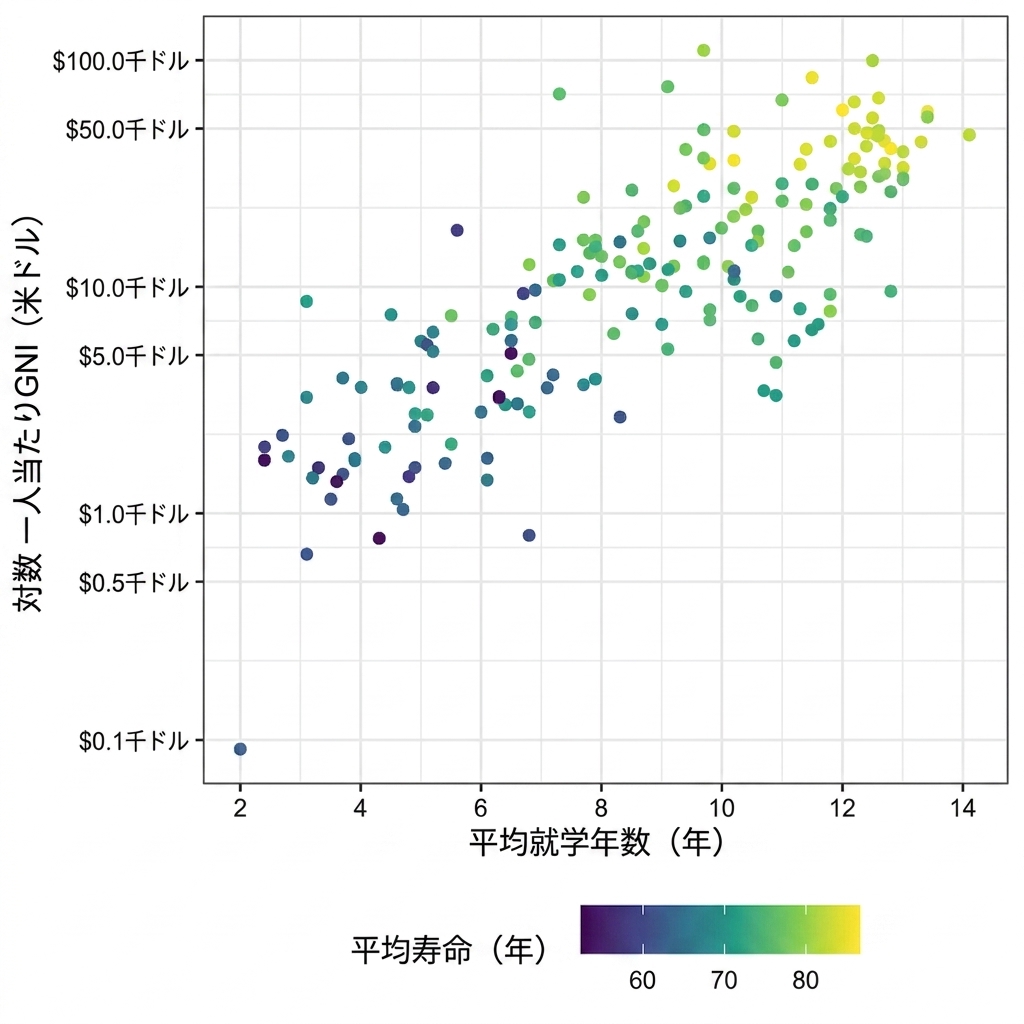
もう一つの連続的スケールの例

Scatter plot of length of schooling versus GNI and average life expectancy represented by color

1 Viridisカラースケール: https://bids.github.io/colormap
データ可視化への理解

3種類のカラースケール:発散的カラースケール

種類 目的 変えるもの
発散的 中間点の上下を強調 2色相の彩度または輝度

Color swatch for diverging data

データ可視化への理解

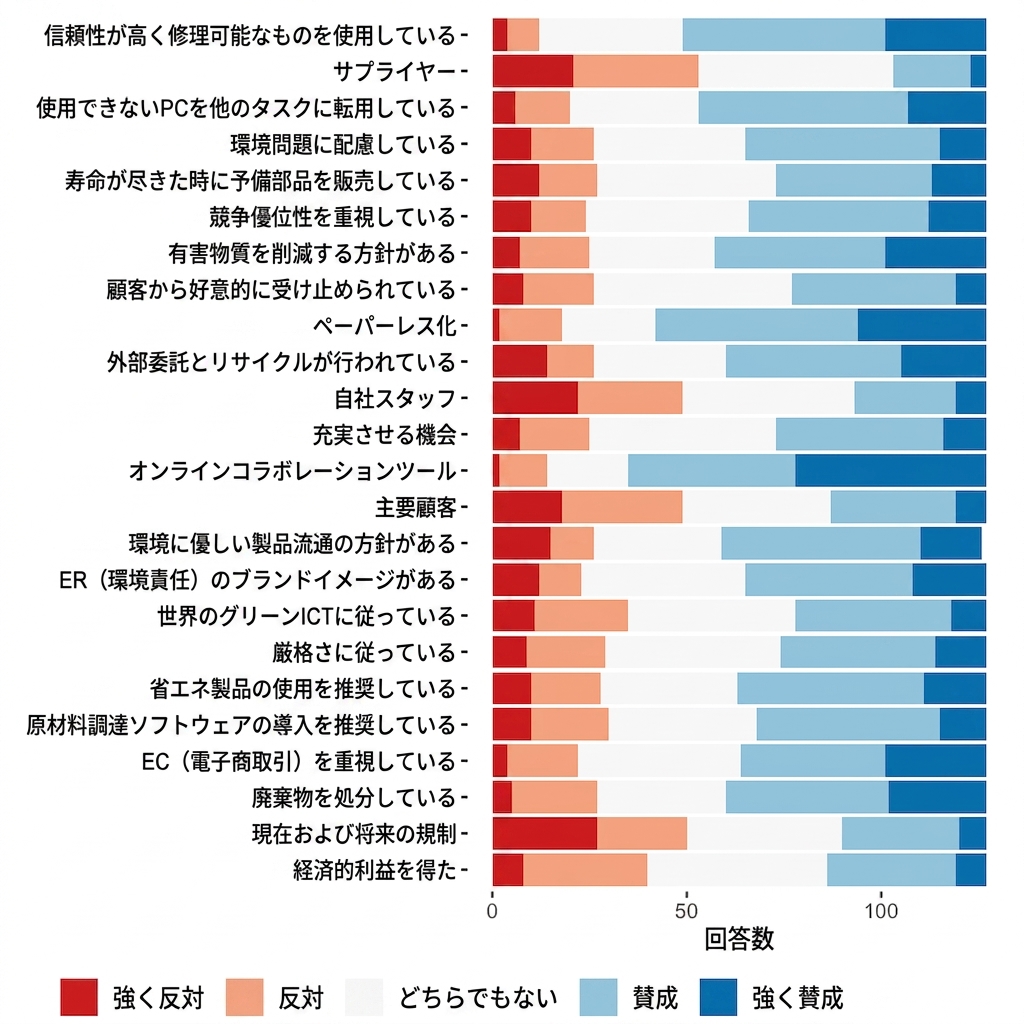
マレーシアにおけるグリーンテック調査データセット

質問 回答 n
信頼性が高く修理可能である まったくそう思わない 4
信頼性が高く修理可能である そう思わない 8
信頼性が高く修理可能である どちらとも言えない 37
信頼性が高く修理可能である そう思う 52
信頼性が高く修理可能である とてもそう思う 26
... ... ...
1 Islam et al. (2019) http://dx.doi.org/10.17632/wggvryfhsk.1
データ可視化への理解

発散的スケールの例

Bar plot of likert survey

データ可視化への理解

練習しましょう!

データ可視化への理解

Preparing Video For Download...