極座標

データ可視化への理解

Richie Cotton

Data Evangelist at DataCamp

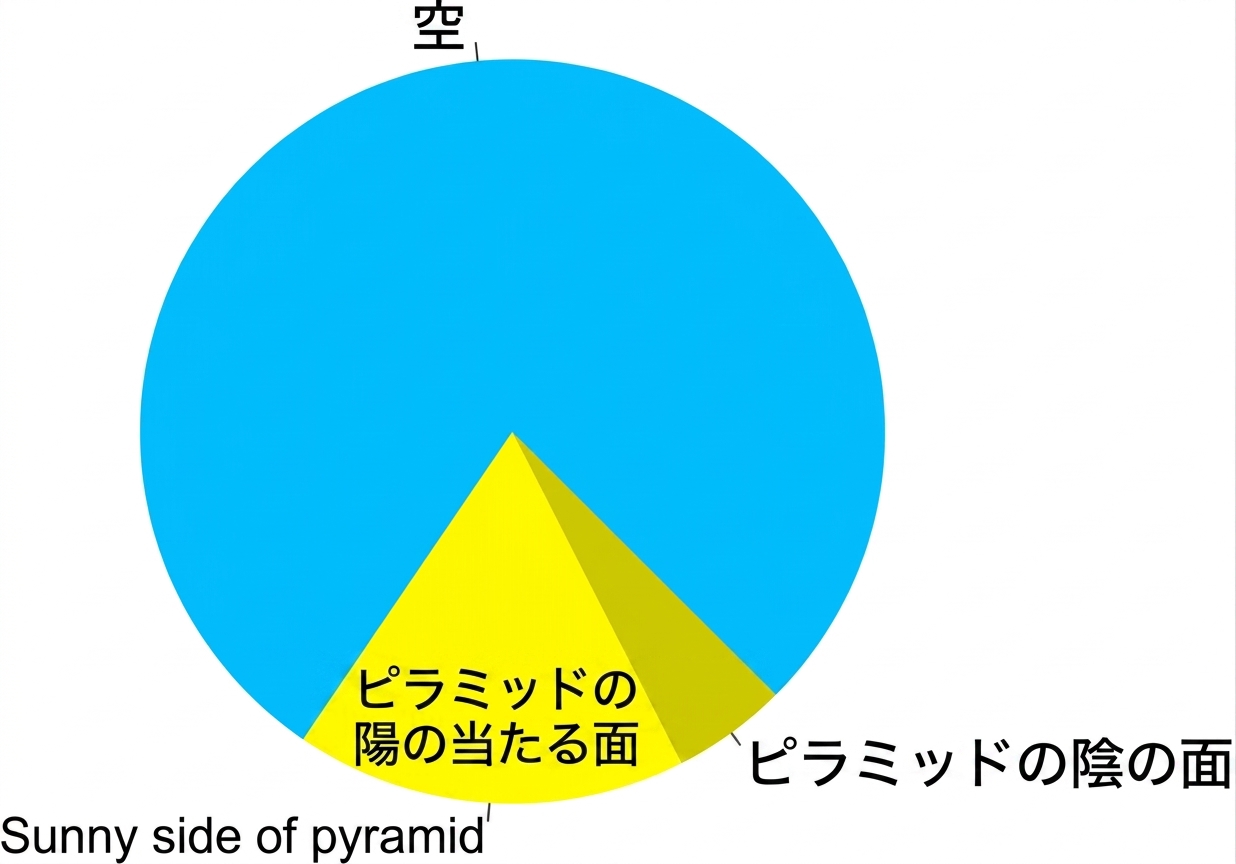
円グラフ

Pie plot showing a pyramid and the sky

データ可視化への理解

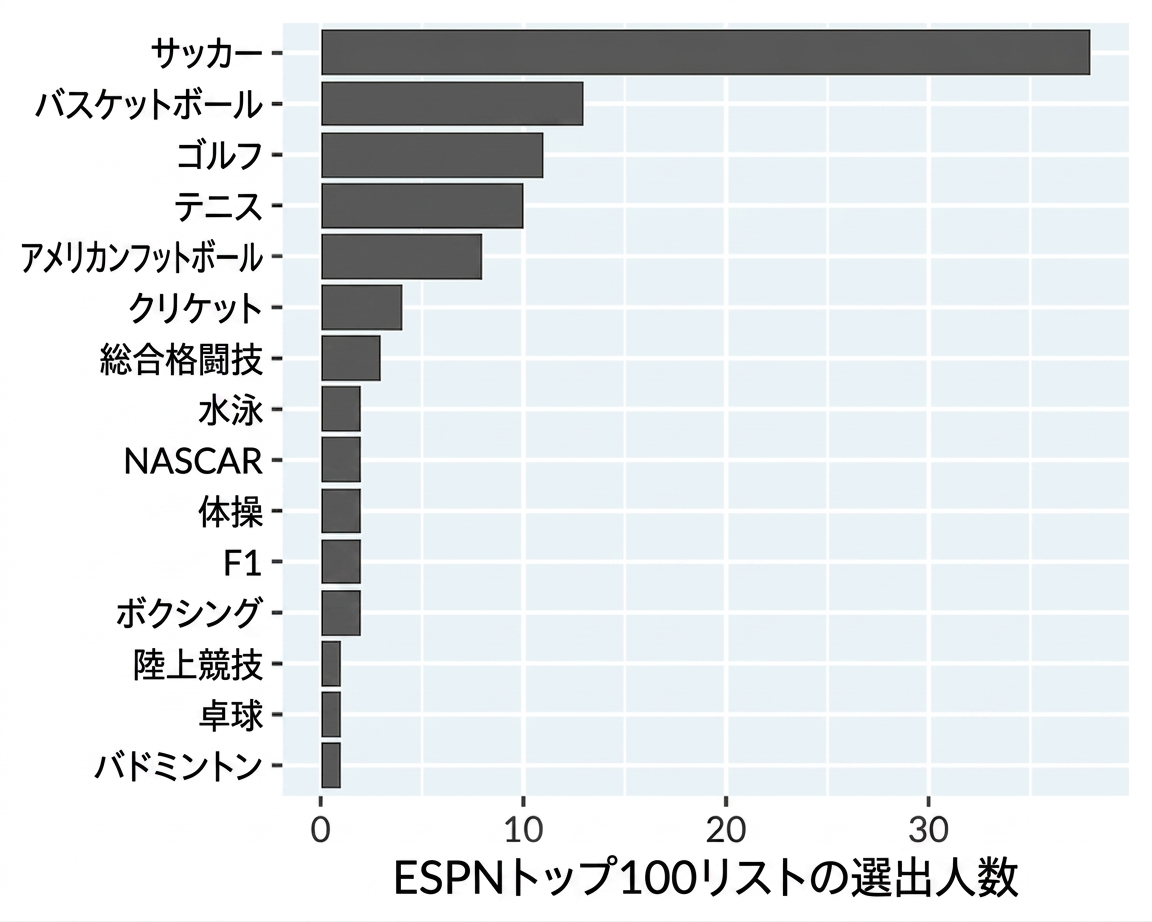
ESPN スポーツ別有名アスリート

Bar plot of famous athletes by sport

データ可視化への理解

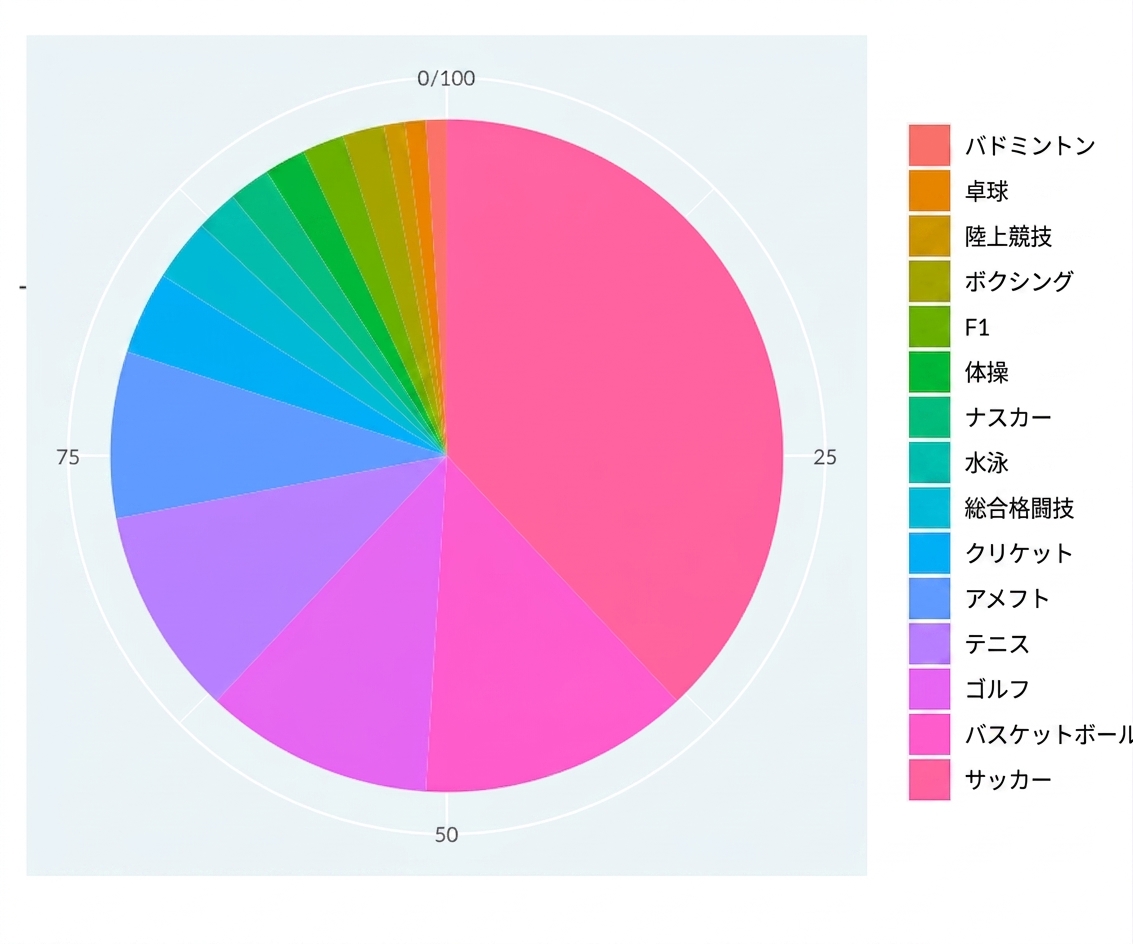
棒グラフ + 極座標 = 円グラフ

Pie plot of famous athletes by sport

データ可視化への理解

極座標はどんなときに使うべきか?

  • 基本的に使うべきではない
  • 自然に循環する変数がある場合は例外(時刻、方位など)
データ可視化への理解

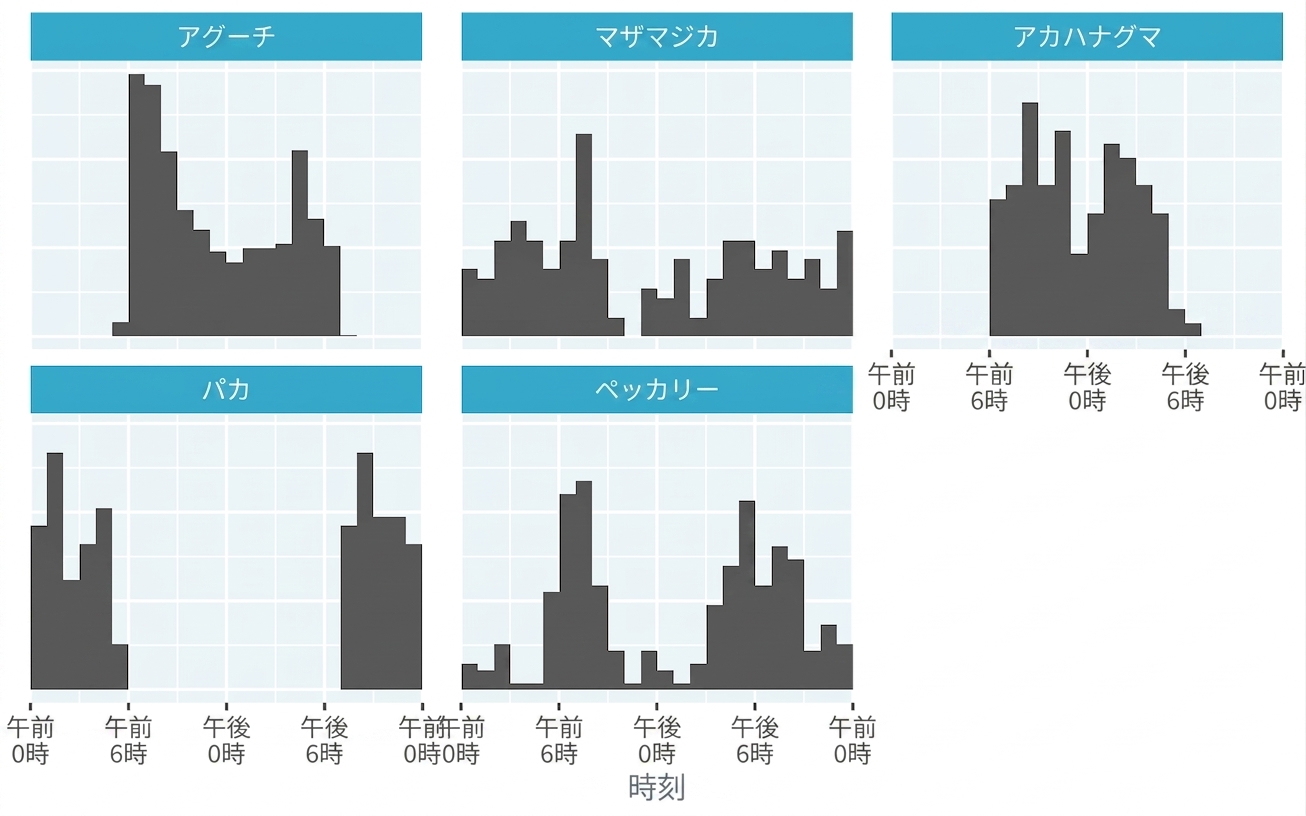
動物の活動のヒストグラム

Histogram of animal activity from the Panama camera trap dataset

データ可視化への理解

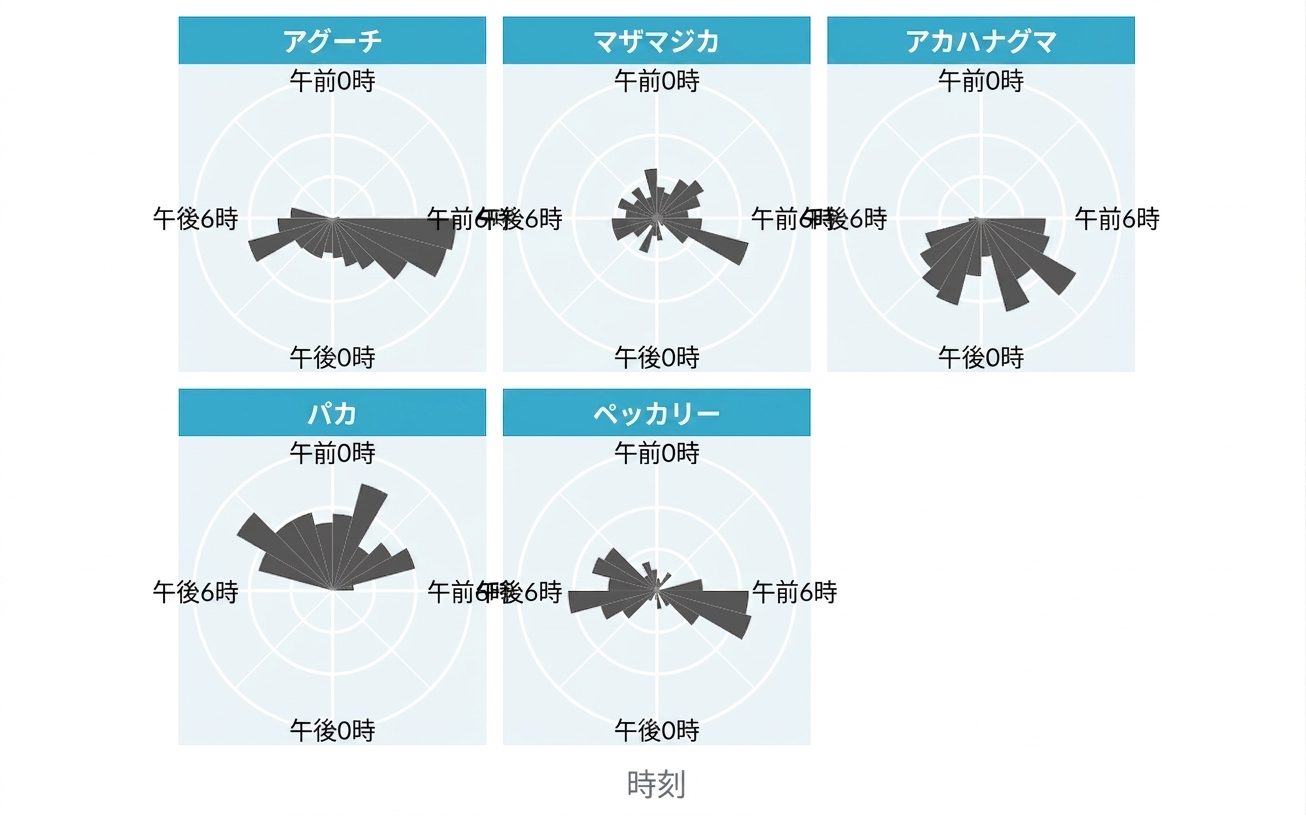
ヒストグラム + 極座標 = ローズチャート

Rose plot of animal activity from the Panama camera trap dataset

データ可視化への理解

練習しましょう!

データ可視化への理解

Preparing Video For Download...