ヒストグラム

データ可視化への理解

Richie Cotton

Data Evangelist at DataCamp

ヒストグラムはいつ使うべきか?

  1. 単一の連続変数
  2. 分布の形に関する問い
データ可視化への理解

イングランドとブリテンの王・女王

正式名 家名 生年月日 即位日 即位時年齢
チャールズ3世 ウィンザー 1948-11-14 2022-09-08 73.86575
エリザベス2世 ウィンザー 1926-04-21 1952-02-06 25.79603
ジョージ6世 ウィンザー 1895-12-14 1936-12-11 40.99110
エドワード8世 ウィンザー 1894-06-23 1936-01-20 41.57426
... ... ... ... ...
エアドレッド ウェセックス 0923-07-01 0946-05-26 22.90212
エドマンド1世 ウェセックス 0921-07-01 0939-10-27 18.32170
アゼルスタン ウェセックス 0894-07-01 0924-07-01 29.99863
データ可視化への理解

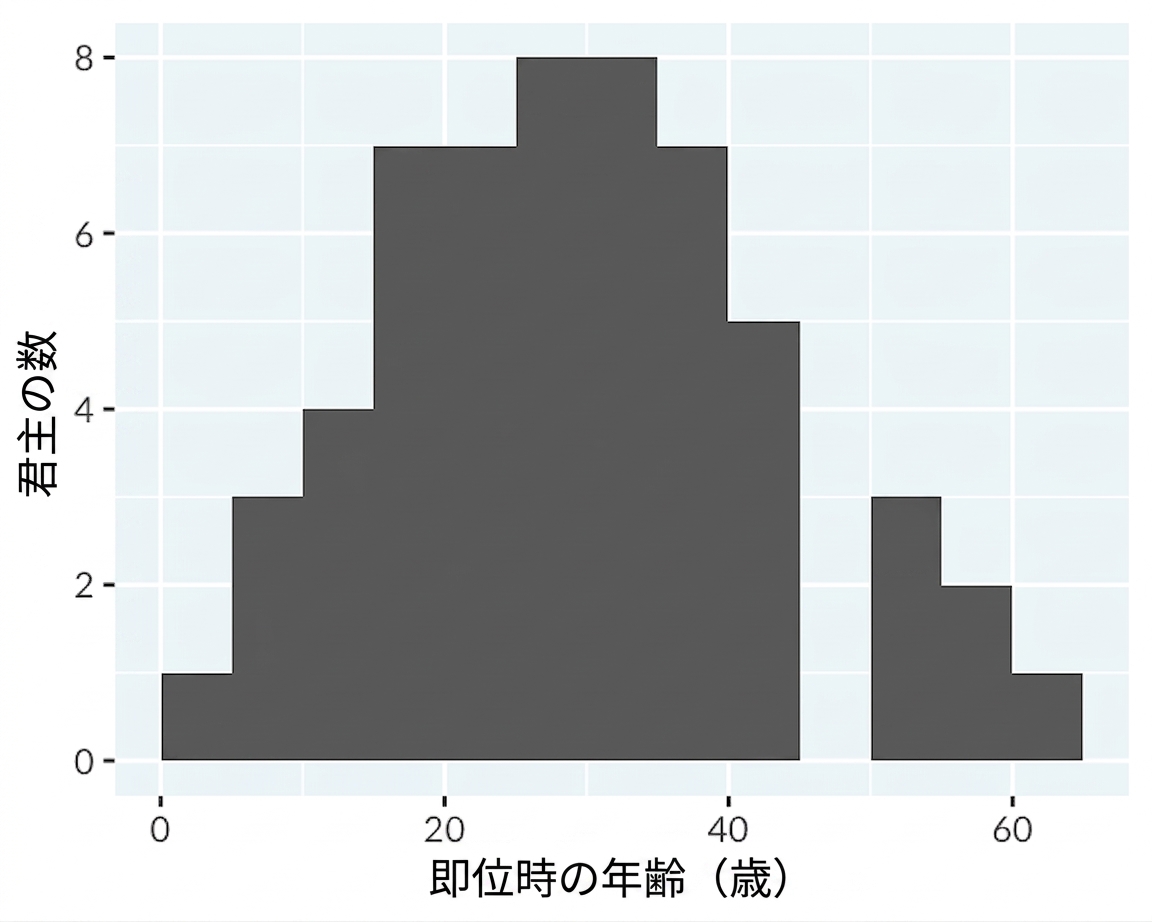
即位時年齢のヒストグラム

Histogram of the age of ascension of English and British monarchs.

データ可視化への理解

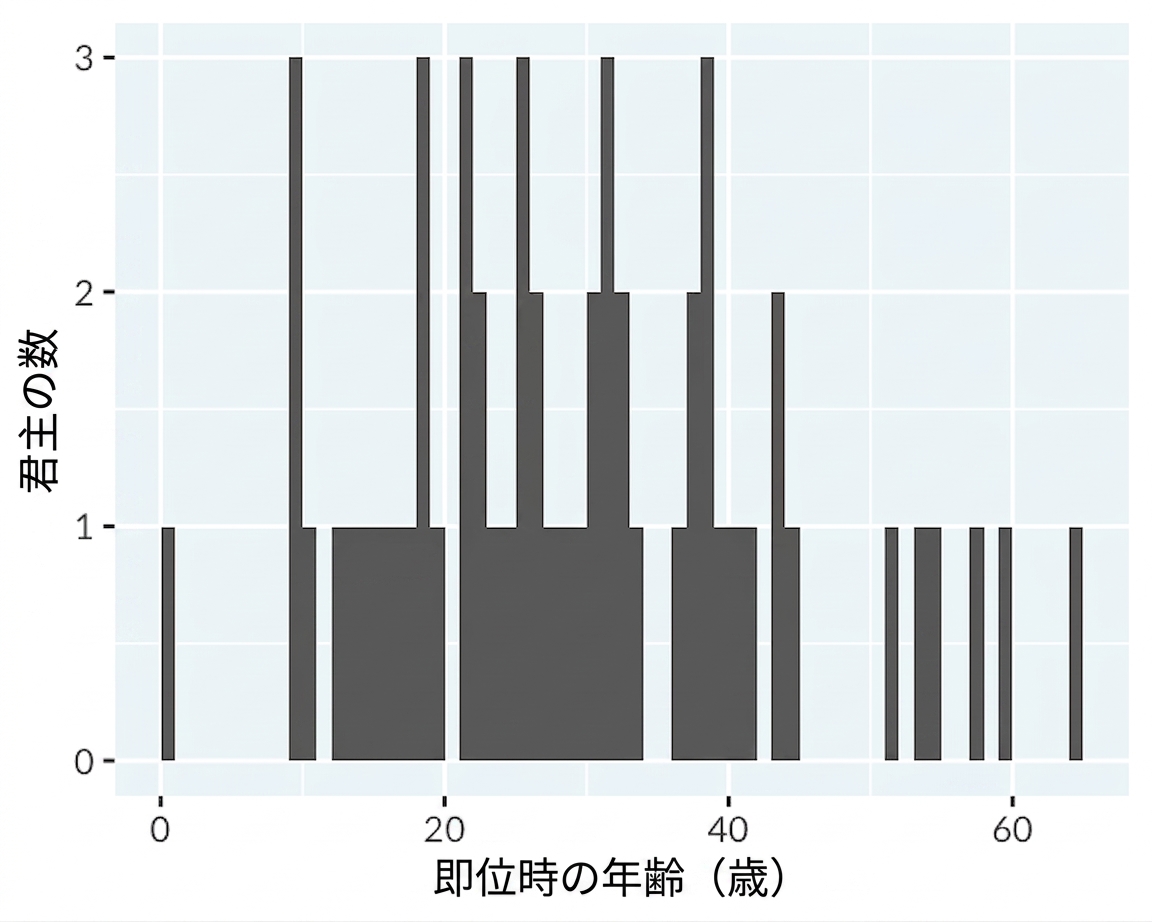
ビン幅: 1年

Histogram of the age of ascension of English and British monarchs, with a binwidth of 1 year.

データ可視化への理解

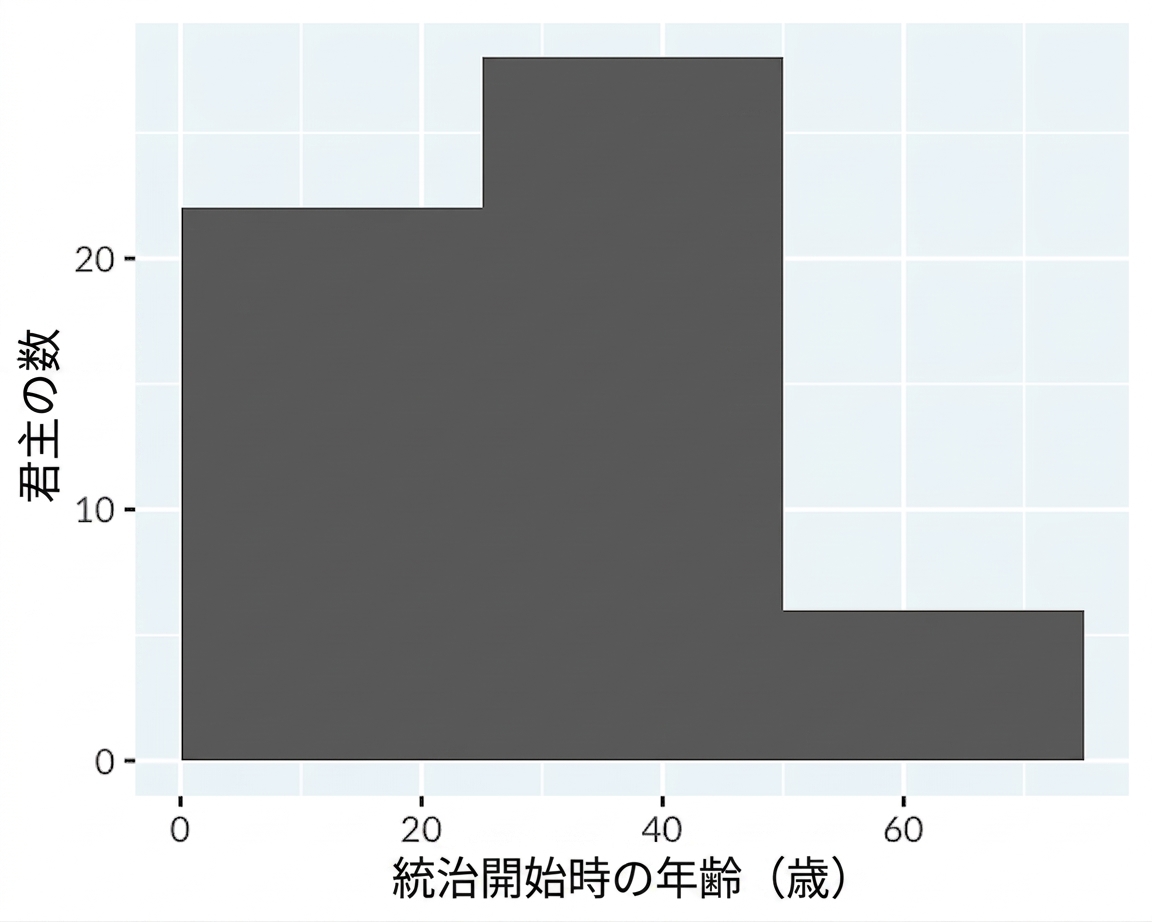
ビン幅: 25年

Histogram of the age of ascension of English and British monarchs, with a binwidth of 25 years.

データ可視化への理解

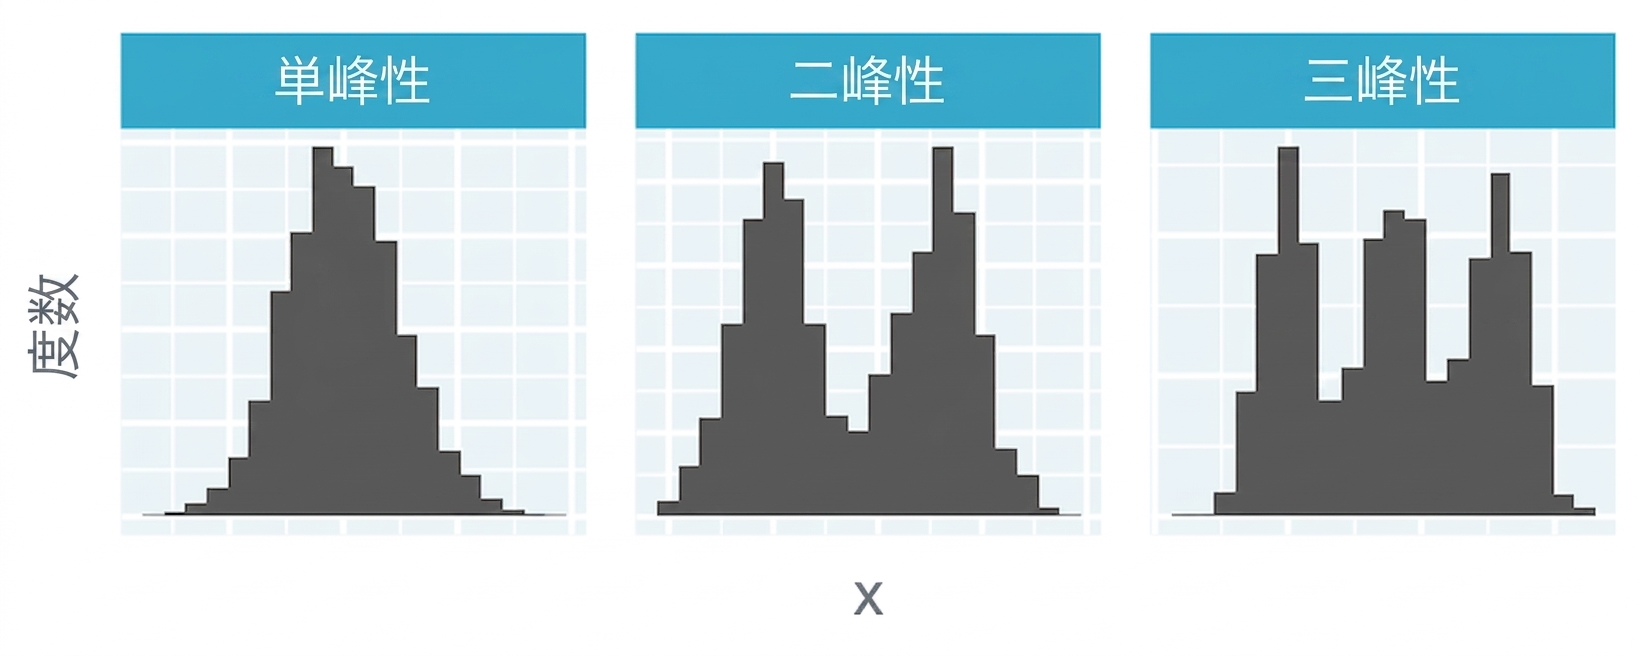
モダリティ: 山はいくつ?

Histograms displaying unimodal, bimodal, and trimodal distributions, with one, two, and three peaks respectively.

データ可視化への理解

モダリティ: 山はいくつ?

Histogram of the age of ascension of English and British monarchs.

Histograms displaying unimodal, bimodal, and trimodal distributions, with one, two, and three peaks respectively.

データ可視化への理解

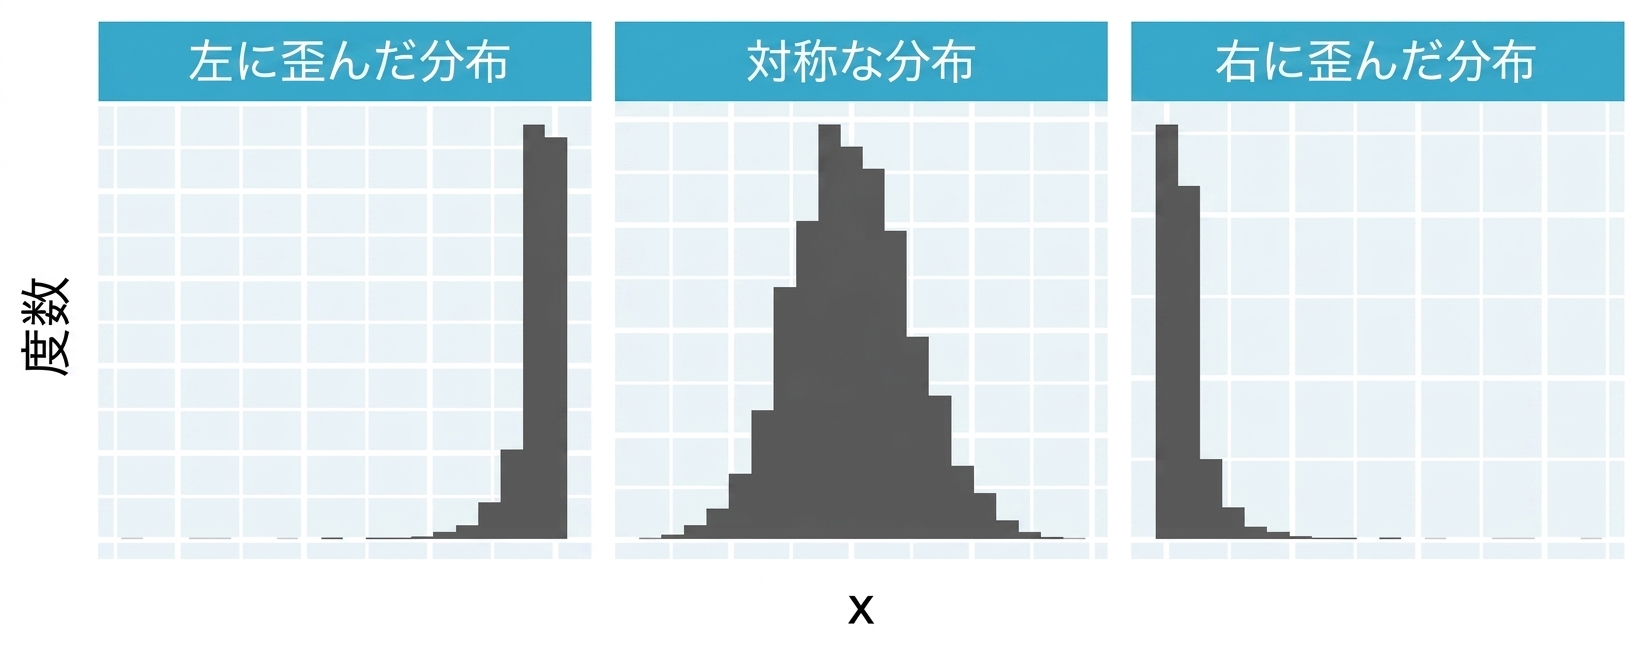
歪度: 左右対称?

Histograms displaying left-skewed, symmetric, and right-skewed distributions.

データ可視化への理解

歪度: 左右対称?

Histogram of the age of ascension of English and British monarchs.

Histograms displaying left-skewed, symmetric, and right-skewed distributions.

データ可視化への理解

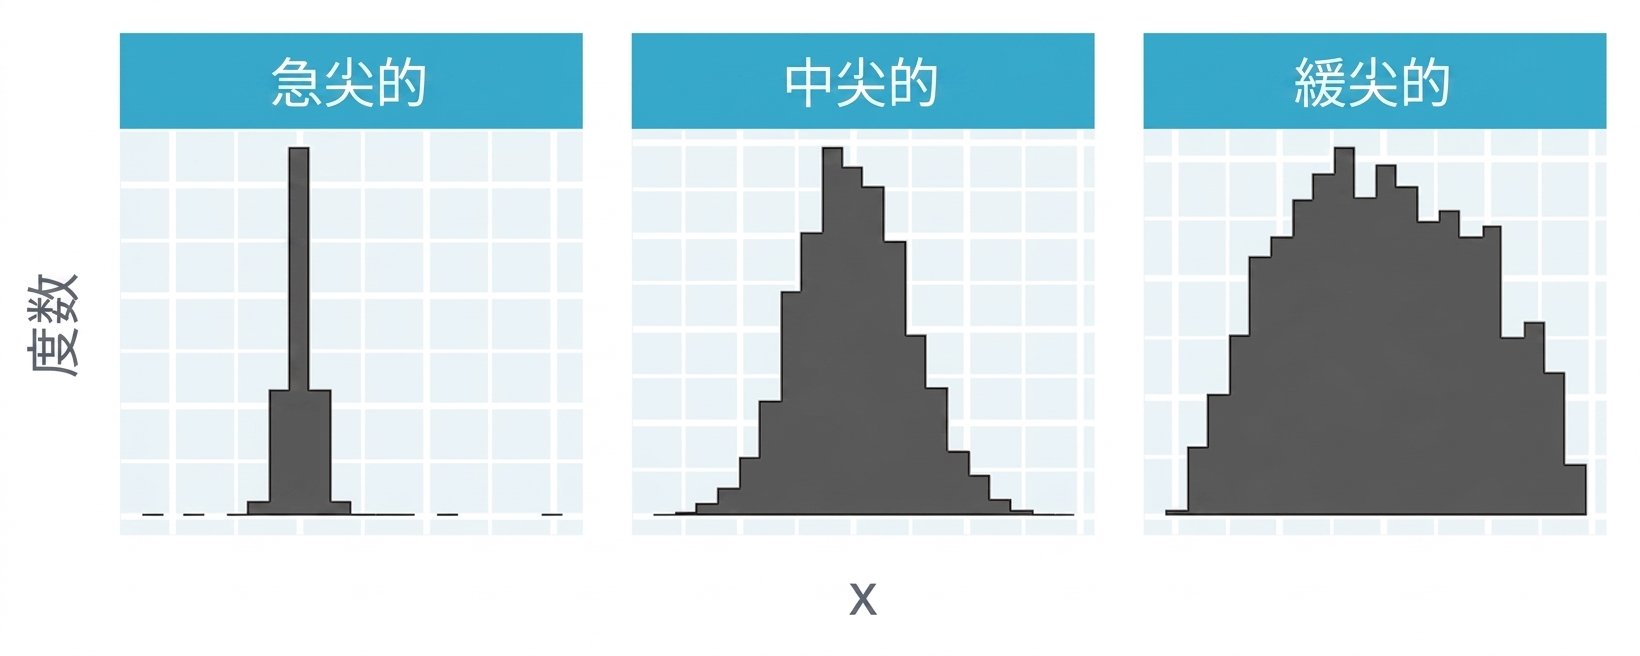
尖度: 極端値はどれくらい?

Histograms displaying leptokurtic, mesokurtic, and platykurtic distributions.

データ可視化への理解

尖度: 極端値はどれくらい?

Histogram of the age of ascension of English and British monarchs.

Histograms displaying leptokurtic, mesokurtic, and platykurtic distributions.

データ可視化への理解

練習しましょう!

データ可視化への理解

Preparing Video For Download...