対数スケール
Tidyverse入門

David Robinson
Chief Data Scientist, DataCamp
散布図
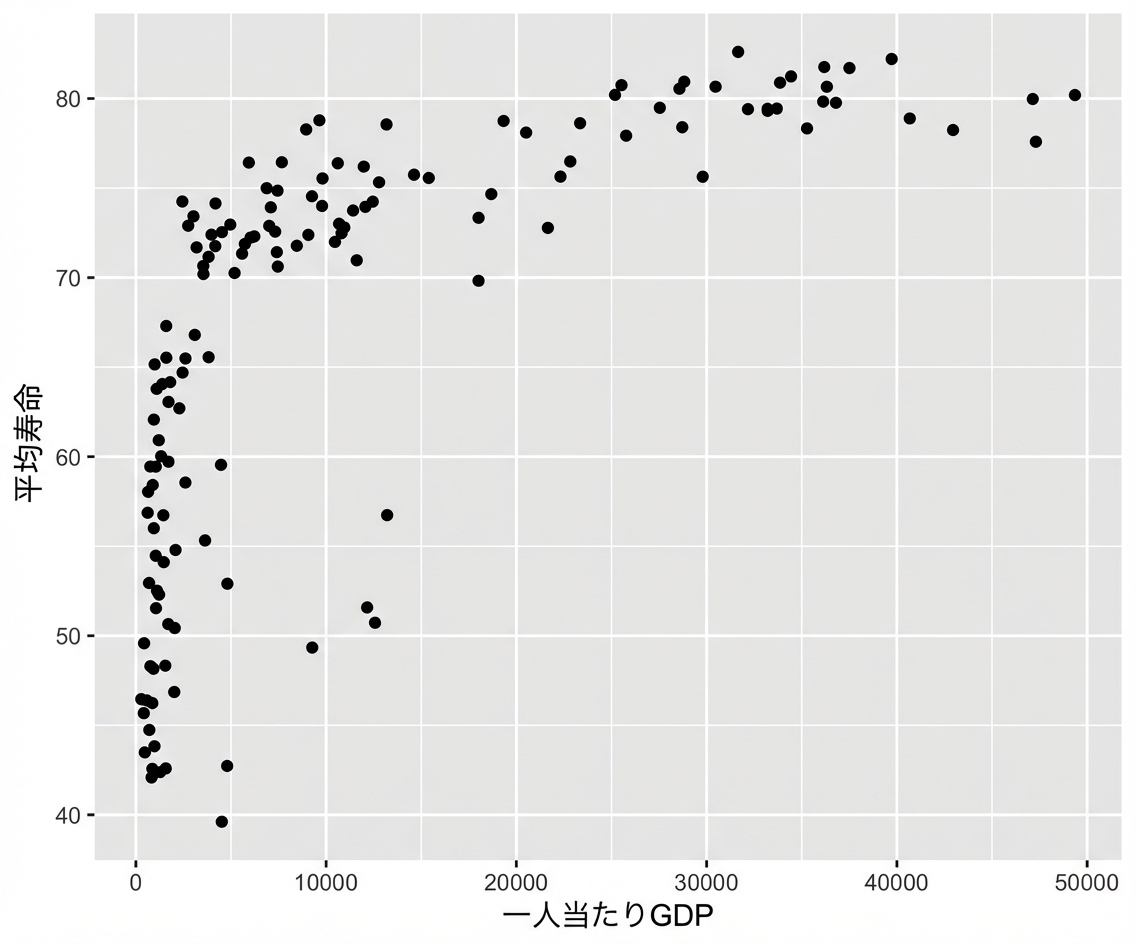
library(ggplot2)

ggplot(gapminder, aes(x = gdpPerCap, y = lifeExp)) +
  geom_point()
対数スケール
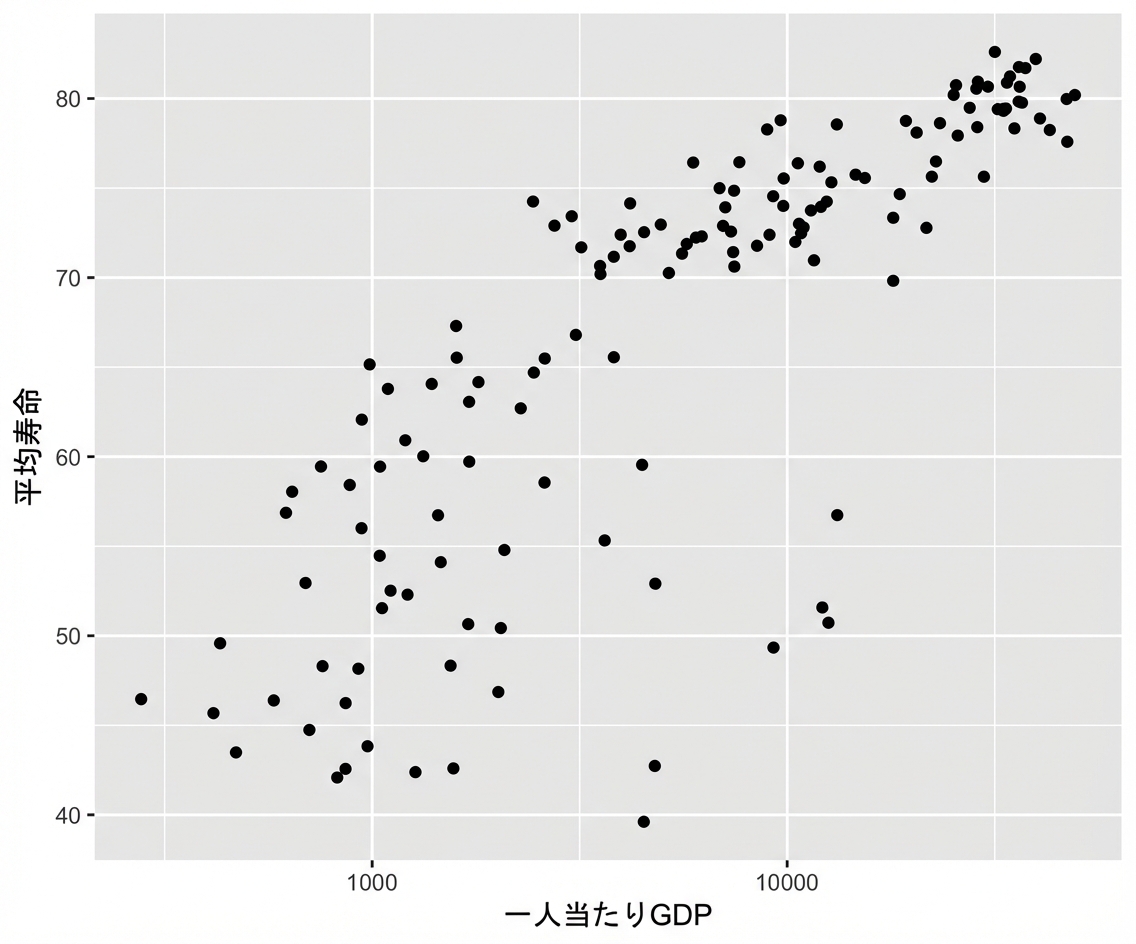
ggplot(gapminder_2007, aes(x = gdpPercap, y = lifeExp)) +
  geom_point() +
  scale_x_log10()

