相関

Pythonによる探索的データ分析

Izzy Weber

Curriculum Manager, DataCamp

相関

  • 2つの変数間の関係の方向と強さを表す
  • numeric_only=Trueを設定して、非数値列によるエラーを防ぐ
divorce.corr(numeric_only=True)

                    income_man  income_woman  marriage_duration  num_kids  marriage_year 
 income_man         1.000       0.318         0.085              0.041     0.019         
 income_woman       0.318       1.000         0.079              -0.018    0.026         
 marriage_duration  0.085       0.079         1.000              0.447     -0.812        
 num_kids           0.041       -0.018        0.447              1.000     -0.461        
 marriage_year      0.019       0.026         -0.812             -0.461    1.000

ピアソンの相関係数を計算

Pythonによる探索的データ分析

相関ヒートマップ

sns.heatmap(divorce.corr(numeric_only=True), annot=True)
plt.show()
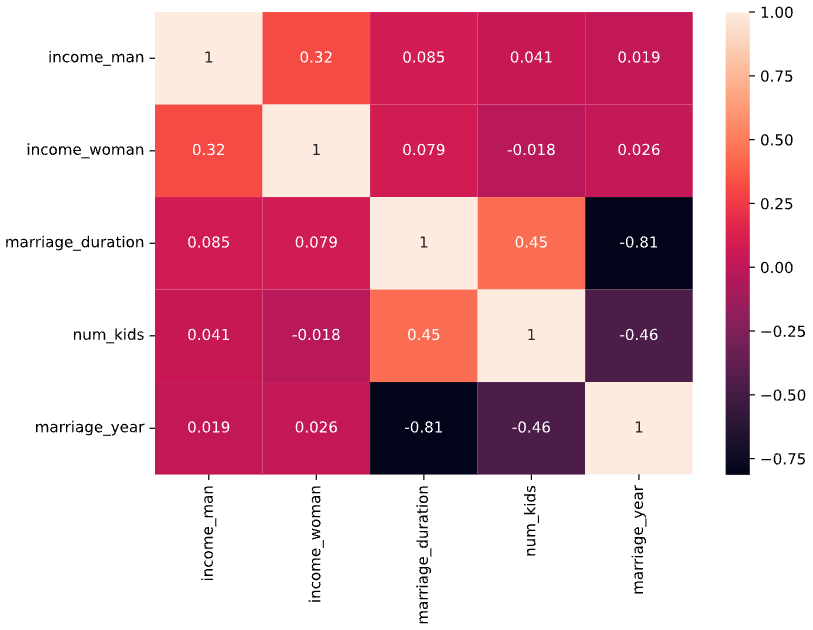
A heatmap of divorce correlations

Pythonによる探索的データ分析

文脈を踏まえた相関

divorce["divorce_date"].min()
Timestamp('2000-01-08 00:00:00')
divorce["divorce_date"].max()
Timestamp('2015-11-03 00:00:00')
Pythonによる探索的データ分析

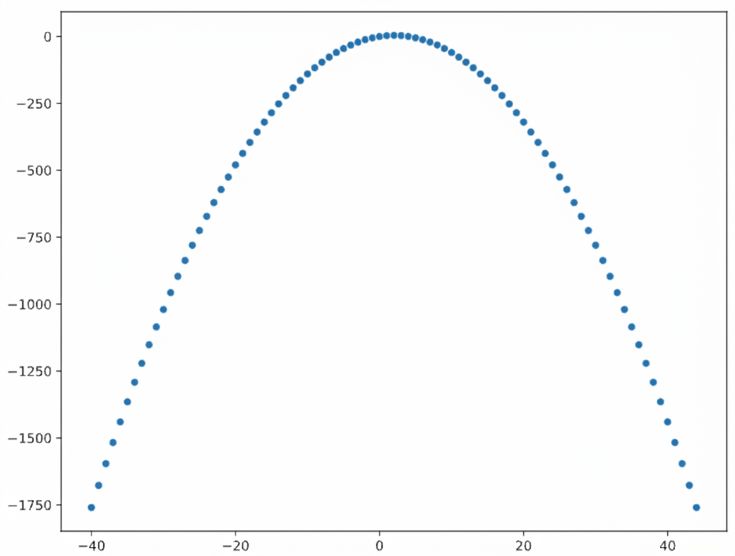
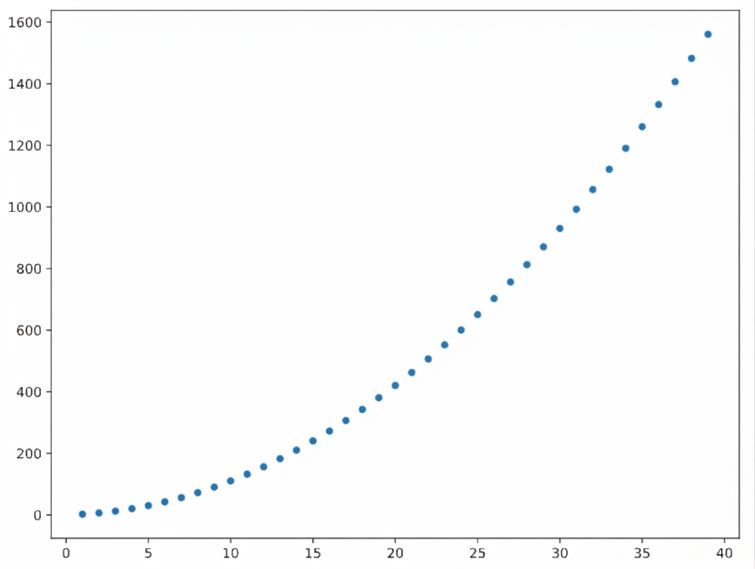
関連性を可視化する

A strong relationship with a low linear correlation coefficient

  • 強い関係があるが、線形ではない
  • ピアソンの相関係数: -6.48e-18

A quadratic relationship with a high linear correlation coefficient

  • 二次関数的な関係であり、線形ではない
  • ピアソン相関係数: .971211
Pythonによる探索的データ分析

散布図

sns.scatterplot(data=divorce, x="income_man", y="income_woman")
plt.show()

a scatterplot of mens and womens income at time of divorce

Pythonによる探索的データ分析

pairplot

sns.pairplot(data=divorce)
plt.show()
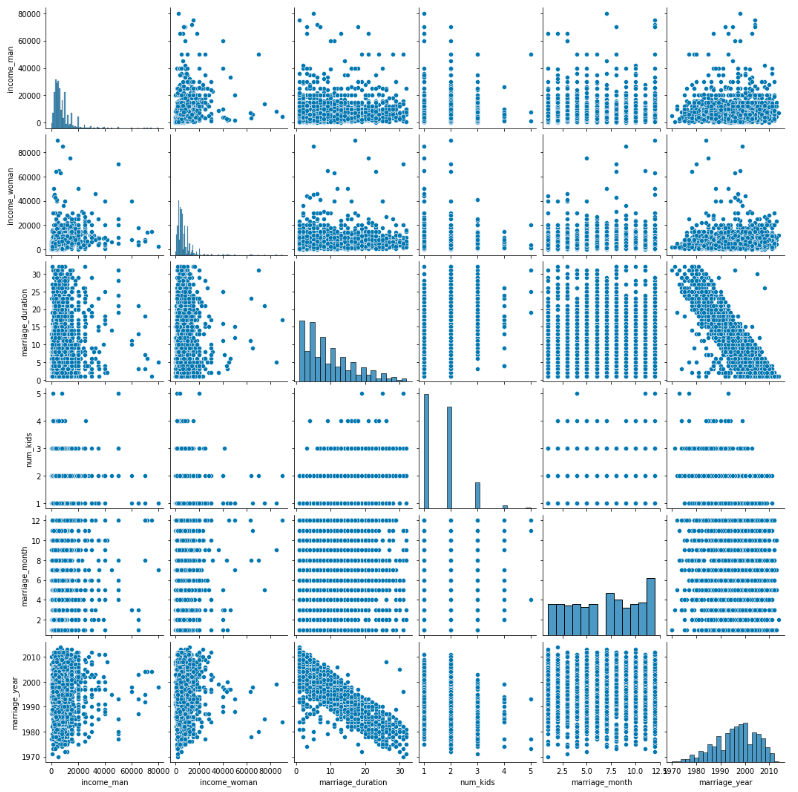
A pairplot of all numeric columns in the divorce dataframe

Pythonによる探索的データ分析

pairplot

sns.pairplot(data=divorce, vars=["income_man", "income_woman", "marriage_duration"])
plt.show()
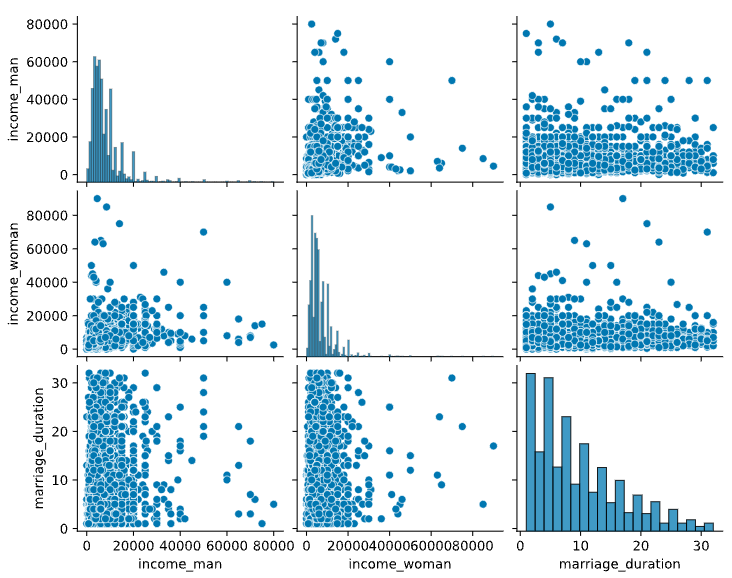
a pairplot of partner incomes and marriage duration

Pythonによる探索的データ分析

お疲れさまでした!

Pythonによる探索的データ分析

Preparing Video For Download...