Pythonで学ぶ探索的データ分析
George Boorman
Curriculum Manager, DataCamp

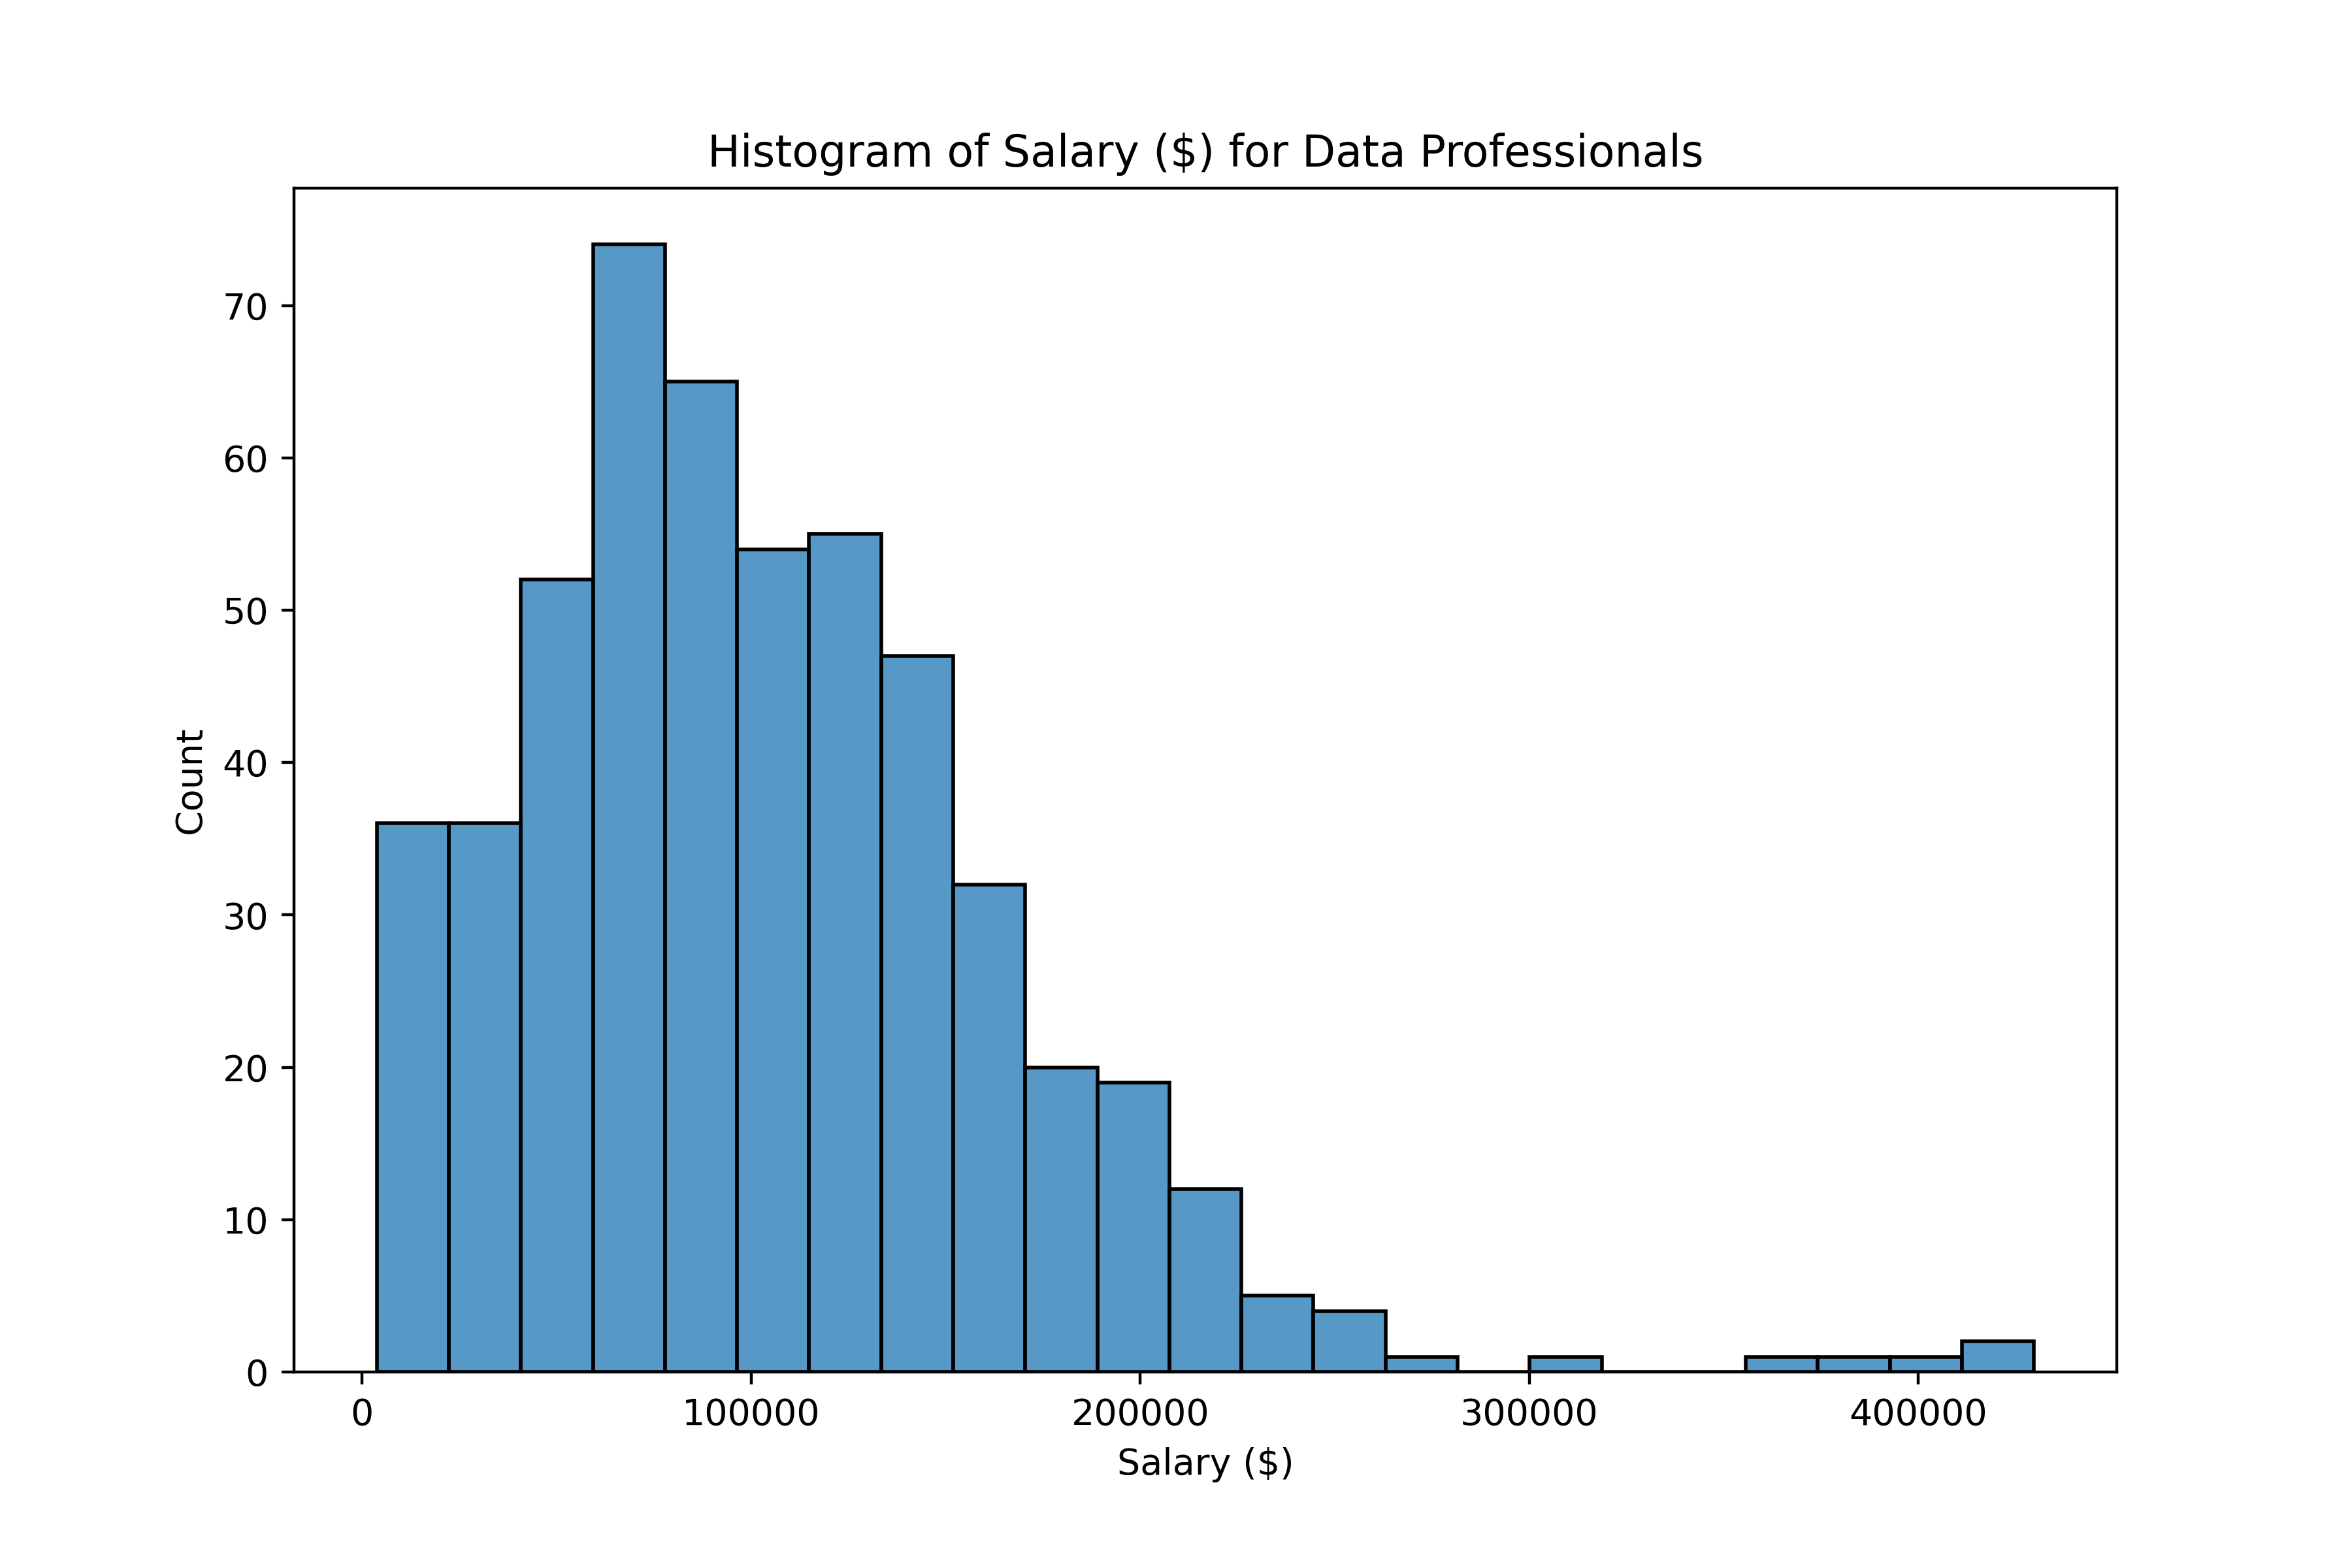
print(salaries["Salary_USD"].describe())
count 518.000
mean 104905.826
std 62660.107
min 3819.000
25% 61191.000
50% 95483.000
75% 137496.000
max 429675.000
Name: Salary_USD, dtype: float64
sns.boxplot(data=salaries,
y="Salary_USD")
plt.show()
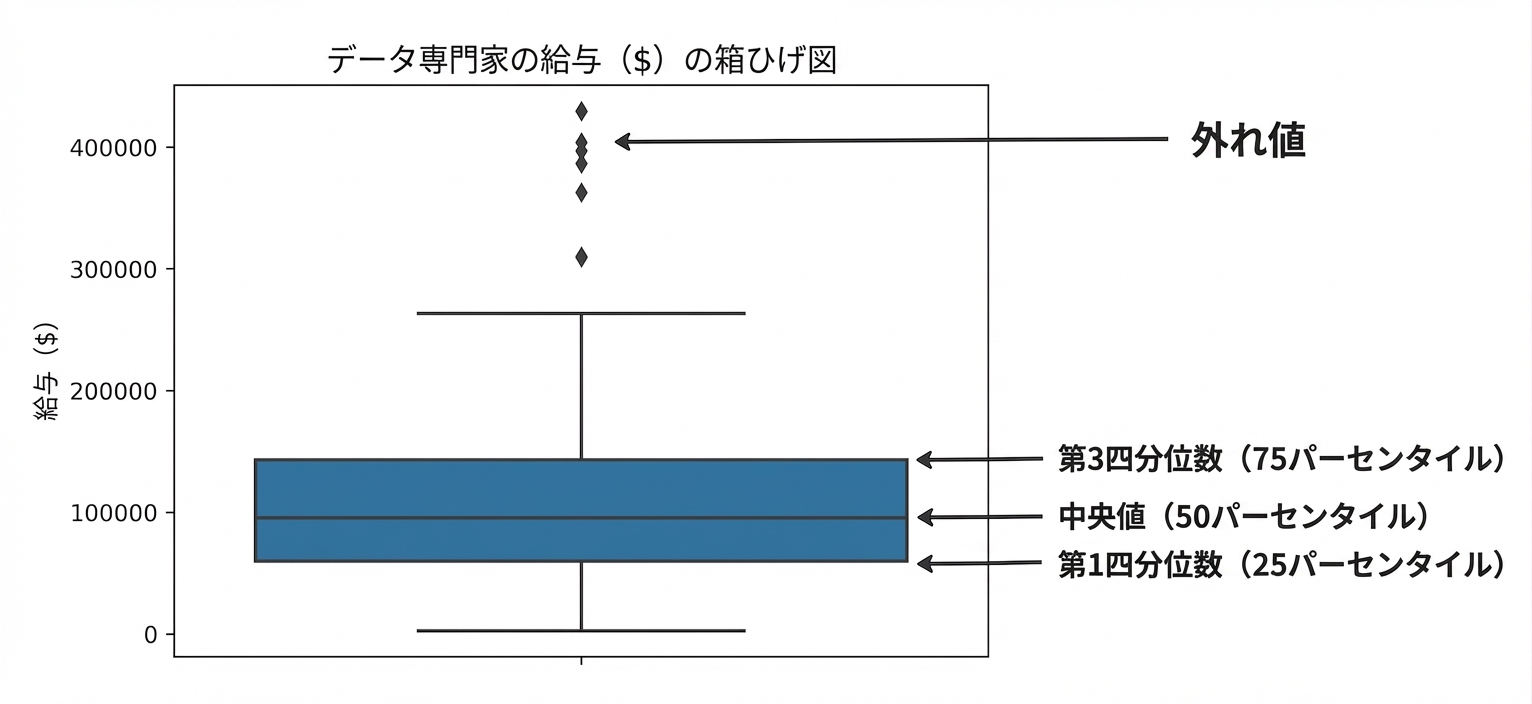
# 75th percentile seventy_fifth = salaries["Salary_USD"].quantile(0.75)# 25th percentile twenty_fifth = salaries["Salary_USD"].quantile(0.25)# Interquartile range salaries_iqr = seventy_fifth - twenty_fifthprint(salaries_iqr)
76305.0
# Upper threshold upper = seventy_fifth + (1.5 * salaries_iqr)# Lower threshold lower = twenty_fifth - (1.5 * salaries_iqr)print(upper, lower)
251953.5 -53266.5
salaries[(salaries["Salary_USD"] < lower) | (salaries["Salary_USD"] > upper)] \[["Experience", "Employee_Location", "Salary_USD"]]
Experience Employee_Location Salary_USD
29 Mid US 429675.0
67 Mid US 257805.0
80 Senior US 263534.0
83 Mid US 429675.0
133 Mid US 403895.0
410 Executive US 309366.0
441 Senior US 362837.0
445 Senior US 386708.0
454 Senior US 254368.0
外れ値は極端な値
平均や標準偏差を変えてしまう
統計的検定や機械学習モデルは正規分布を前提とすることが多い
no_outliers = salaries[(salaries["Salary_USD"] > lower) & (salaries["Salary_USD"] < upper)]
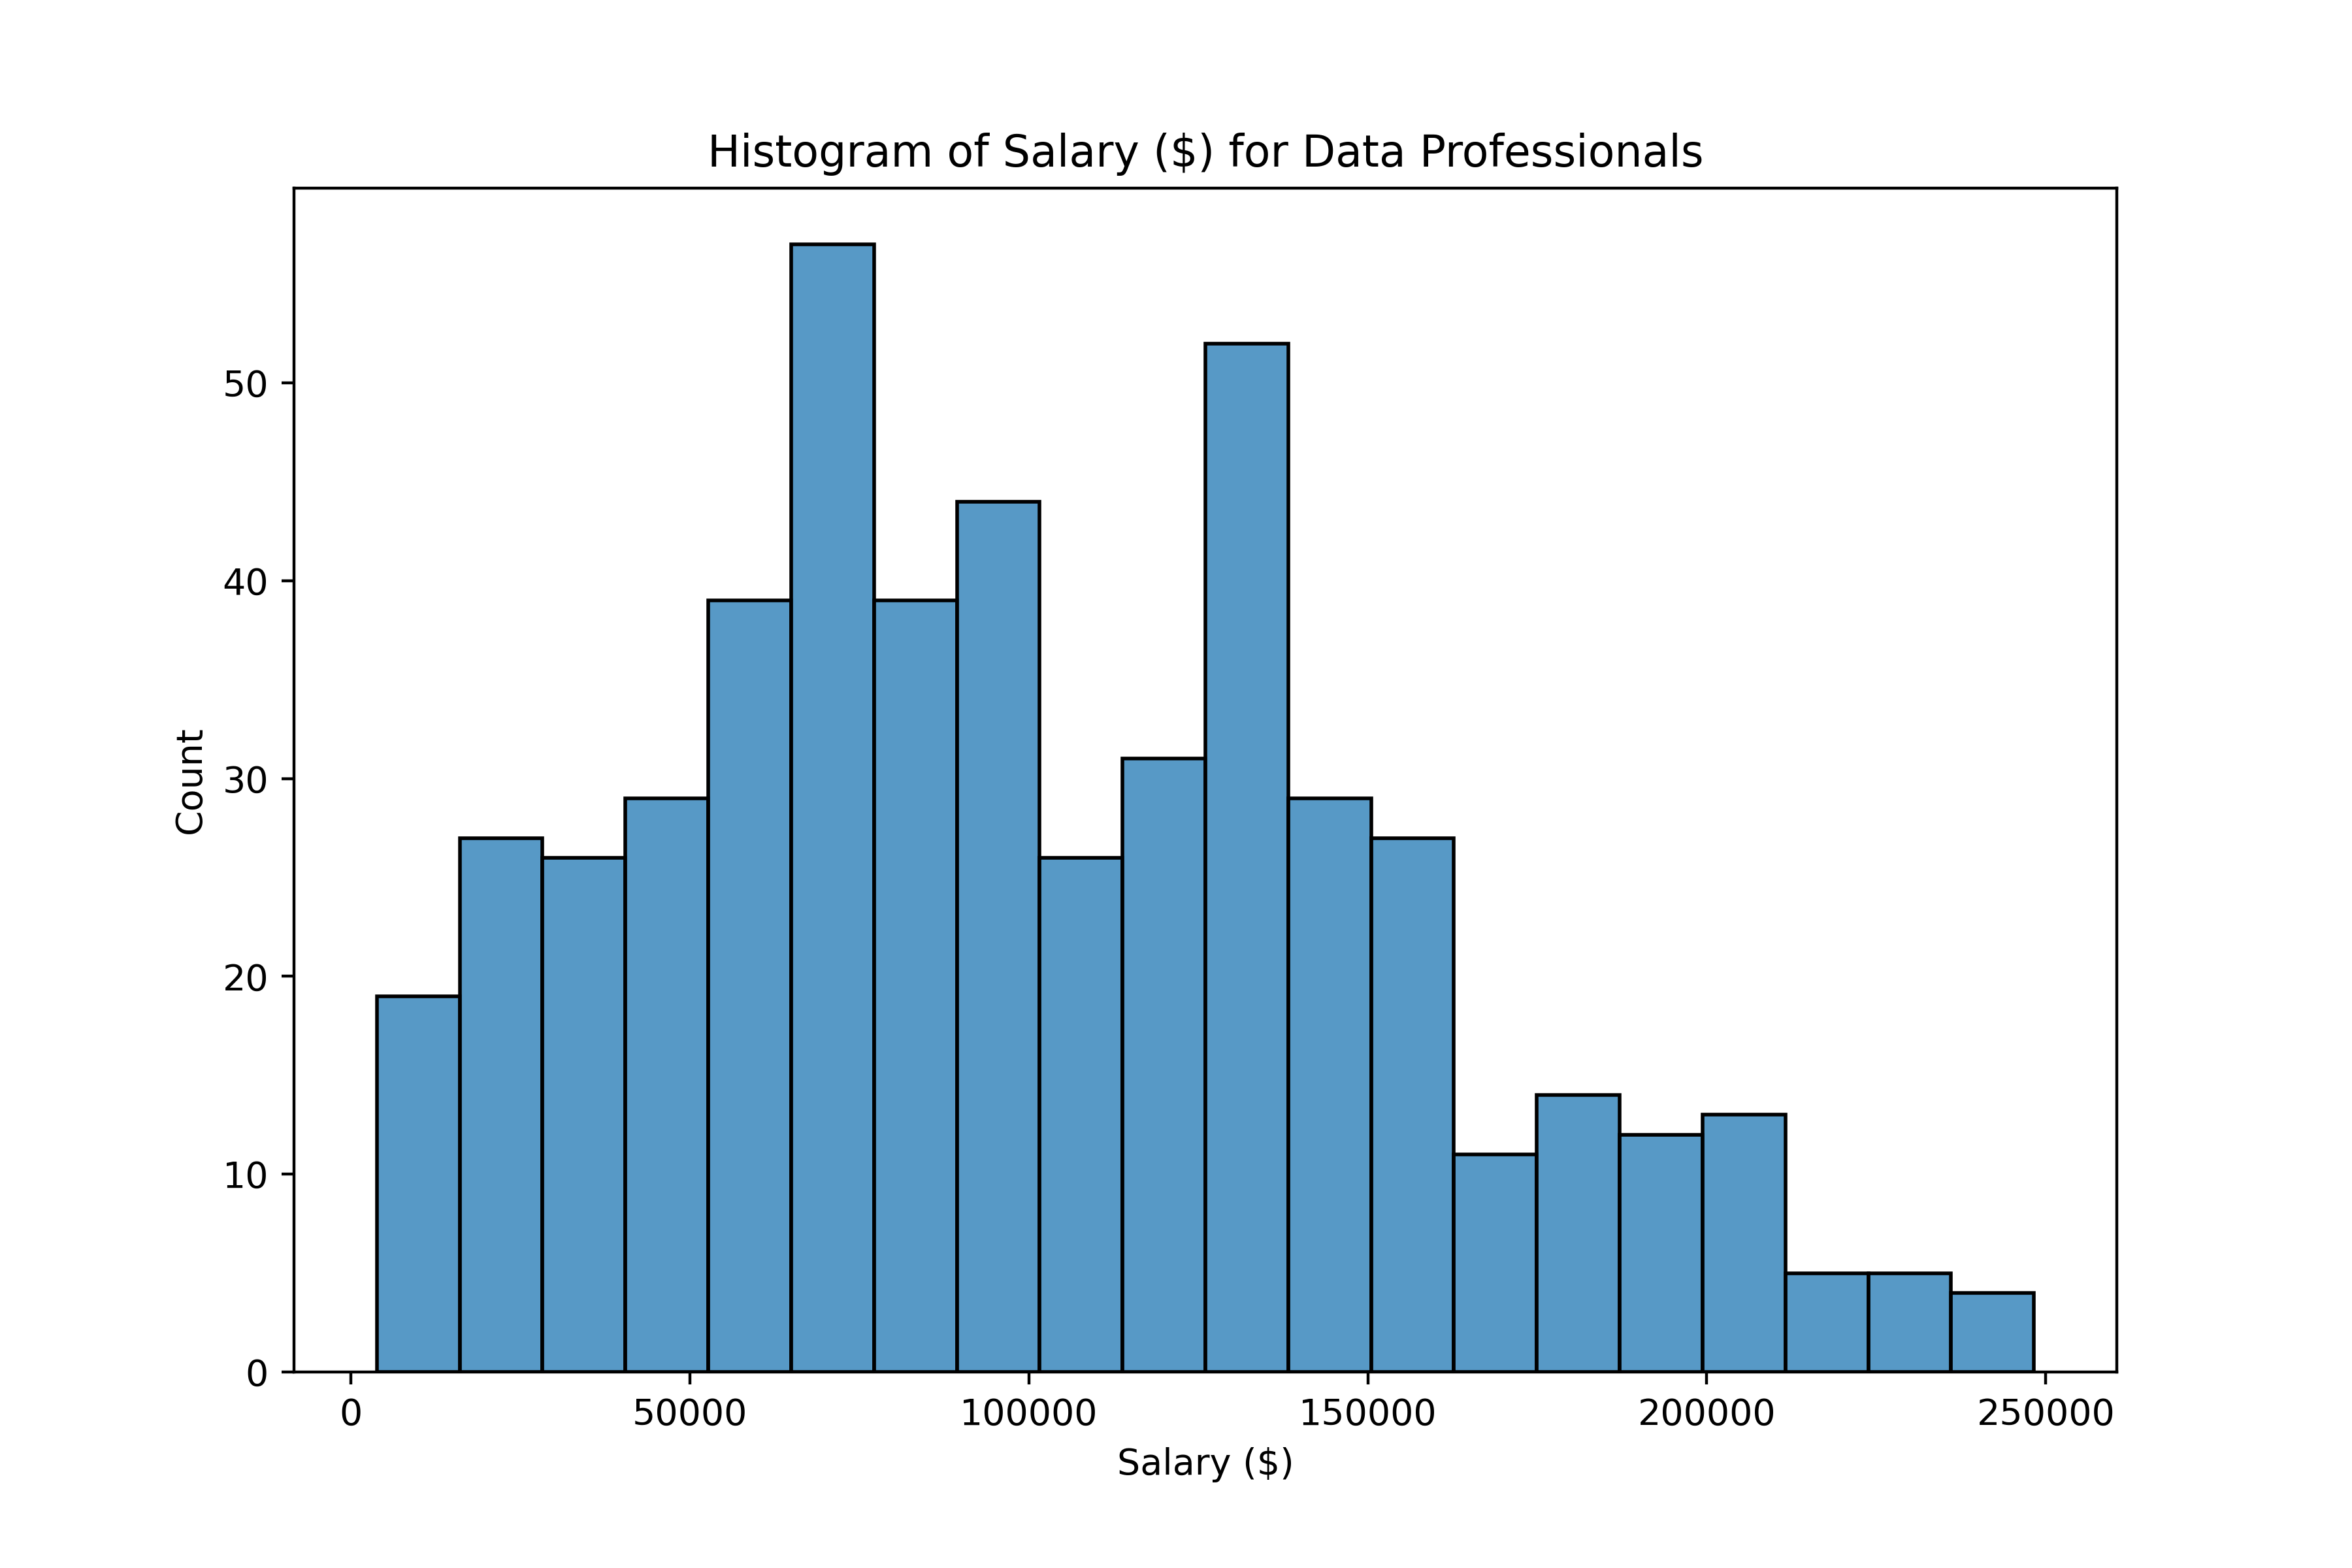
print(no_outliers["Salary_USD"].describe())
count 509.000000
mean 100674.567780
std 53643.050057
min 3819.000000
25% 60928.000000
50% 95483.000000
75% 134059.000000
max 248257.000000
Name: Salary_USD, dtype: float64


Pythonで学ぶ探索的データ分析