要因の関係と分布

Pythonで学ぶ探索的データ分析

Izzy Weber

Curriculum Manager, DataCamp

学歴:男性パートナー

divorce["education_man"].value_counts()
Professional    1313
Preparatory      501
Secondary        288
Primary          100
None               4
Other              3
Name: education_man, dtype: int64
Pythonで学ぶ探索的データ分析

カテゴリ関係の探索

sns.histplot(data=divorce, x="marriage_duration", binwidth=1)
plt.show()
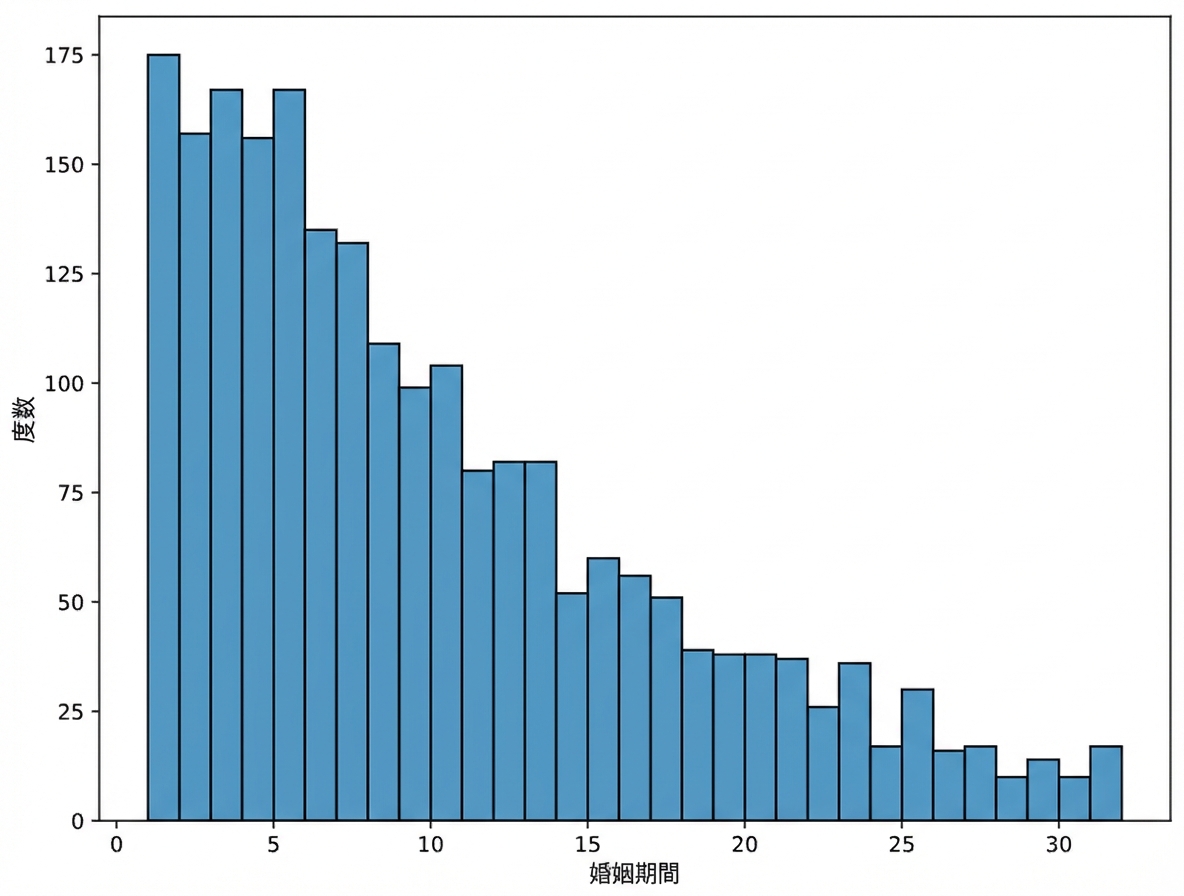
婚姻期間のヒストグラム

Pythonで学ぶ探索的データ分析

カテゴリ関係の探索

sns.histplot(data=divorce, x="marriage_duration", hue="education_man", binwidth=1)
plt.show()
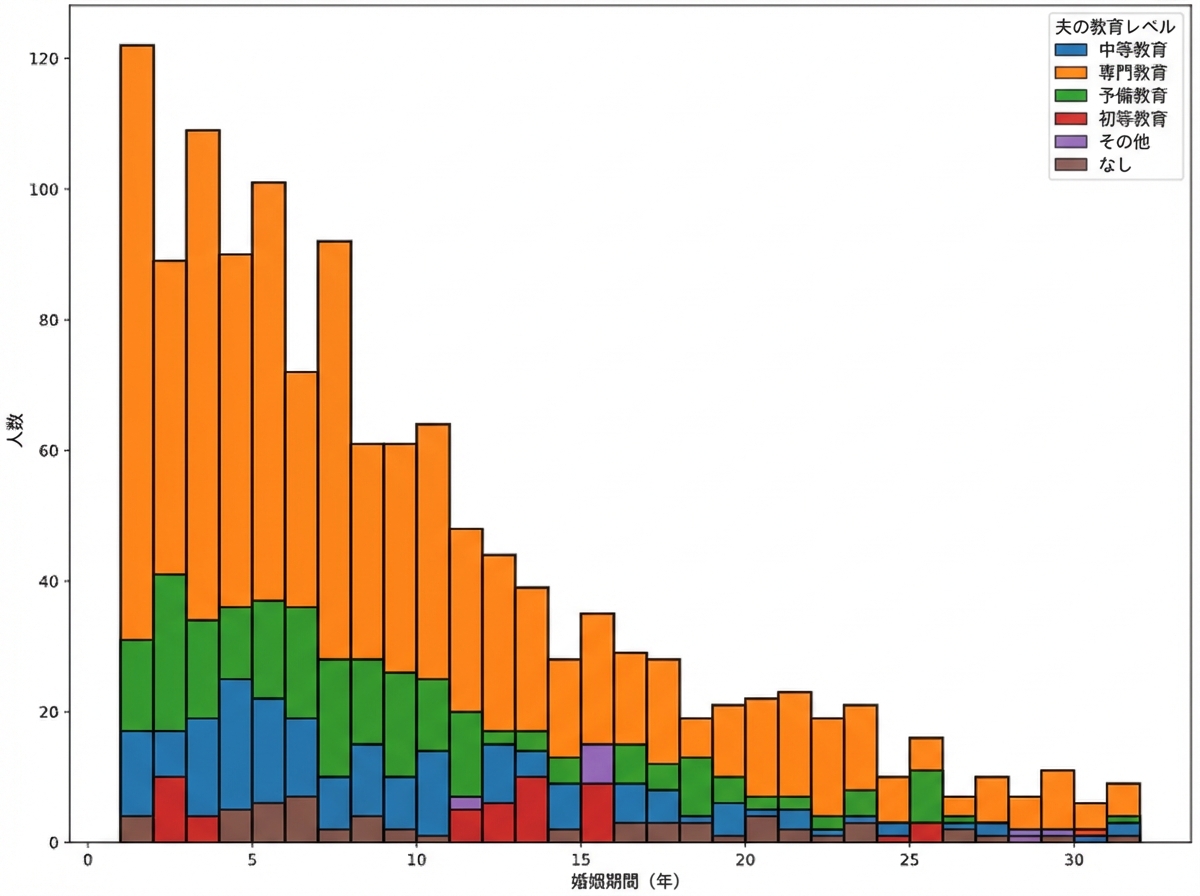
education_man を hue にした婚姻期間のヒストグラム

Pythonで学ぶ探索的データ分析

カーネル密度推定(KDE)プロット

sns.kdeplot(data=divorce, x="marriage_duration", hue="education_man")
plt.show()
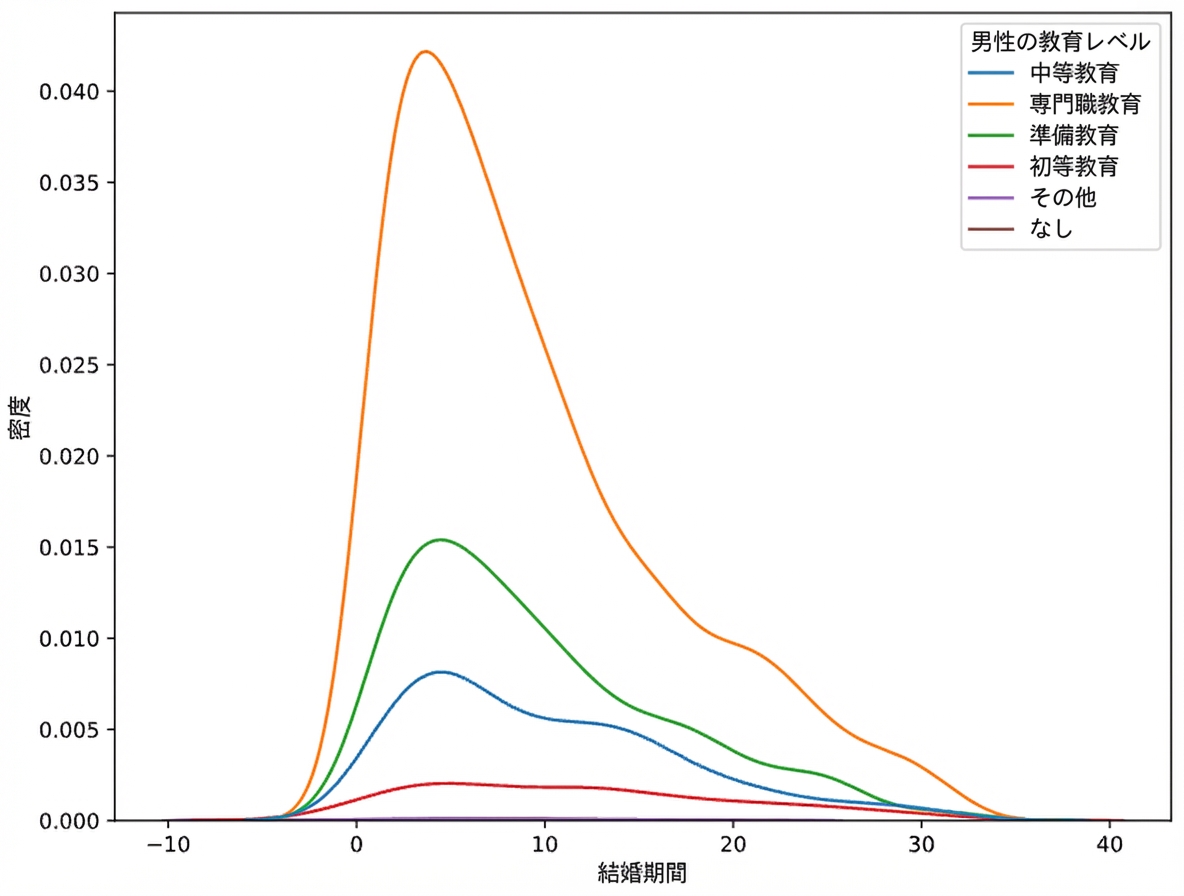
hue を education_man にした婚姻期間のKDE

Pythonで学ぶ探索的データ分析

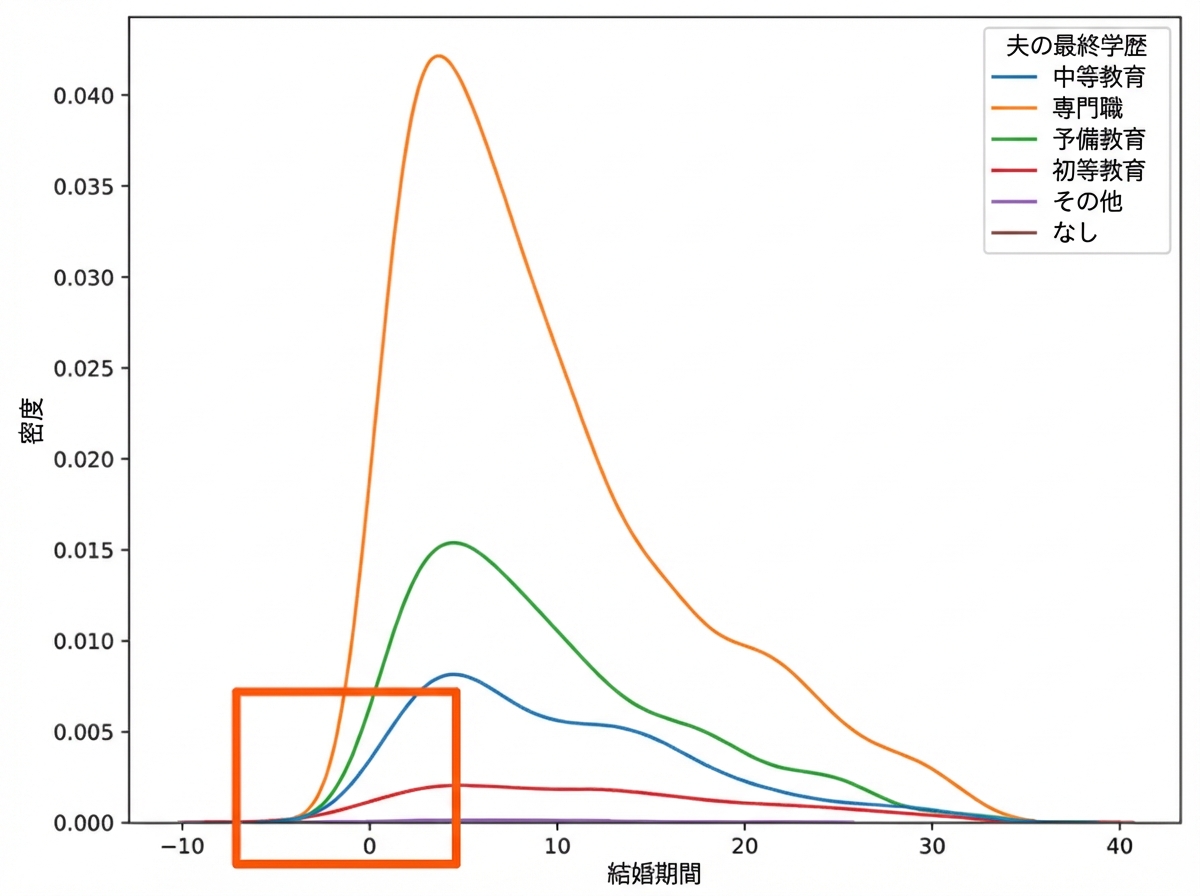
カーネル密度推定(KDE)プロット

hue を education_man にした婚姻期間のKDE(marriage_duration=0 付近を拡大)

Pythonで学ぶ探索的データ分析

カーネル密度推定(KDE)プロット

sns.kdeplot(data=divorce, x="marriage_duration", hue="education_man", cut=0)
plt.show()
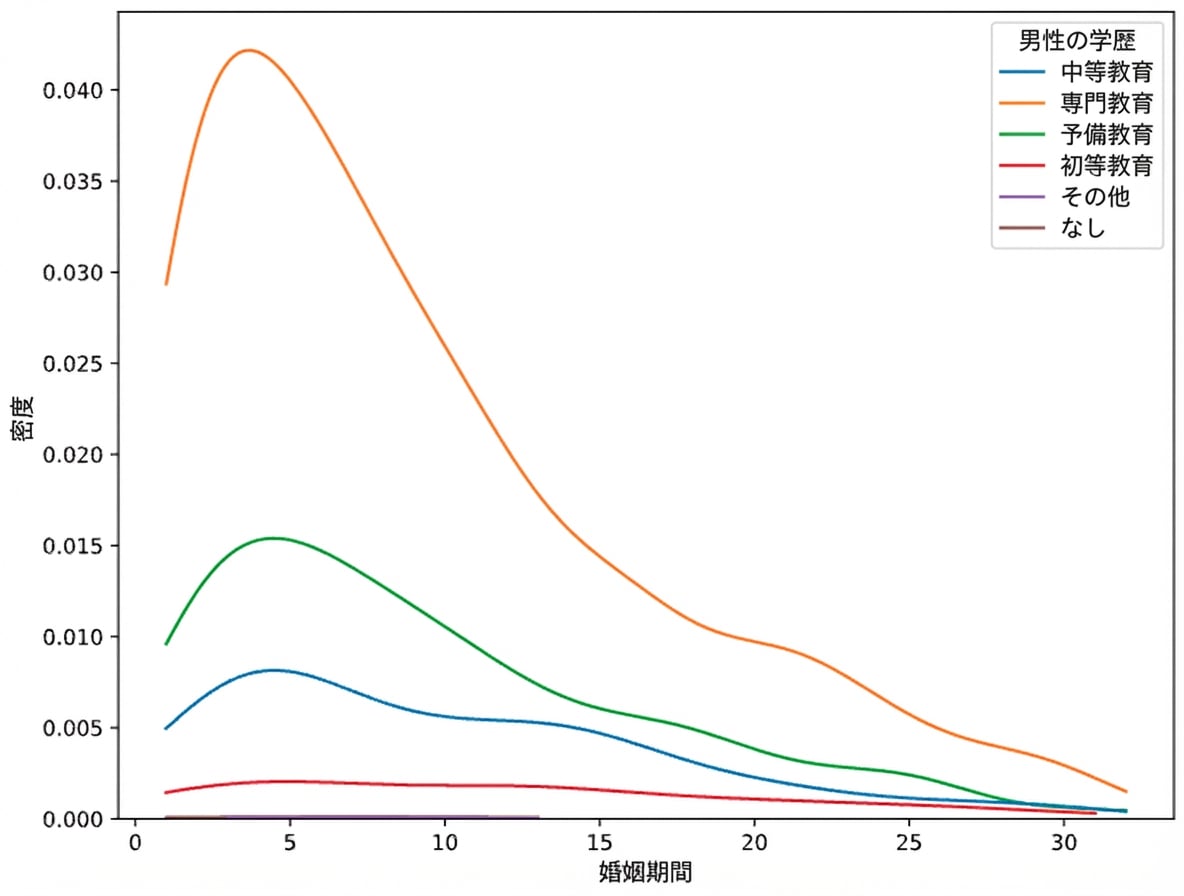
hue を education_man、cut を 0 にした婚姻期間のKDE

Pythonで学ぶ探索的データ分析

累積KDEプロット

sns.kdeplot(data=divorce, x="marriage_duration", hue="education_man", cut=0, cumulative=True)
plt.show()
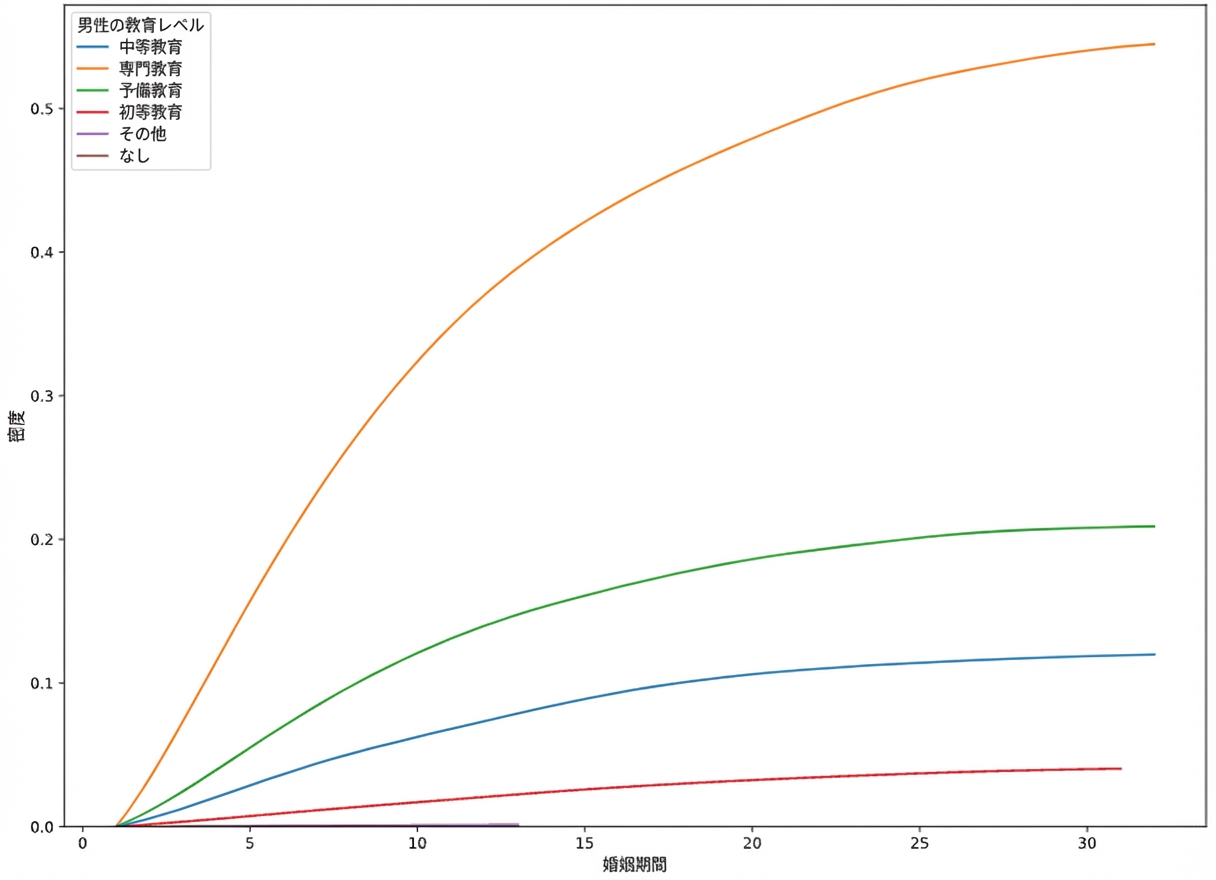
hue を education_man、cut を 0 にした婚姻期間の累積分布関数

Pythonで学ぶ探索的データ分析

結婚時年齢と学歴の関係

  • 結婚時年齢と学歴に関係はあるか?
divorce["man_age_marriage"] = divorce["marriage_year"] - divorce["dob_man"].dt.year
divorce["woman_age_marriage"] = divorce["marriage_year"] - divorce["dob_woman"].dt.year
Pythonで学ぶ探索的データ分析

カテゴリ変数を用いた散布図

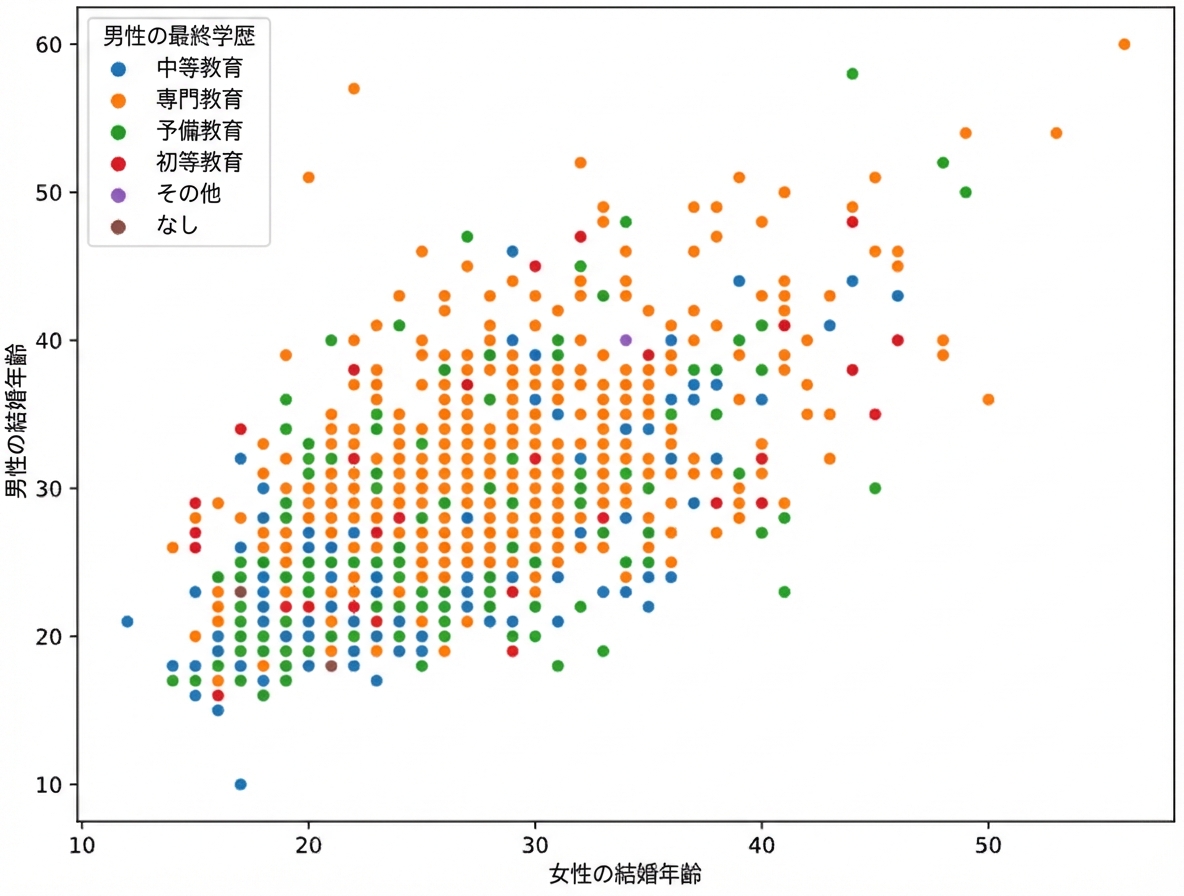
sns.scatterplot(data=divorce, x="woman_age_marriage", y="man_age_marriage")
plt.show()
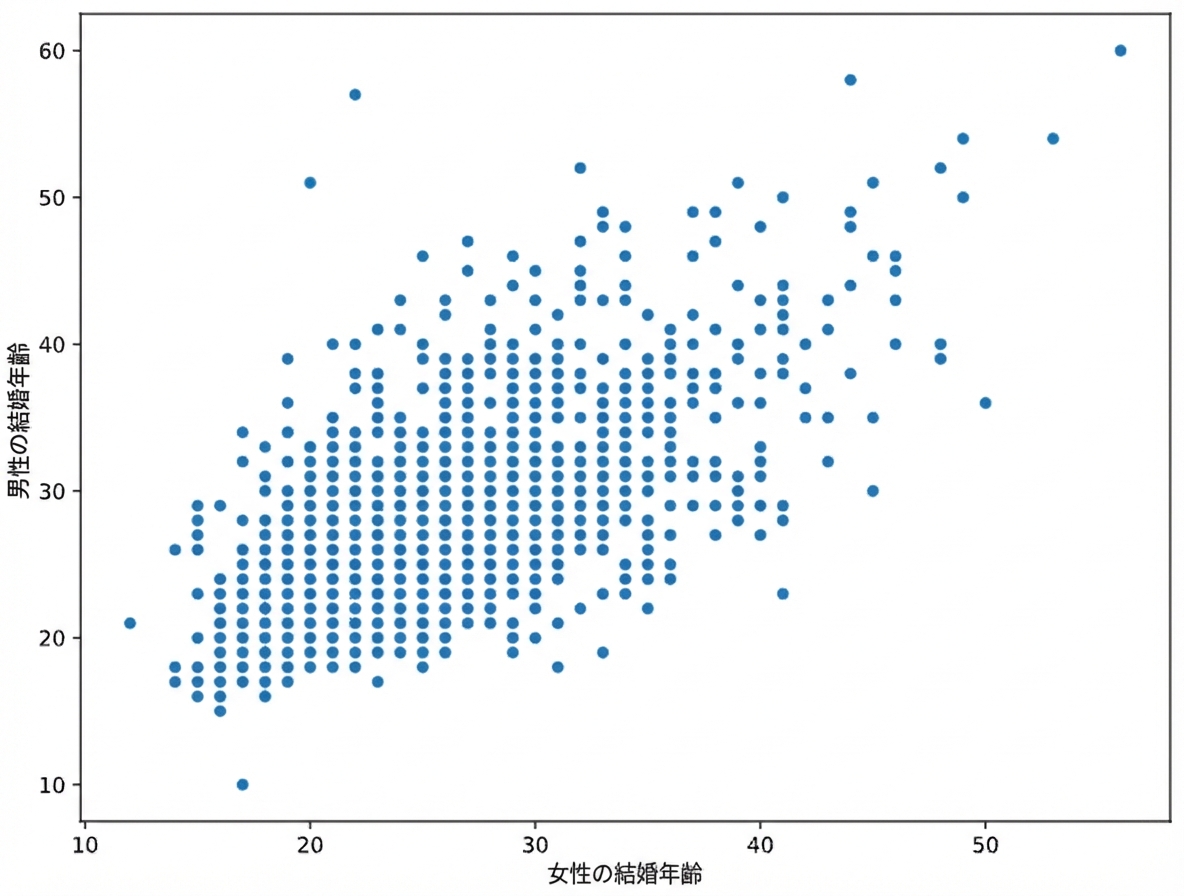
woman_age_marriage と man_age_marriage の散布図

Pythonで学ぶ探索的データ分析

カテゴリ変数を用いた散布図

sns.scatterplot(data=divorce, 
                x="woman_age_marriage",
                y="man_age_marriage", 
                hue="education_man")
plt.show()

hue を education_man にした woman_age_marriage と man_age_marriage の散布図

Pythonで学ぶ探索的データ分析

練習に進みましょう!

Pythonで学ぶ探索的データ分析

Preparing Video For Download...