仮説を立てる

Pythonによる探索的データ分析

George Boorman

Curriculum Manager, DataCamp

何がわかっているでしょうか?
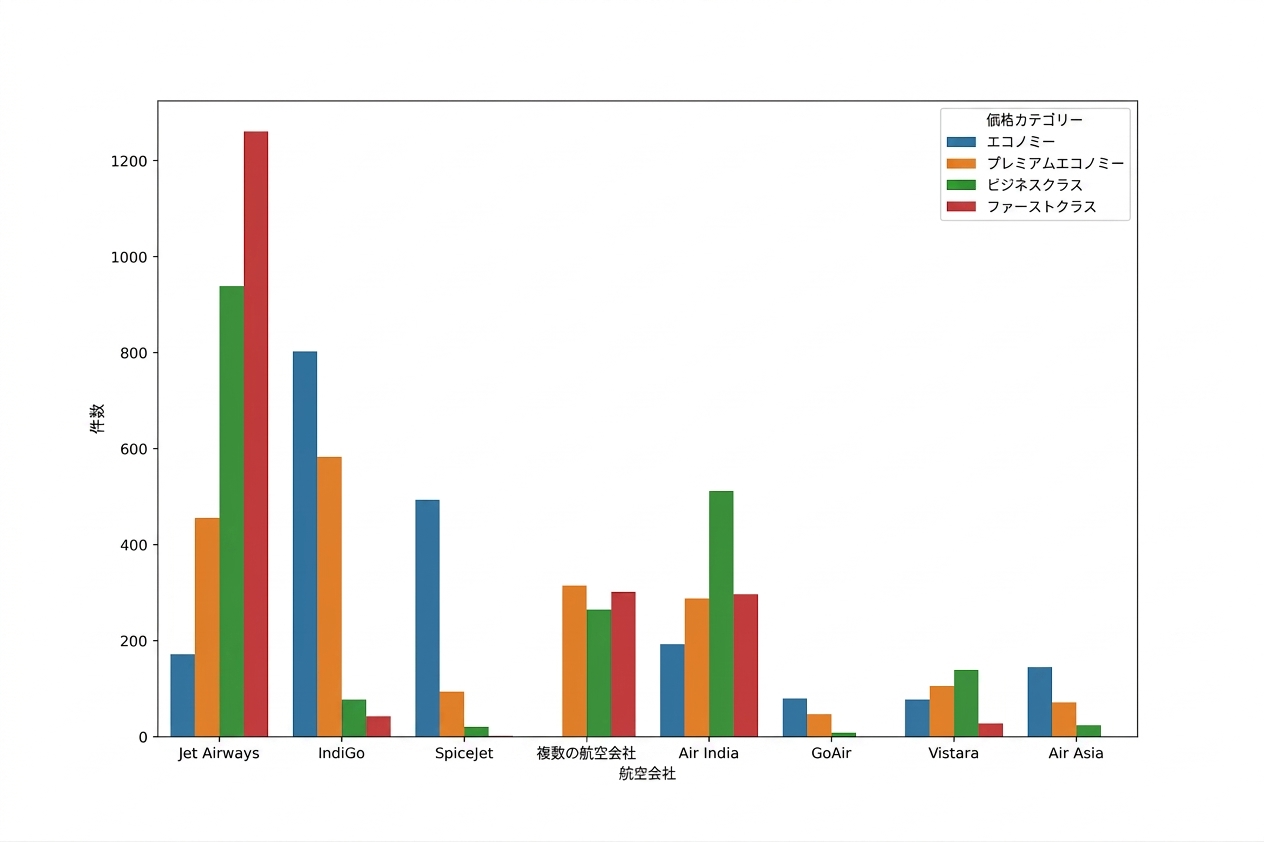
Countplot showing the number of flights per airline in different price categories, with Jet Airways having the largest number of First Class tickets

Pythonによる探索的データ分析

何がわかっているでしょうか?

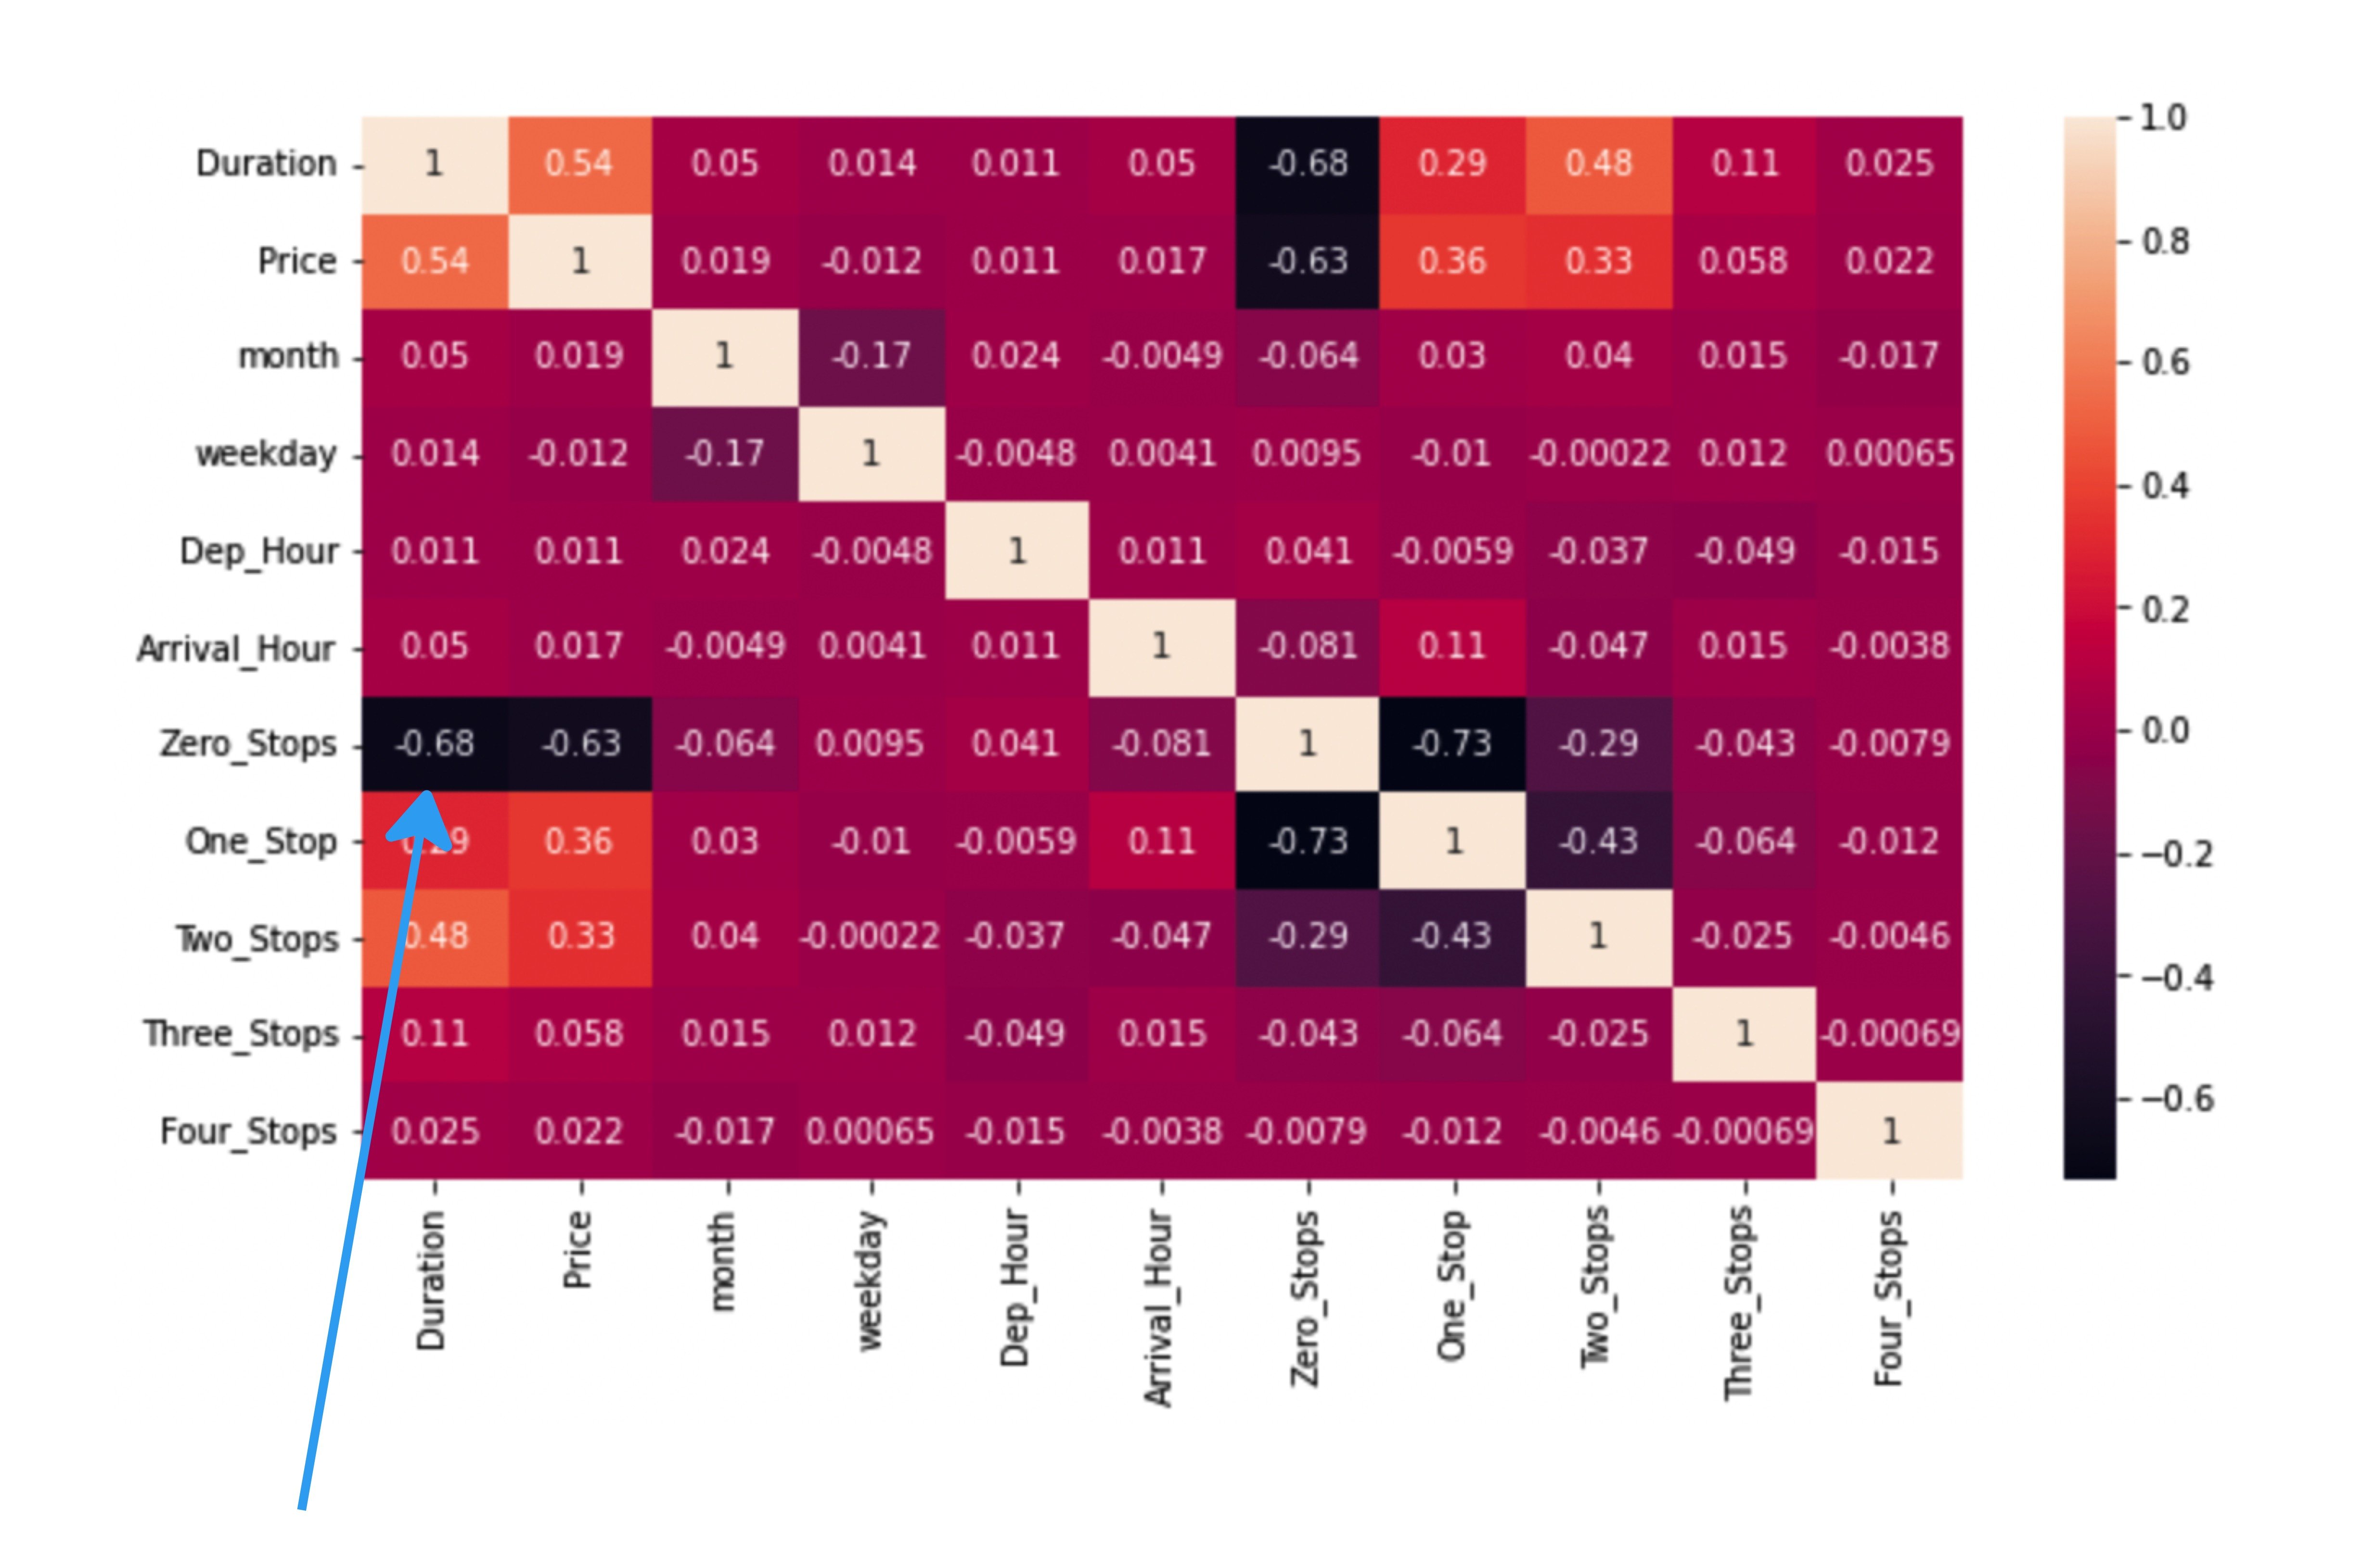
sns.heatmap(planes.corr(numeric_only=True), annot=True)
plt.show()
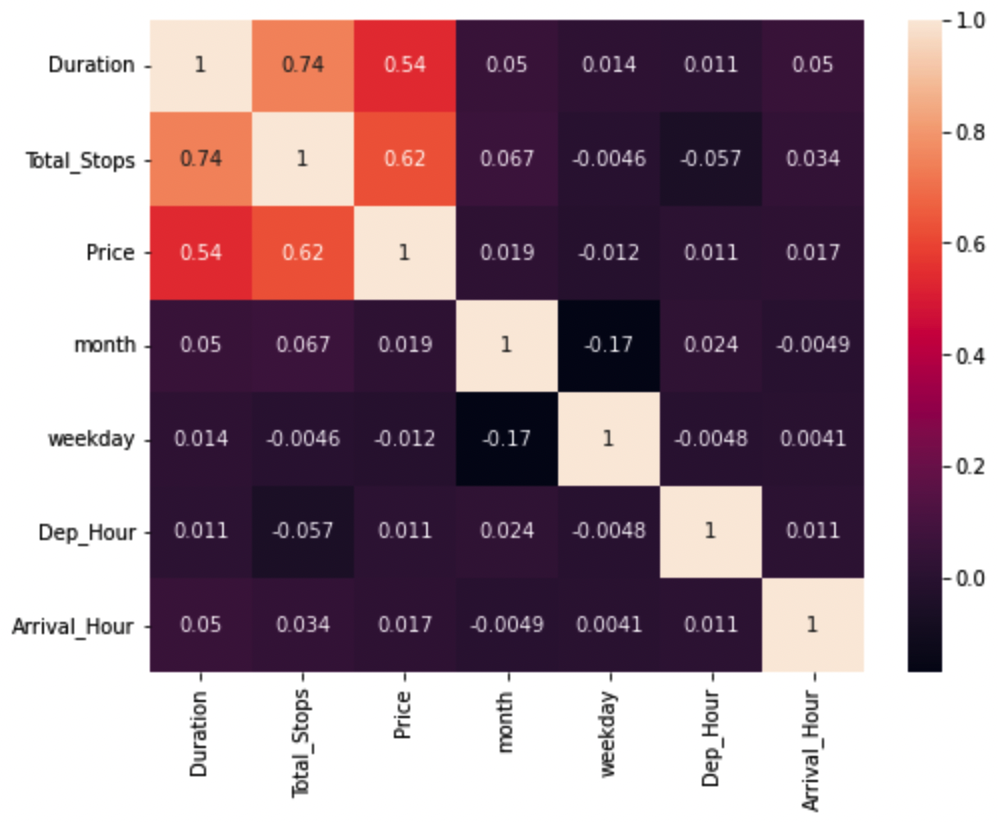
Heatmap showing Pearson correlation coefficient scores between variables in the planes dataset

Pythonによる探索的データ分析

疑似相関

sns.scatterplot(data=planes, x="Duration", y="Price", hue="Total_Stops")
plt.show()
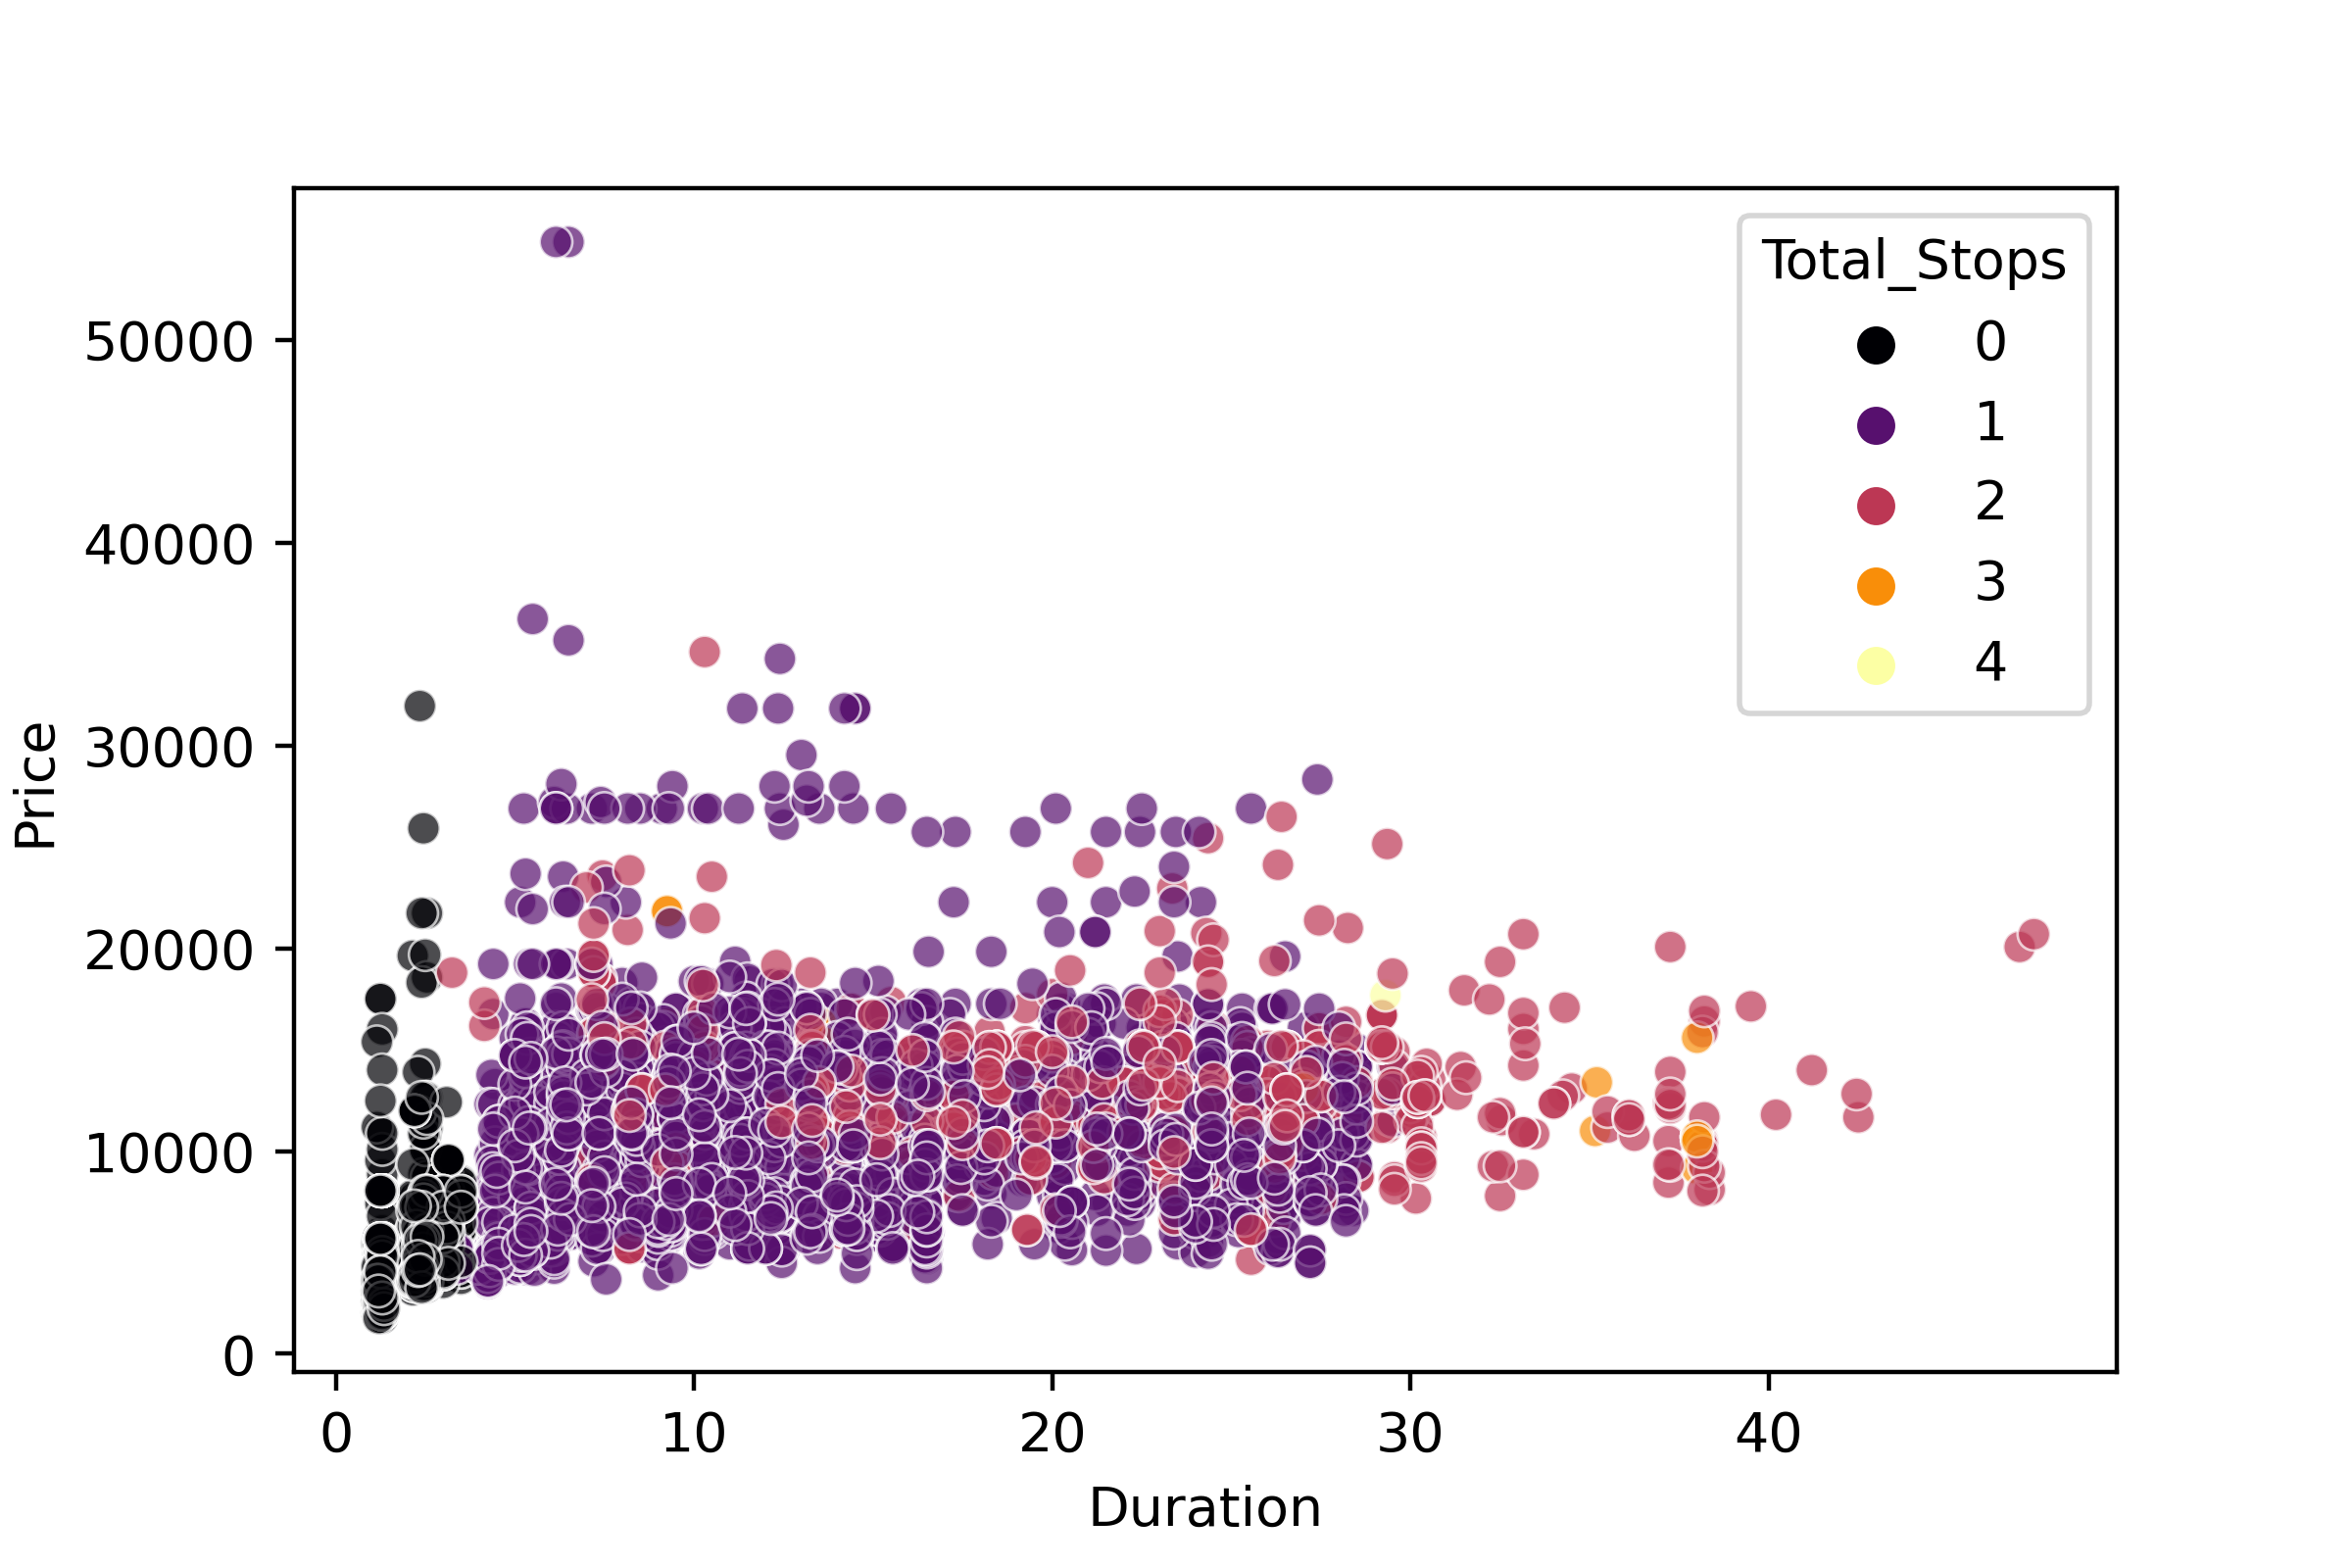
Scatter plot of Price versus Duration, factoring Total Stops

Pythonによる探索的データ分析

どうすれば確かめられるでしょうか?

Heatmap with correlation coefficient scores for each number of stops

Pythonによる探索的データ分析

何が本当なのでしょうか?

Typewriter displaying "Fake News"

  • 別の時期のデータでも同じ結果が得られますか?

  • 関係・差・パターンを検出するには:

    • 仮説検定を行う
  • 仮説検定では、データ収集前に次のことが必要:

    • 使用する統計検定を決める
1 画像クレジット: https://unsplash.com/@markuswinkler
Pythonによる探索的データ分析

データスヌーピング

office with a view looking out on to an airport runway

Magnifying glass looking into a bar chart

Pythonによる探索的データ分析

仮説を立てる

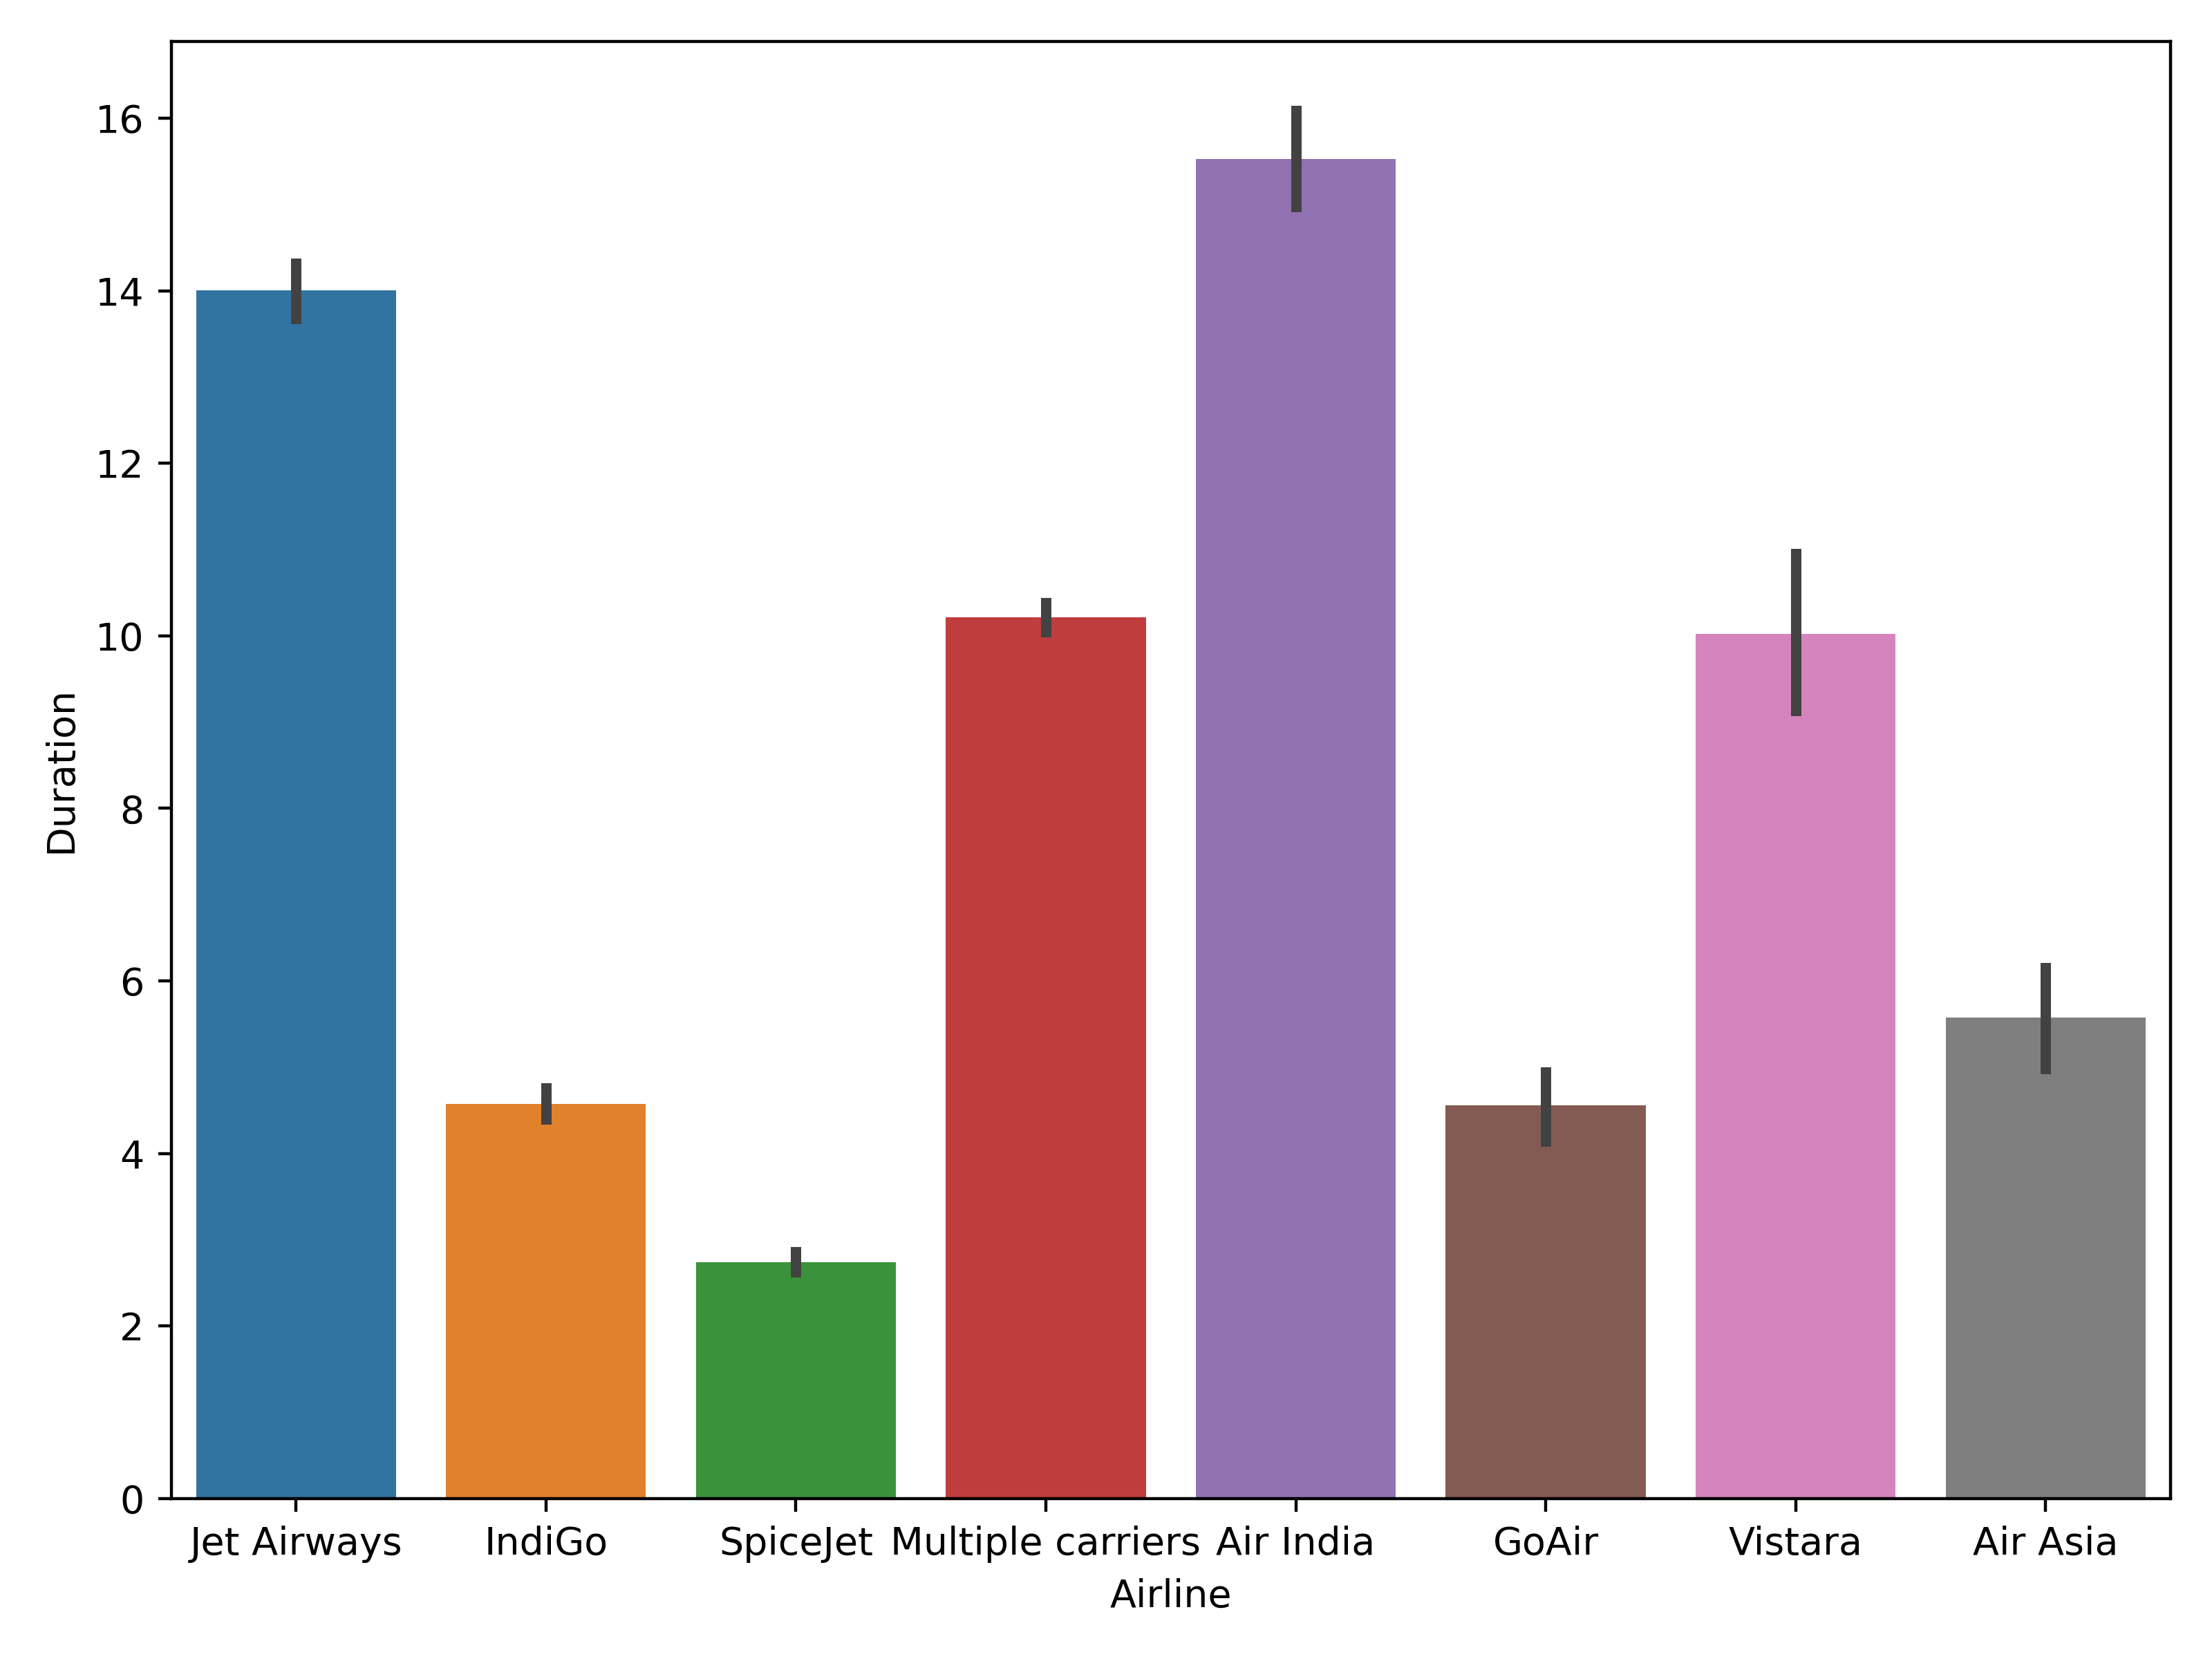
sns.barplot(data=planes, x="Airline", y="Duration")
plt.show()

Bar plot of duration versus airline

Pythonによる探索的データ分析

仮説を立てる

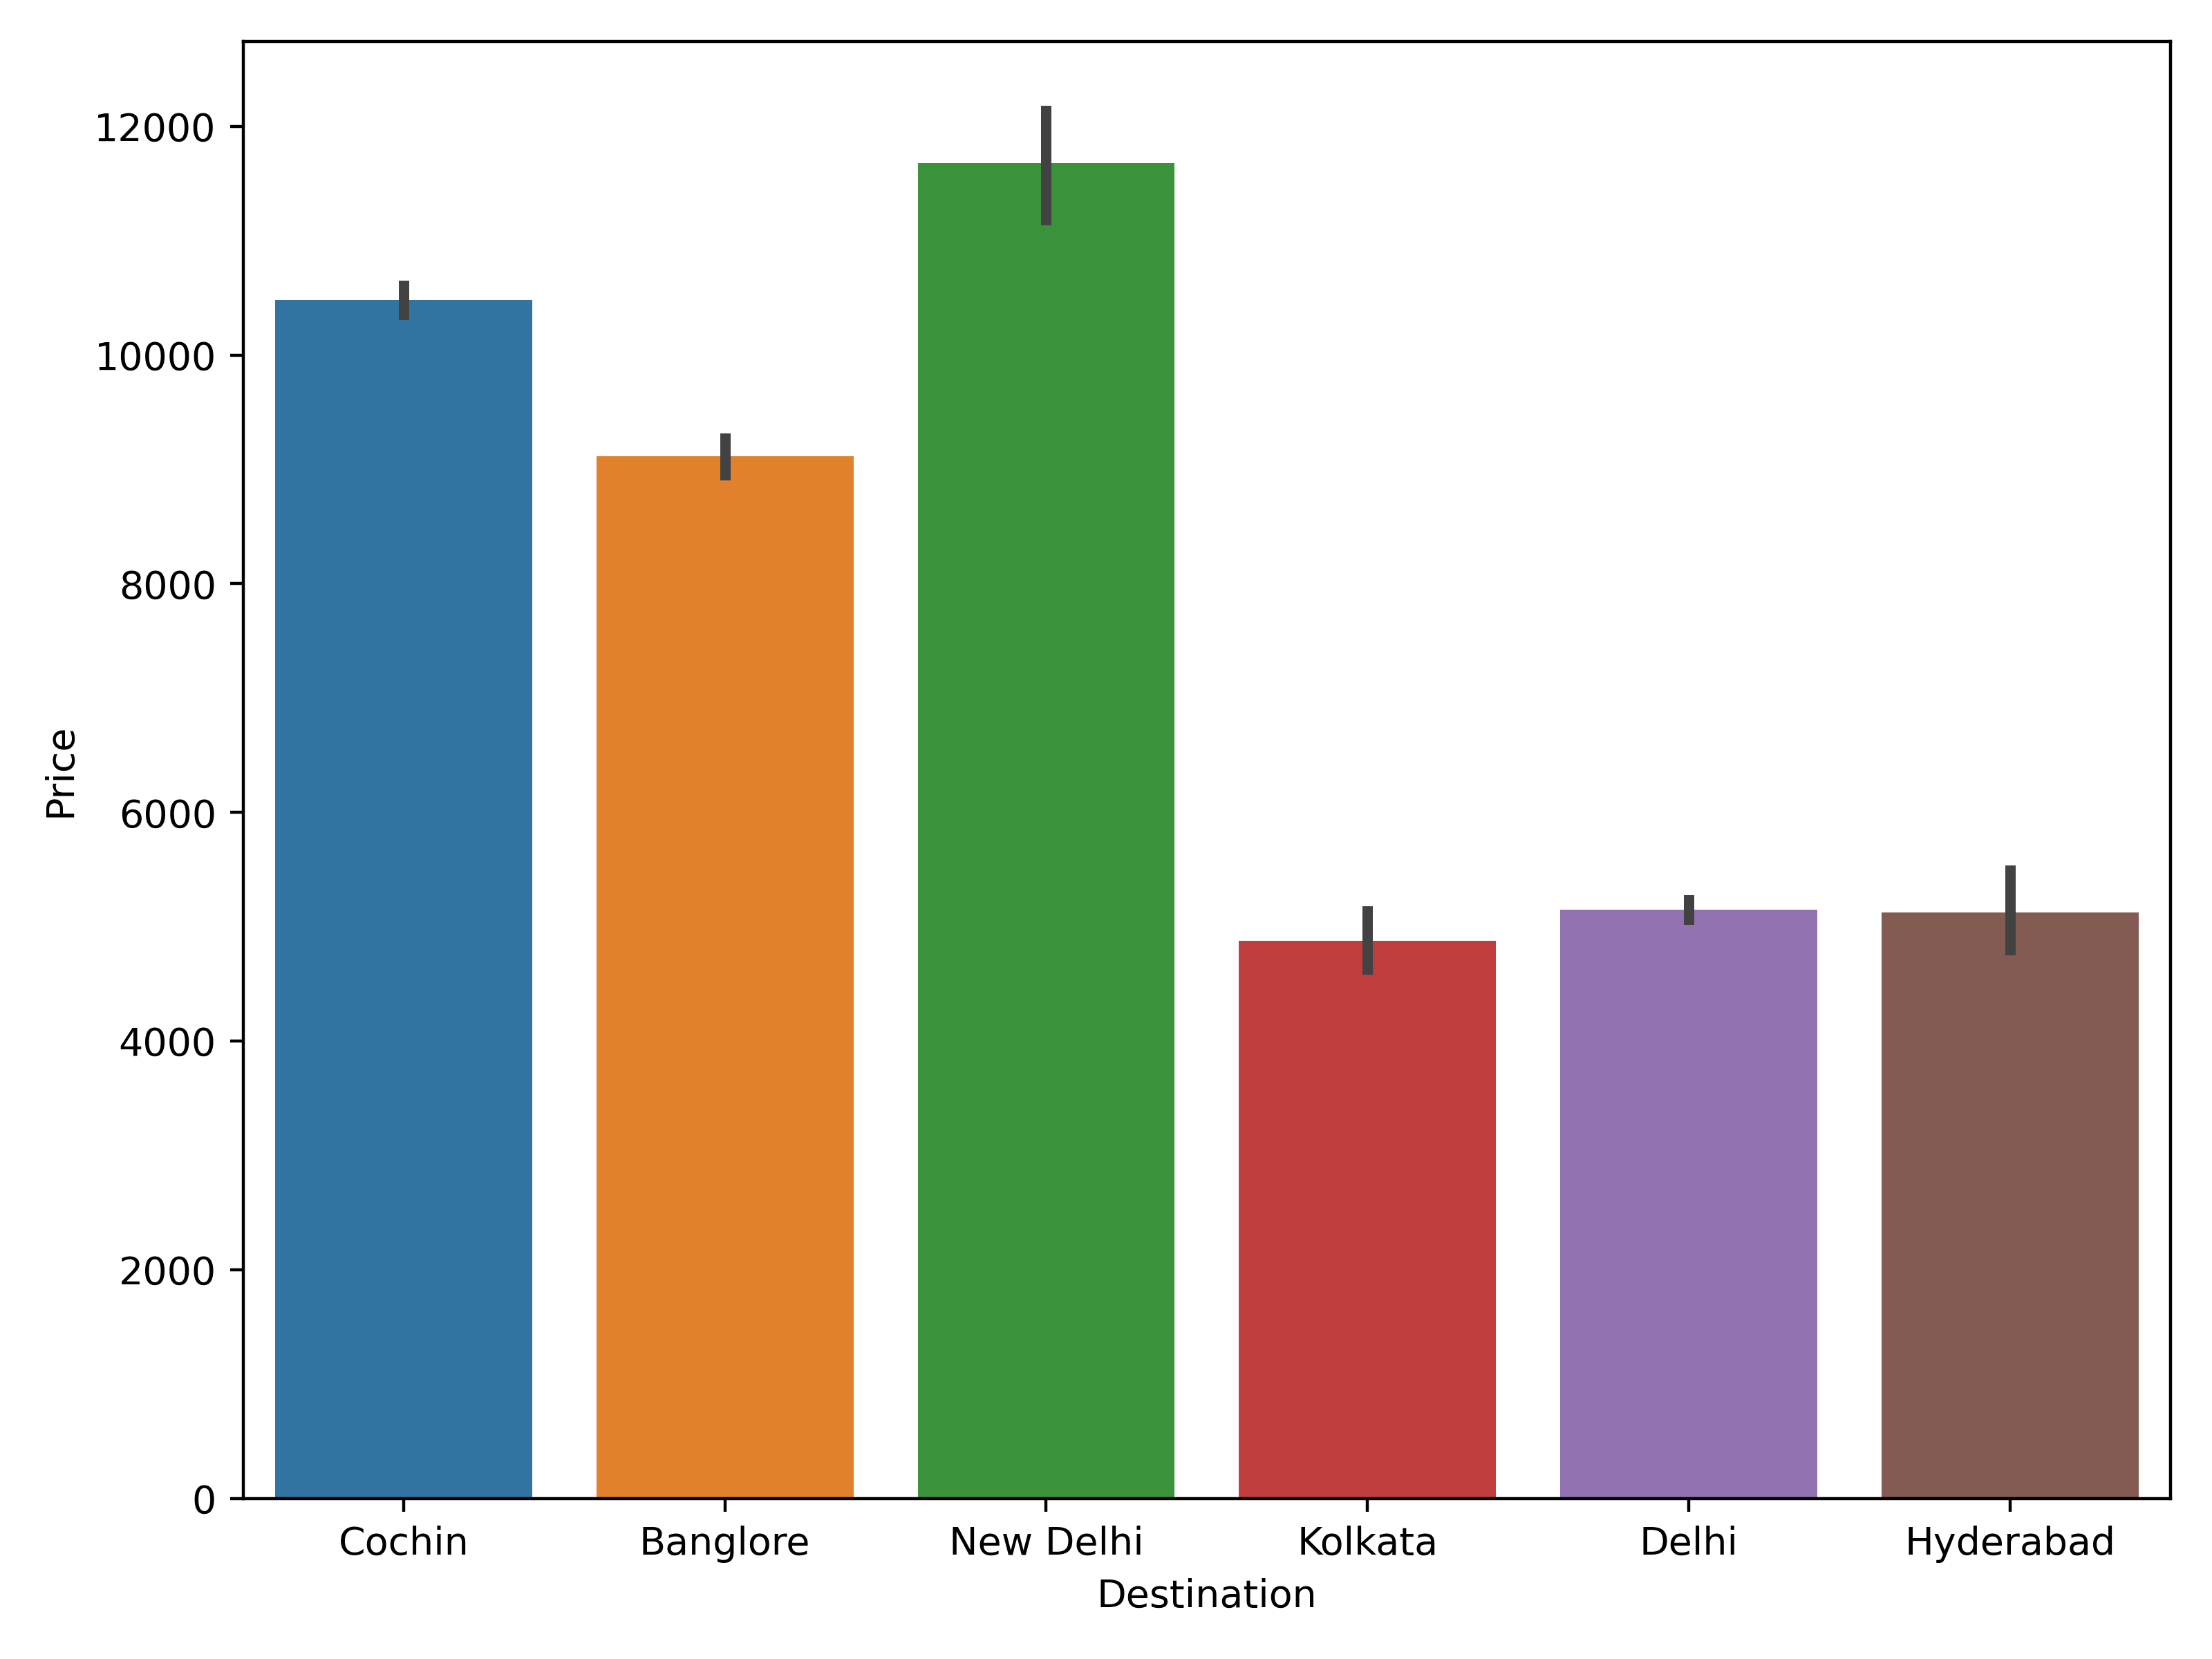
sns.barplot(data=planes, x="Destination", y="Price")
plt.show()

Bar plot showing average proce

Pythonによる探索的データ分析

次のステップ

  • 実験を設計

  • 次のような手順が含まれる:

    • サンプル選択
    • 必要なデータ数を算出
    • 使用する統計検定を決定
Pythonによる探索的データ分析

お疲れさまでした!

Pythonによる探索的データ分析

Preparing Video For Download...