カテゴリデータの考慮点

Pythonで学ぶ探索的データ分析

George Boorman

Curriculum Manager, DataCamp

なぜEDAを行うか

  • パターンや関係を発見


  • 質問や仮説を立てる


  • 機械学習に向けた前処理

赤いネオンのクエスチョンマーク

1 Image credit: https://unsplash.com/@simonesecci
Pythonで学ぶ探索的データ分析

代表性のあるデータ

  • サンプルは母集団を代表する

例:

  • 米国の学歴と収入の関係
    • フランスのデータは使えない

米国旗

フランス国旗

1 Image credits: https://unsplash.com/@cristina_glebova; https://unsplash.com/@nimbus_vulpis
Pythonで学ぶ探索的データ分析

カテゴリカルなクラス

  • クラス=ラベル


  • 結婚に対する意識の調査
    • 配偶状況
      • 独身
      • 既婚
      • 離婚
Pythonで学ぶ探索的データ分析

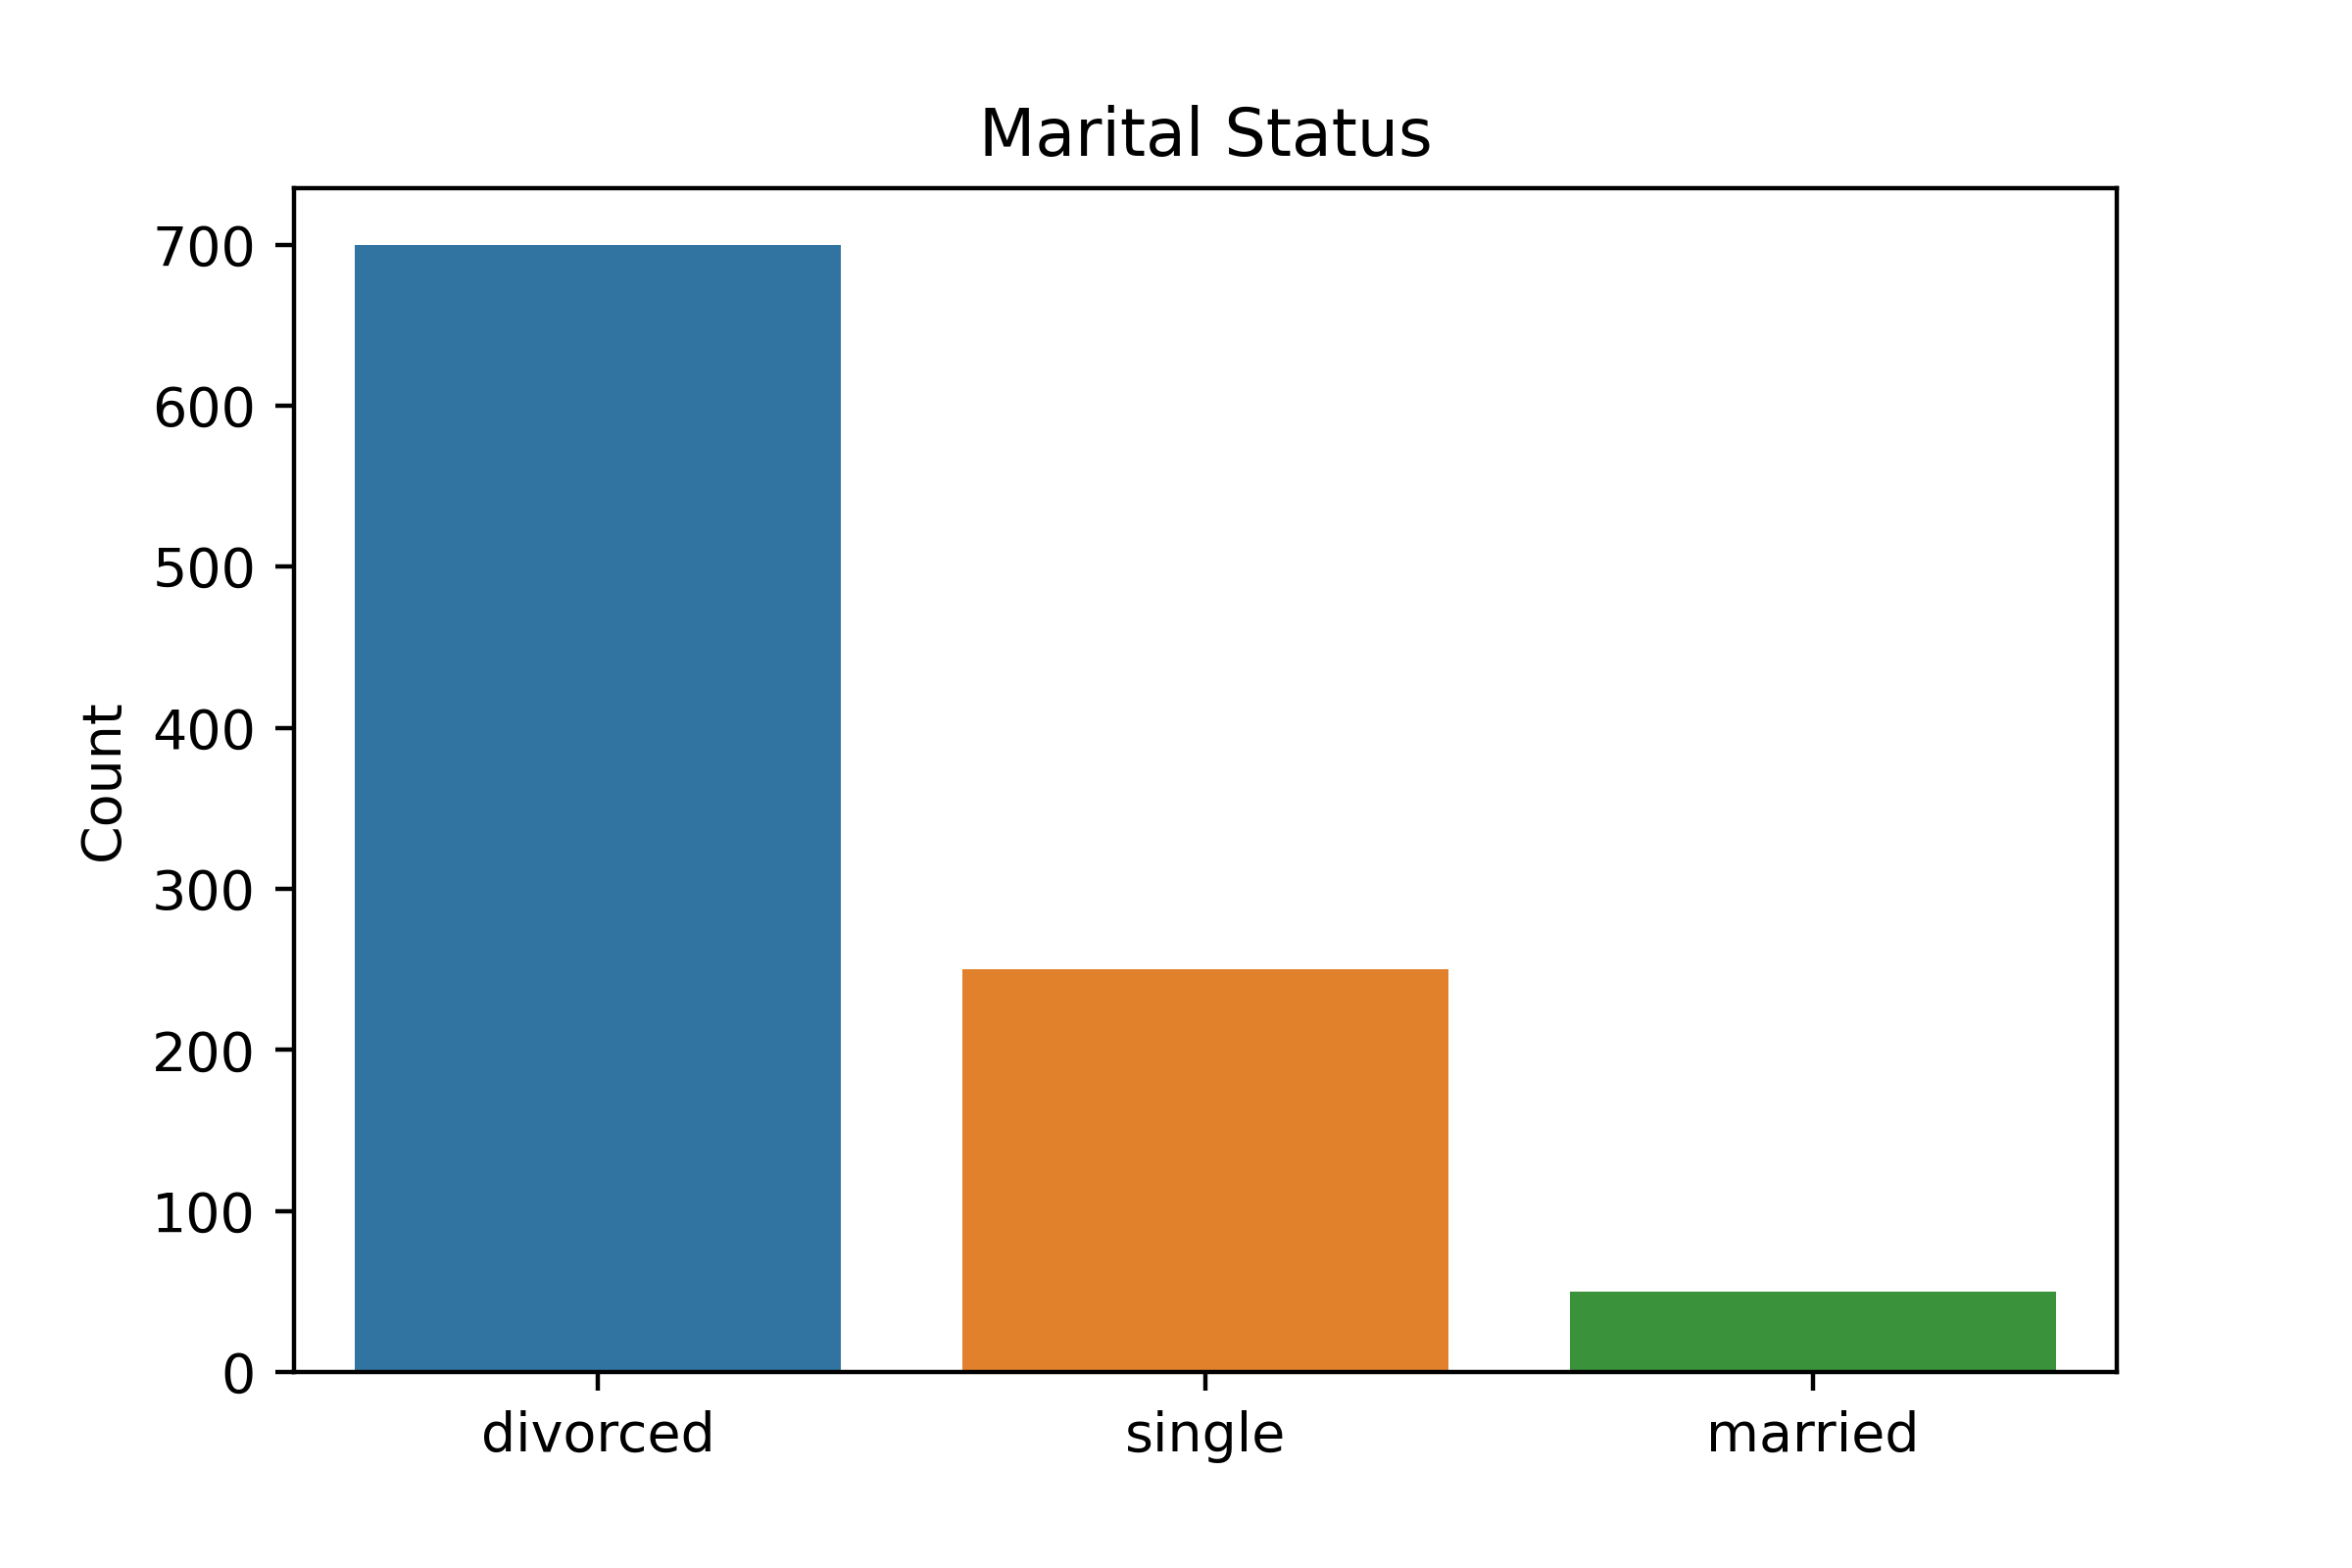
クラス不均衡

サンプルの配偶状況の棒グラフ — 離婚700、独身250、既婚50

Pythonで学ぶ探索的データ分析

クラス頻度

print(planes["Destination"].value_counts())
Cochin       4391
Banglore     2773
Delhi        1219
New Delhi     888
Hyderabad     673
Kolkata       369
Name: Destination, dtype: int64
Pythonで学ぶ探索的データ分析

相対的なクラス頻度

  • インド国内線の40%は目的地がDelhi
planes["Destination"].value_counts(normalize=True)
Cochin       0.425773
Banglore     0.268884
Delhi        0.118200
New Delhi    0.086105
Hyderabad    0.065257
Kolkata      0.035780
Name: Destination, dtype: float64
  • 本サンプルは母集団(インド国内線)を代表しているか?
Pythonで学ぶ探索的データ分析

クロス集計

pd.crosstab を呼び出す

pd.crosstab(
Pythonで学ぶ探索的データ分析

インデックスを選ぶ

インデックスに使う列を選択

pd.crosstab(planes["Source"],
Pythonで学ぶ探索的データ分析

列を選ぶ

列を選択

pd.crosstab(planes["Source"], planes["Destination"])
Pythonで学ぶ探索的データ分析

クロス集計

Destination  Banglore  Cochin  Delhi  Hyderabad  Kolkata  New Delhi
Source                                                             
Banglore            0       0   1199          0        0        868
Chennai             0       0      0          0      364          0
Delhi               0    4318      0          0        0          0
Kolkata          2720       0      0          0        0          0
Mumbai              0       0      0        662        0          0
Pythonで学ぶ探索的データ分析

クロス集計の拡張

Source Destination Median Price (IDR)
Banglore Delhi 4232.21
Banglore New Delhi 12114.56
Chennai Kolkata 3859.76
Delhi Cochin 9987.63
Kolkata Banglore 9654.21
Mumbai Hyderabad 3431.97
Pythonで学ぶ探索的データ分析

pd.crosstab() で集計値を算出

pd.crosstab(planes["Source"], planes["Destination"],

values=planes["Price"], aggfunc="median")
Destination  Banglore   Cochin   Delhi  Hyderabad  Kolkata  New Delhi
Source                                                               
Banglore          NaN      NaN  4823.0        NaN      NaN    10976.5
Chennai           NaN      NaN     NaN        NaN   3850.0        NaN
Delhi             NaN  10262.0     NaN        NaN      NaN        NaN
Kolkata        9345.0      NaN     NaN        NaN      NaN        NaN
Mumbai            NaN      NaN     NaN     3342.0      NaN        NaN
Pythonで学ぶ探索的データ分析

サンプルと母集団の比較

Source Destination Median Price (IDR) Median Price (dataset)
Banglore Delhi 4232.21 4823.0
Banglore New Delhi 12114.56 10976.50
Chennai Kolkata 3859.76 3850.0
Delhi Cochin 9987.63 10260.0
Kolkata Banglore 9654.21 9345.0
Mumbai Hyderabad 3431.97 3342.0
Pythonで学ぶ探索的データ分析

Ayo berlatih!

Pythonで学ぶ探索的データ分析

Preparing Video For Download...