ggplot2 を使ったデータ可視化入門
Rick Scavetta
Founder, Scavetta Academy
棒グラフ | histogram, bar, col, errorbar | | 折れ線グラフ | line, path |
str(beaver)
'data.frame':    101 obs. of  3 variables:
 $ time  : POSIXct, format: "2000-01-01 09:30:00" "2000-01-01 09:40:00" "2000-01-01 09:50:00" ...
 $ temp  : num  36.6 36.7 36.9 37.1 37.2 ...
 $ active: Factor w/ 2 levels "0","1": 1 1 1 1 1 1 1 1 1 1 ...
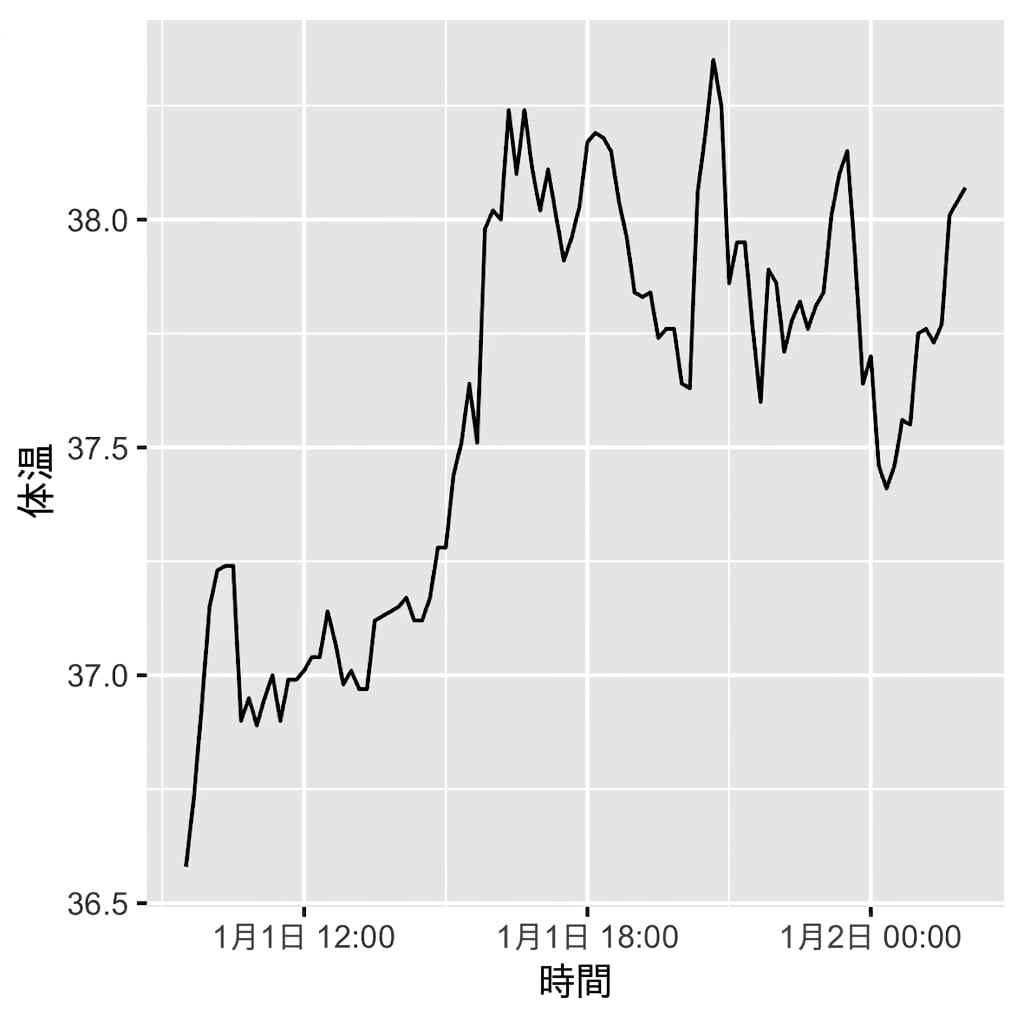
ggplot(beaver, aes(x = time, y = temp)) +
  geom_line()
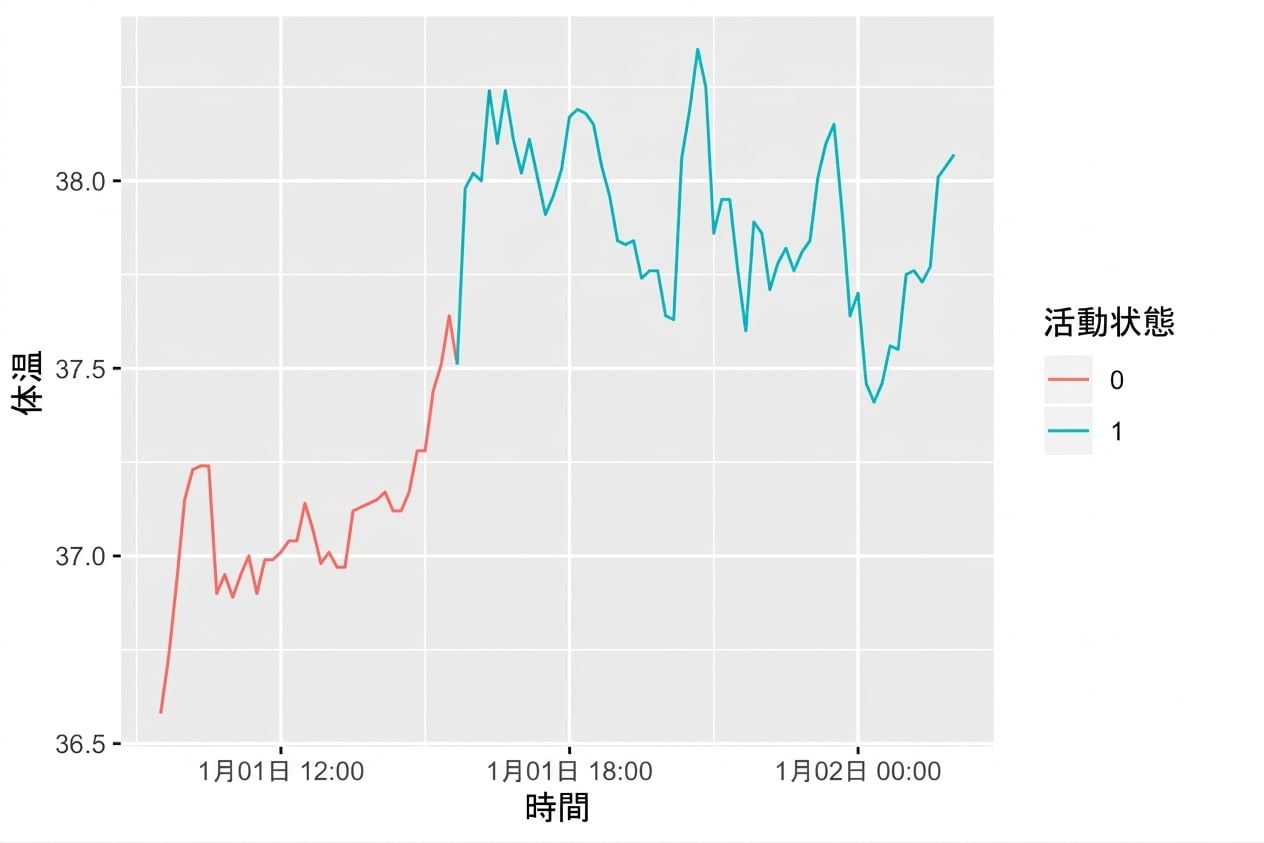
ggplot(beaver, aes(x = time, y = temp,
                   color = factor(active))
                   ) +
  geom_line()
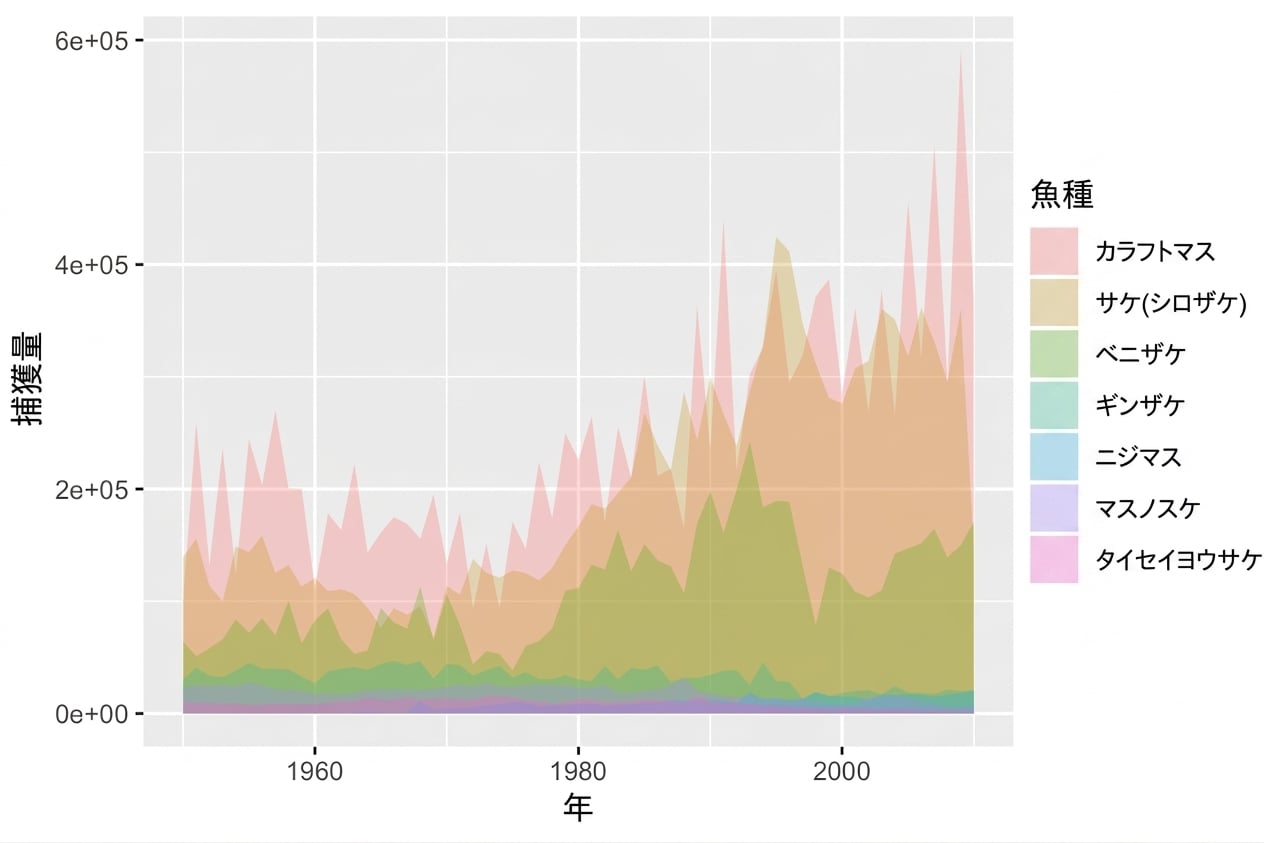
str(fish)
'data.frame':    427 obs. of  3 variables:
 $ Species: Factor w/ 7 levels "Pink","Chum",..: 1 2 3 4 5 6 7 1 2 3 ...
 $ Year   : int  1950 1950 1950 1950 1950 1950 1950 1951 1951 1951 ...
 $ Capture: int  100600 139300 64100 30500 0 23200 10800 259000 155900 51200 ...
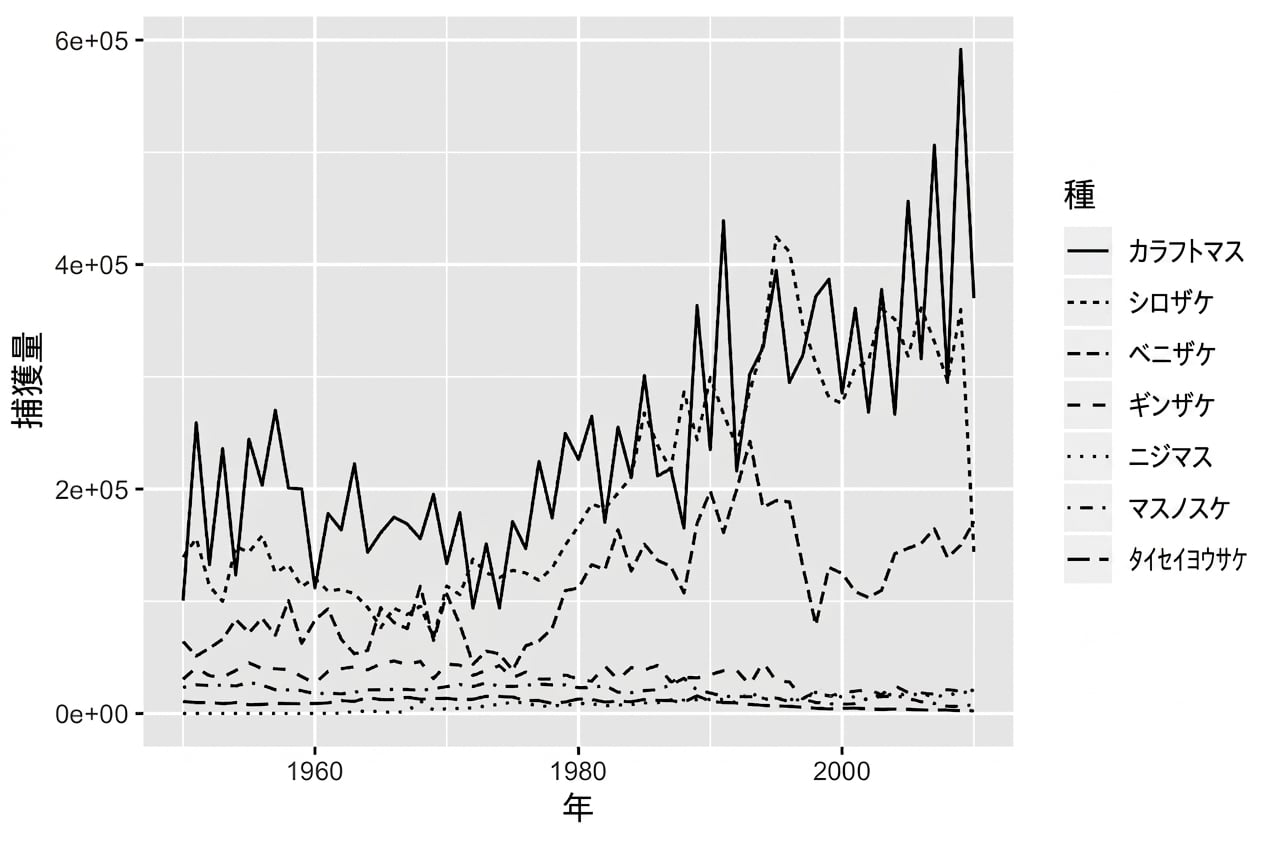
ggplot(fish, aes(x = Year,
                 y = Capture,
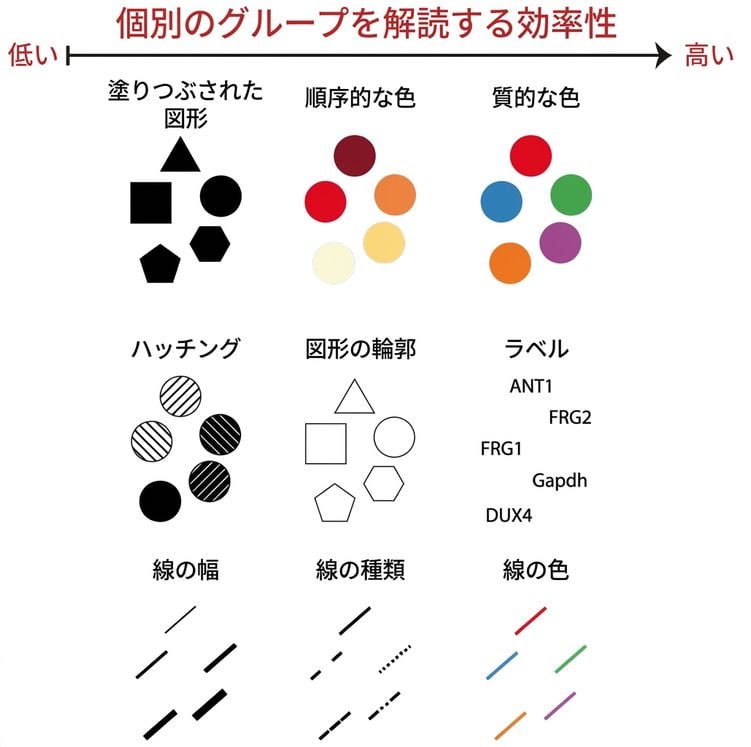
                 linetype = Species)) +
  geom_line()
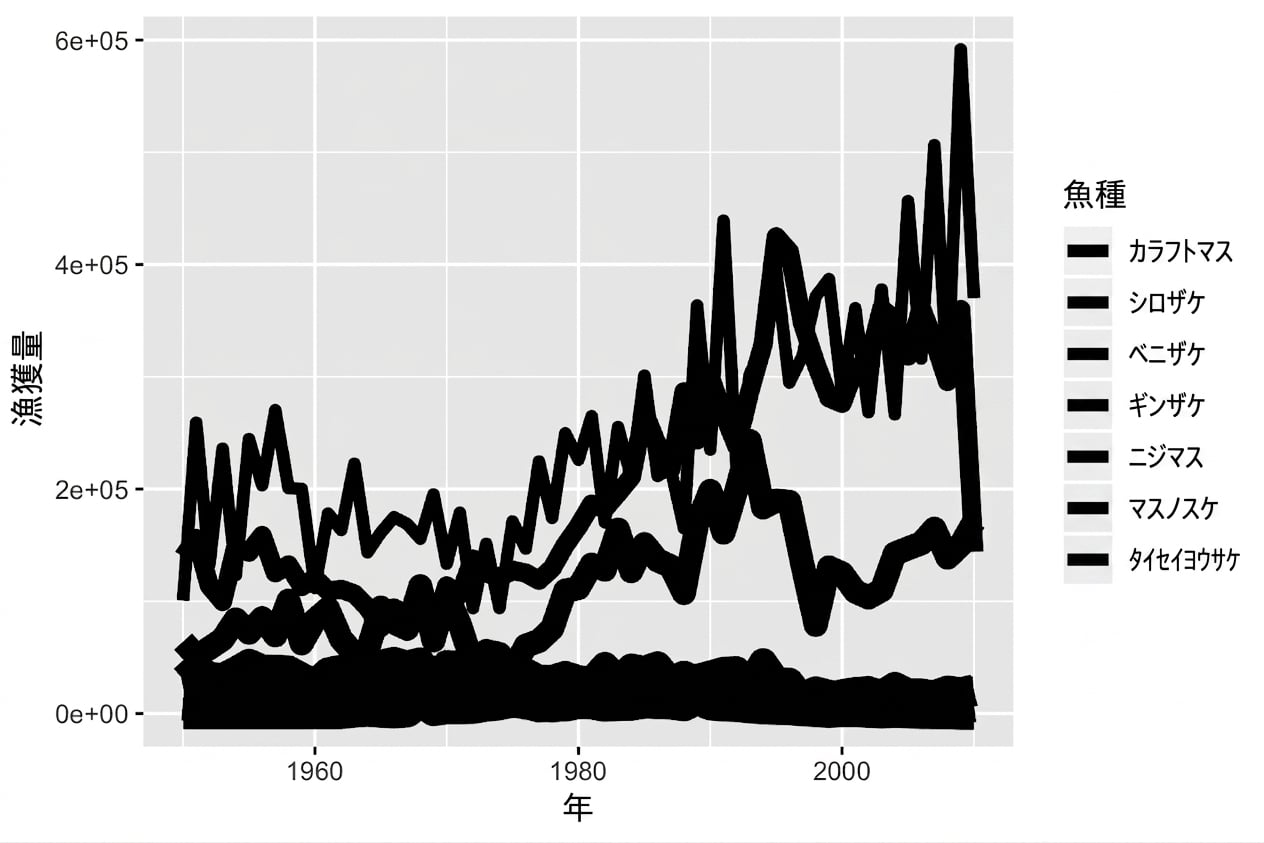
ggplot(fish, aes(x = Year,
                 y = Capture,
                 size = Species)) +
  geom_line()
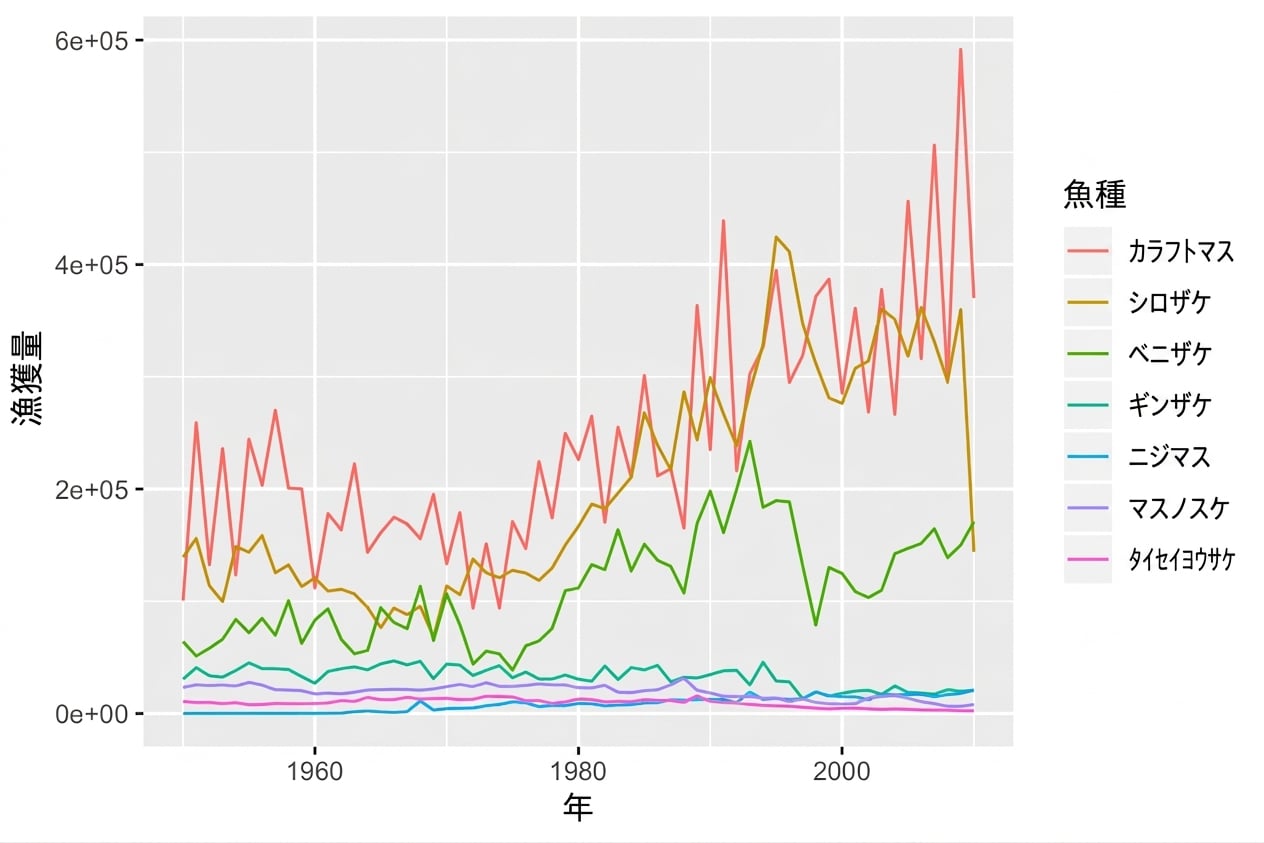
ggplot(fish, aes(x = Year,
                 y = Capture,
                 color = Species)) +
  geom_line()
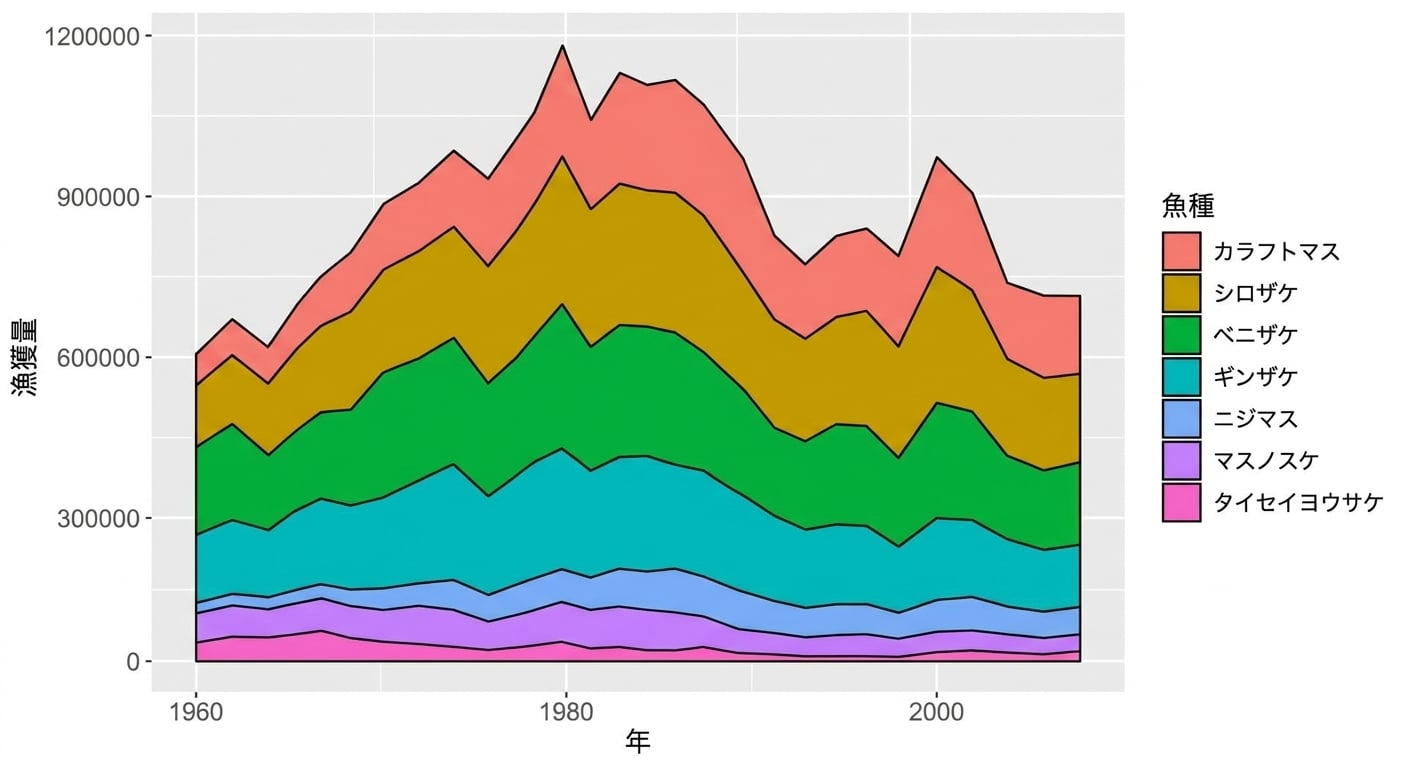
ggplot(fish, aes(x = Year,
                 y = Capture,
                 fill = Species)) +
  geom_area()
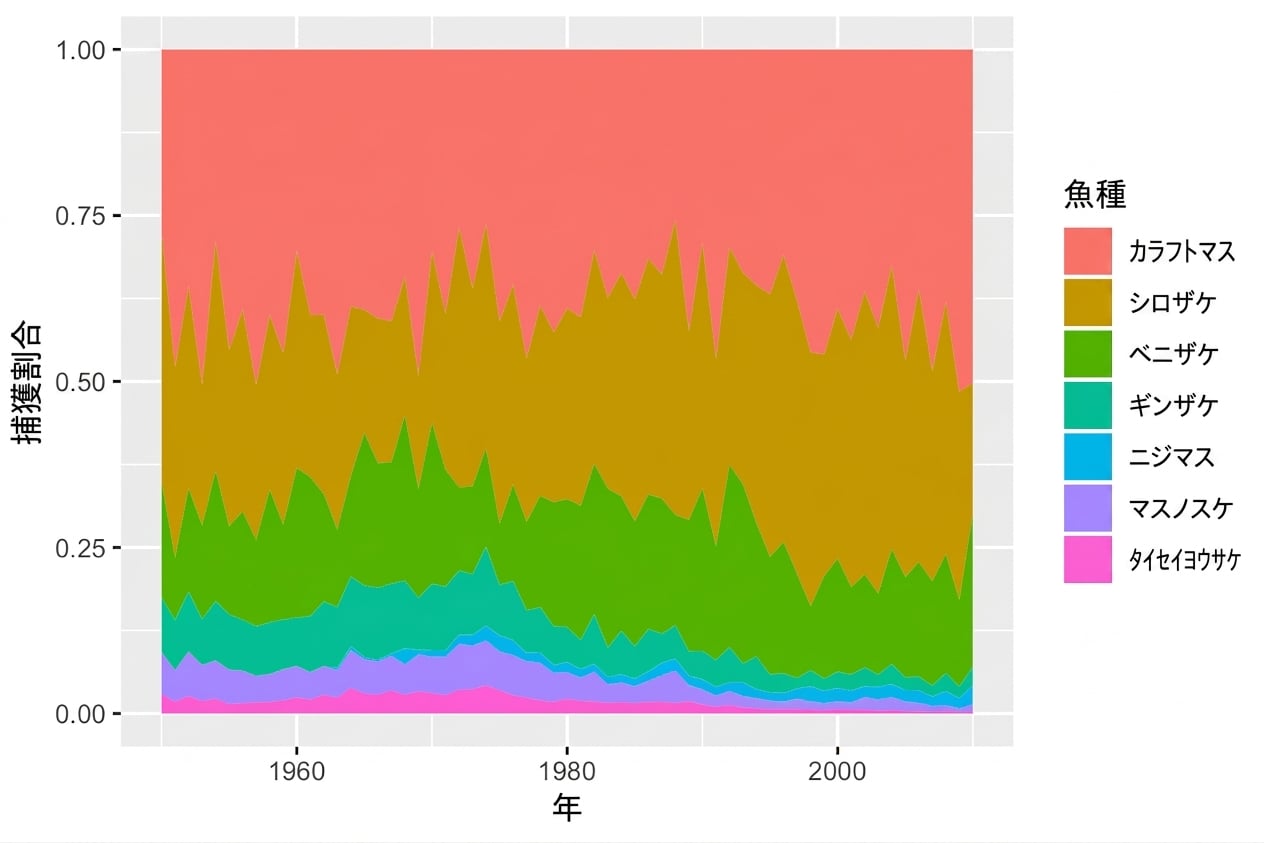
ggplot(fish, aes(x = Year,
                 y = Capture,
                 fill = Species)) +
  geom_area(position = "fill")
ggplot(fish, aes(x = Year,
                 y = Capture,
                 fill = Species)) +
  geom_ribbon(aes(ymax = Capture,
                  ymin = 0),
              alpha = 0.3)