棒グラフ

ggplot2 を使ったデータ可視化入門

Rick Scavetta

Founder, Scavetta Academy

X軸にカテゴリを表示する棒グラフ

  • geombar() または geomcol() を使用する
幾何要素 統計処理 処理内容
geom_bar() "count" x軸の各位置にあるデータの件数を数える
geom_col() "identity" データの値をそのままプロットする
  • これまでに紹介した位置調整はすべて使用できます。
  • 2種類
    • 絶対数
    • 分布
ggplot2 を使ったデータ可視化入門

X軸にカテゴリを表示する棒グラフ

  • geombar() または geomcol() を使用する
幾何要素 統計処理 処理内容
geom_bar() "count" x軸の各位置にあるデータの件数を数える
geom_col() "identity" データの値をそのままプロットする
ggplot2 を使ったデータ可視化入門

X軸にカテゴリを表示する棒グラフ

  • geombar() または geomcol() を使用する
幾何要素 統計処理 処理内容
geom_bar() "count" x軸の各位置にあるデータの件数を数える
geom_col() "identity" データの値をそのままプロットする
  • これまでに紹介した位置調整はすべて使用できます。
  • 2種類
    • 絶対数
    • 分布
ggplot2 を使ったデータ可視化入門

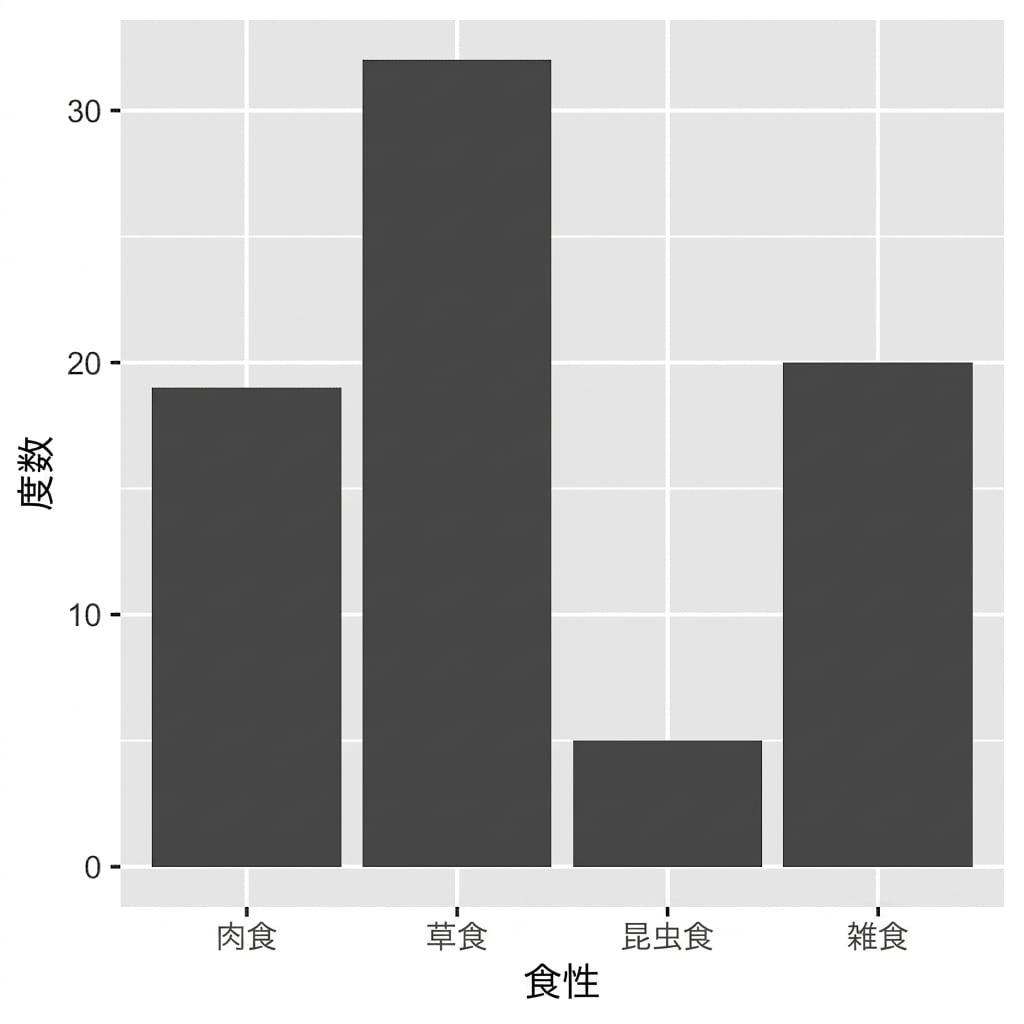
哺乳類の習性

str(sleep)
'data.frame':    76 obs. of  3 variables:
 $ vore : Factor w/ 4 levels "carni","herbi",..: 1 4 2 4 2 2 1 1 2 2 ...
 $ total: num  12.1 17 14.4 14.9 4 14.4 8.7 10.1 3 5.3 ...
 $ rem  : num  NA 1.8 2.4 2.3 0.7 2.2 1.4 2.9 NA 0.6 ...
ggplot2 を使ったデータ可視化入門

棒グラフ

ggplot(sleep, aes(vore)) + 
  geom_bar()

ggplot2 を使ったデータ可視化入門

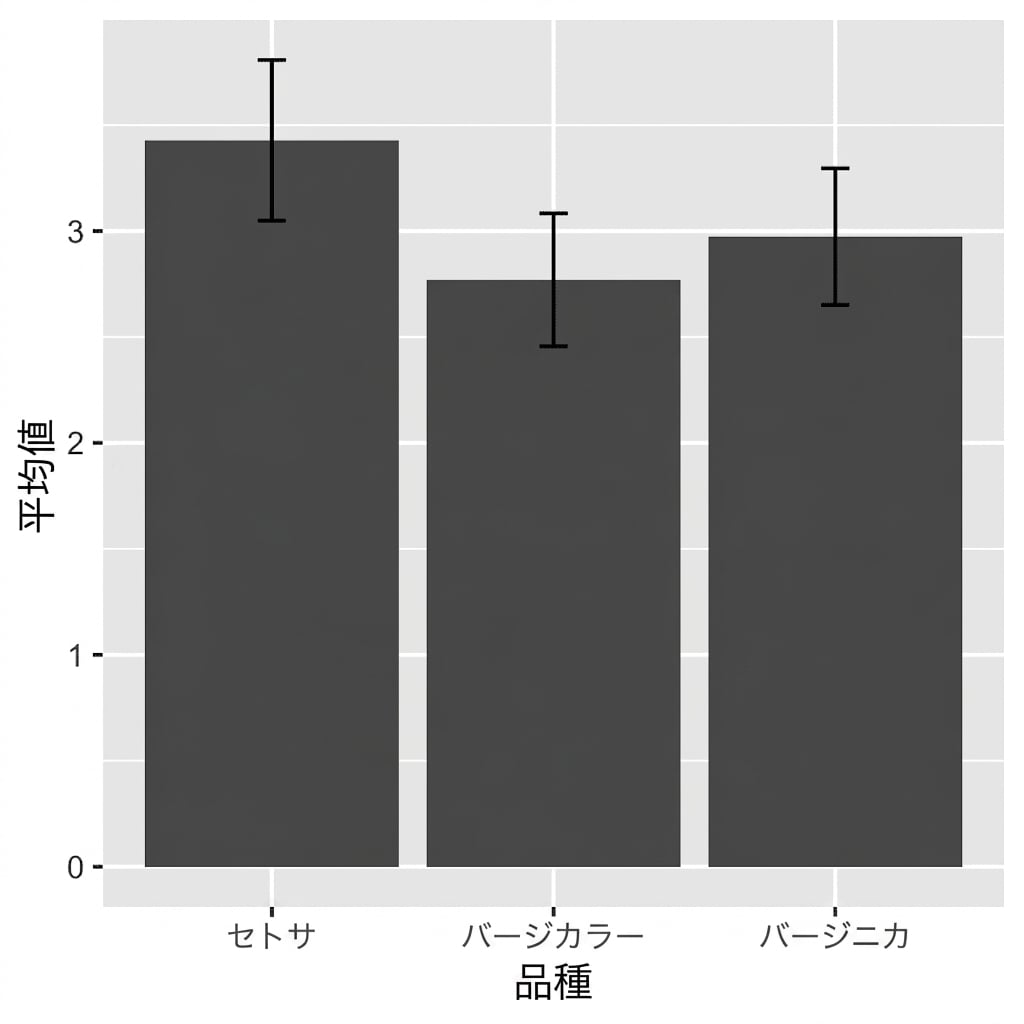
絶対数ではなく分布をプロットする

# Calculate Descriptive Statistics:
iris %>% 
  select(Species, Sepal.Width) %>% 
  pivot_longer(!Species, names_to = "key", 
  values_to = "value") %>%
  group_by(Species) %>% 
  summarise(avg = mean(value), 
            stdev = sd(value))
   -> iris_summ_long
iris_summ_long
Species avg stdev
setosa 3.43 0.38
versicolor 2.77 0.31
virginica 2.97 0.32
ggplot2 を使ったデータ可視化入門

分布をプロットする

ggplot(iris_summ_long, aes(x = Species, 
                           y = avg)) + 
  geom_col() +
  geom_errorbar(aes(ymin = avg - stdev, 
                    ymax = avg + stdev), 
                width = 0.1)

ggplot2 を使ったデータ可視化入門

お疲れさまでした!

ggplot2 を使ったデータ可視化入門

Preparing Video For Download...