テーマの柔軟性

ggplot2 で始めるデータ可視化入門

Rick Scavetta

Founder, Scavetta Academy

テーマの使い方

  1. ゼロから作成(前の動画)
ggplot2 で始めるデータ可視化入門

テーマの使い方

  1. ゼロから作成(前の動画)
  2. テーマレイヤーオブジェクト
  3. 組み込みテーマ
    • ggplot2 または ggthemes パッケージ
  4. 他パッケージの組み込みテーマ
  5. 既定テーマの更新/設定
ggplot2 で始めるデータ可視化入門

テーマオブジェクトの定義

  • 多数のプロットに便利
  • スタイルの一貫性を保つ
  • 特定のテーマを全体に適用
ggplot2 で始めるデータ可視化入門

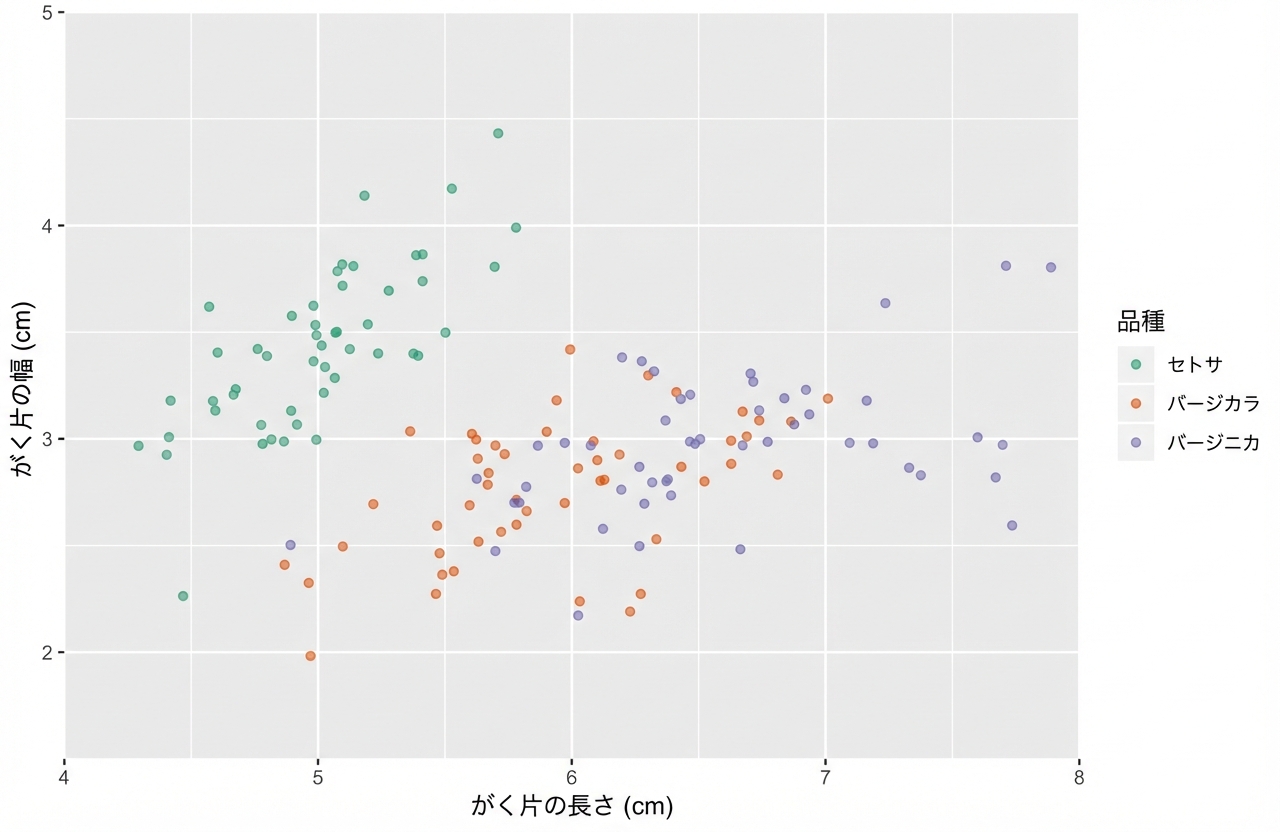
テーマオブジェクトの定義

z <- ggplot(iris, aes(x = Sepal.Length, y = Sepal.Width, color = Species)) + 
  geom_jitter(alpha = 0.6) +
  scale_x_continuous("Sepal Length (cm)", limits = c(4,8), expand = c(0,0)) +
  scale_y_continuous("Sepal Width (cm)", limits = c(1.5,5), expand = c(0,0)) +
  scale_color_brewer("Species", palette = "Dark2", labels = c("Setosa", "Versicolor", "Virginica"))
ggplot2 で始めるデータ可視化入門

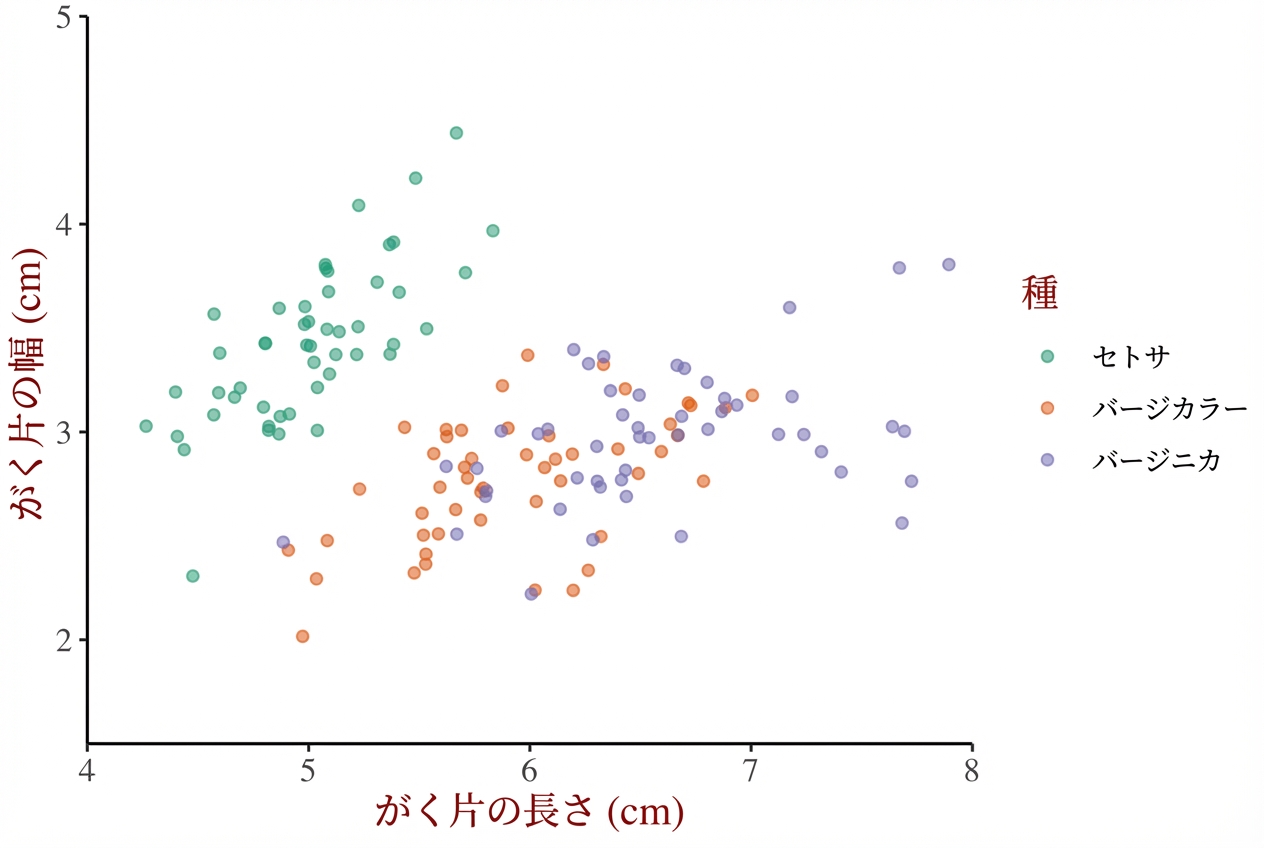
テーマオブジェクトの定義

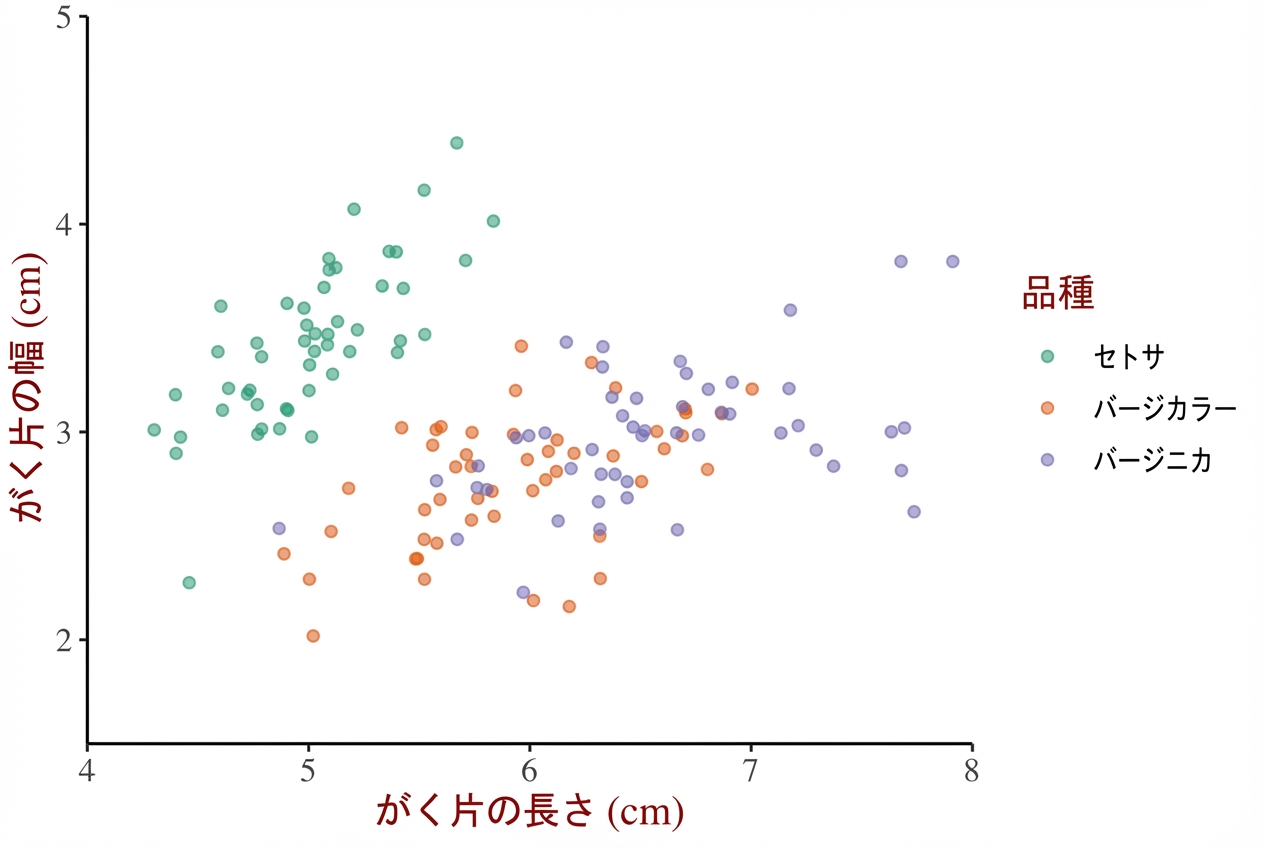
z + theme(text = element_text(family = "serif", size = 14),
          rect = element_blank(),
          panel.grid = element_blank(),
          title = element_text(color = "#8b0000"),
          axis.line = element_line(color = "black"))
ggplot2 で始めるデータ可視化入門

テーマオブジェクトの定義

theme_iris <- theme(text = element_text(family = "serif", size = 14),
          rect = element_blank(),
          panel.grid = element_blank(),
          title = element_text(color = "#8b0000"),
          axis.line = element_line(color = "black"))
ggplot2 で始めるデータ可視化入門

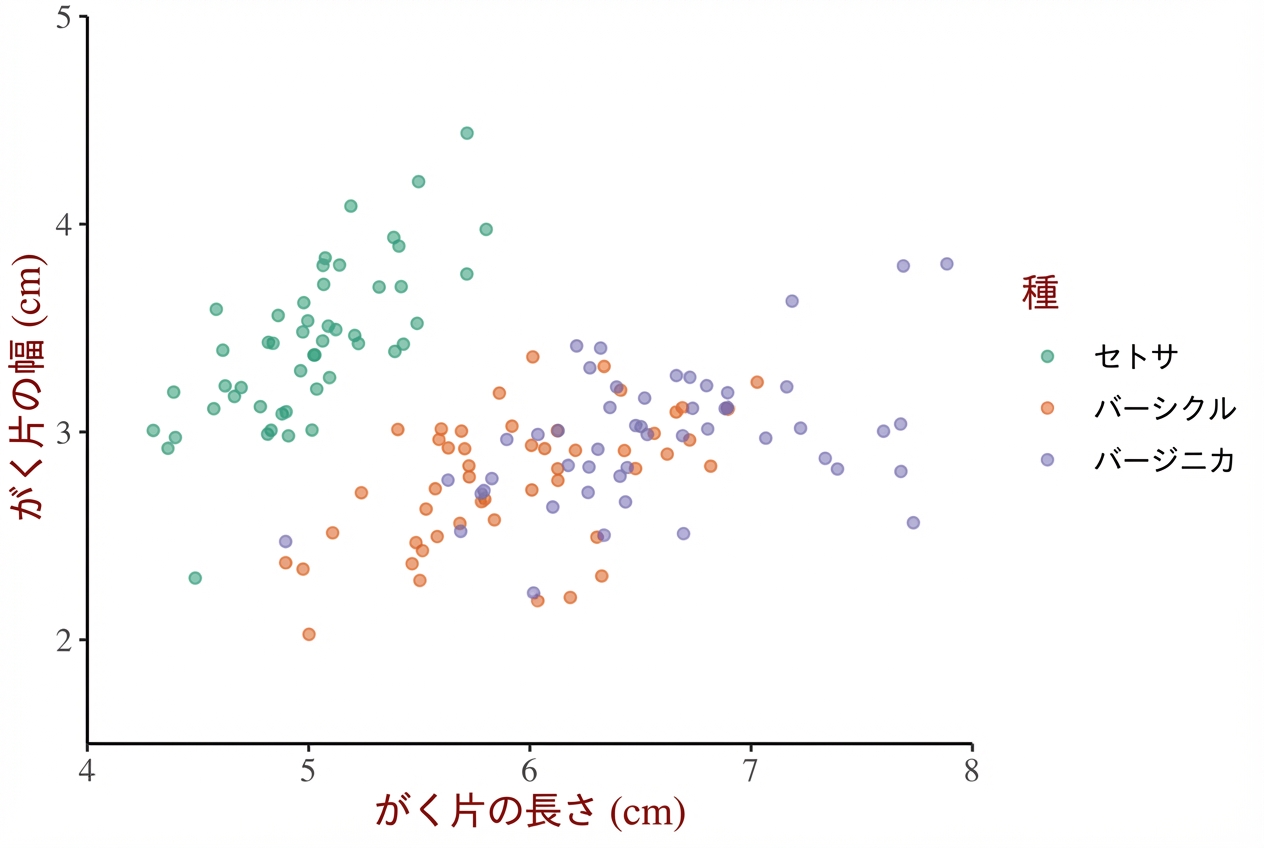
テーマオブジェクトの再利用

z + theme_iris

ggplot2 で始めるデータ可視化入門

テーマオブジェクトの再利用

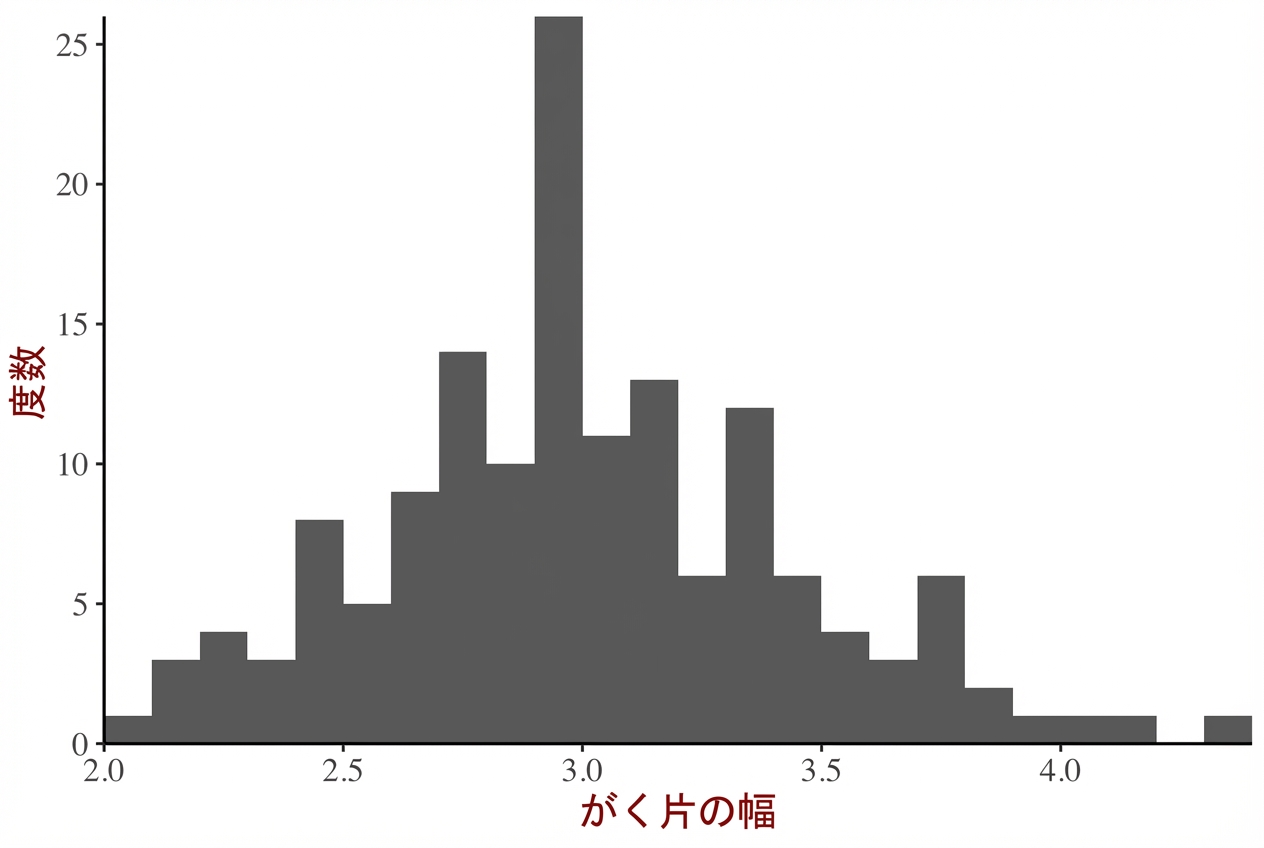
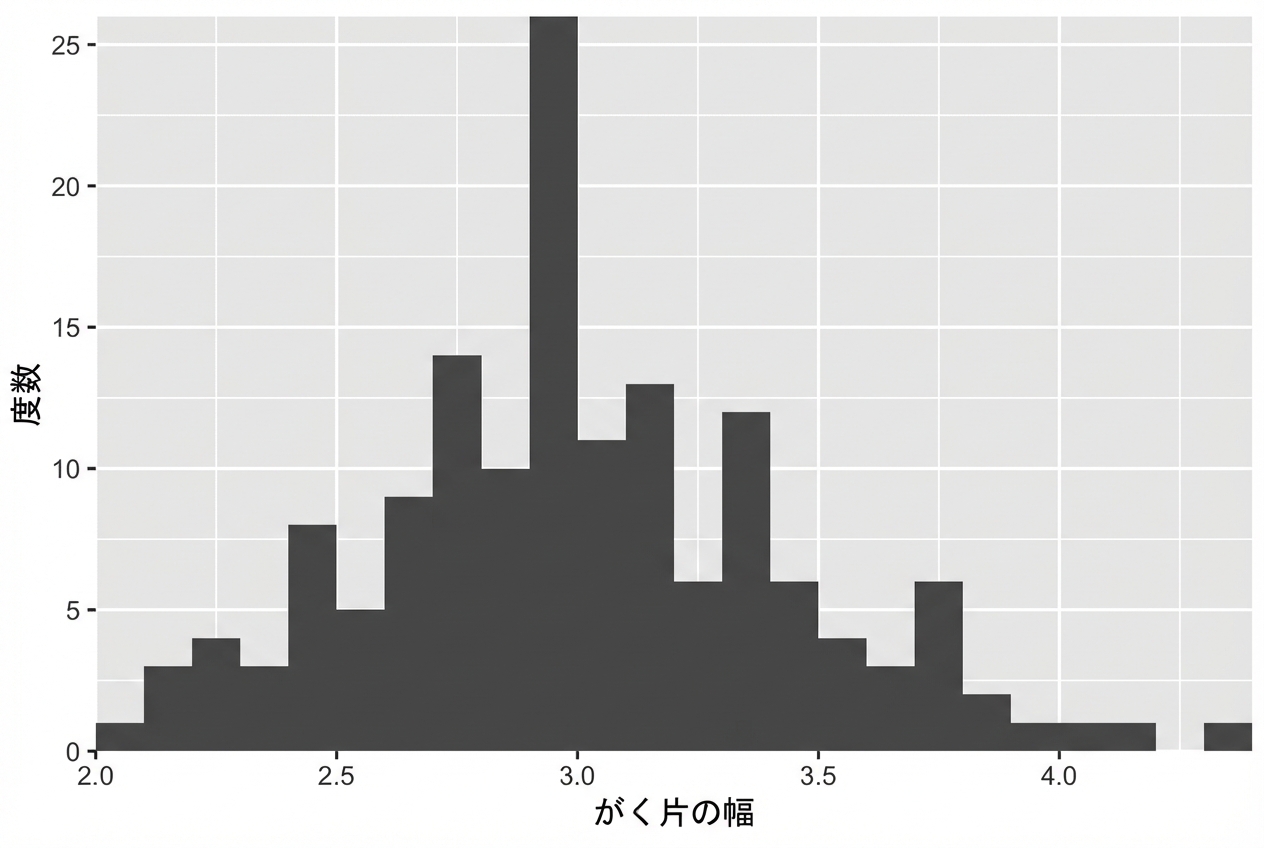
m <- ggplot(iris, aes(x = Sepal.Width)) + 
    geom_histogram(binwidth = 0.1,
                   center = 0.05)
m                 
ggplot2 で始めるデータ可視化入門

テーマオブジェクトの再利用

m +
  theme_iris

ggplot2 で始めるデータ可視化入門

テーマオブジェクトの再利用

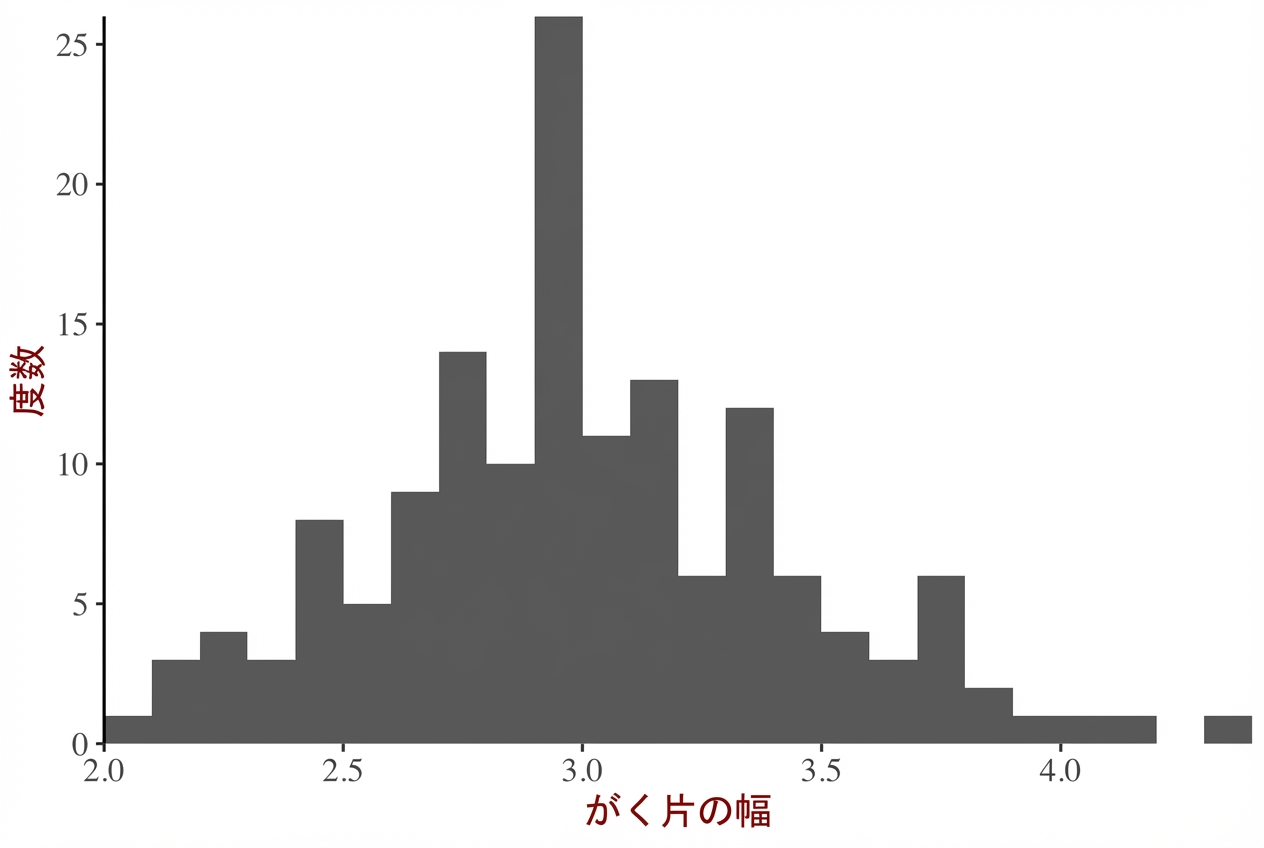
m + 
  theme_iris +
  theme(axis.line.x = element_blank())
ggplot2 で始めるデータ可視化入門

テーマの使い方

  1. ゼロから作成(前の動画)
  2. テーマレイヤーオブジェクト
  3. 組み込みテーマ
    • ggplot2 または ggthemes パッケージ
  4. 他パッケージの組み込みテーマ
  5. 既定テーマの更新/設定
ggplot2 で始めるデータ可視化入門

組み込みテーマの利用

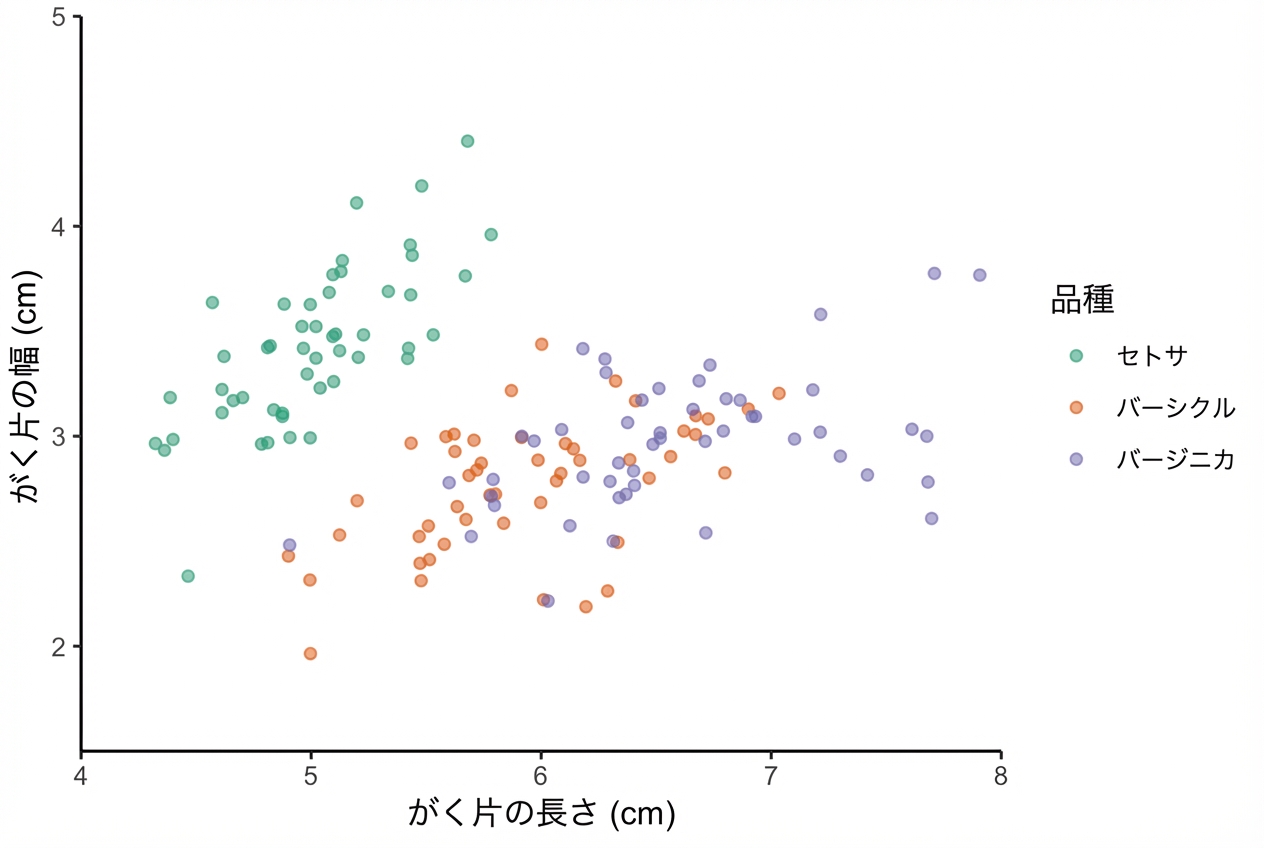
組み込みテーマは theme_*() で呼び出します。

z + 
  theme_classic()
ggplot2 で始めるデータ可視化入門

組み込みテーマの利用

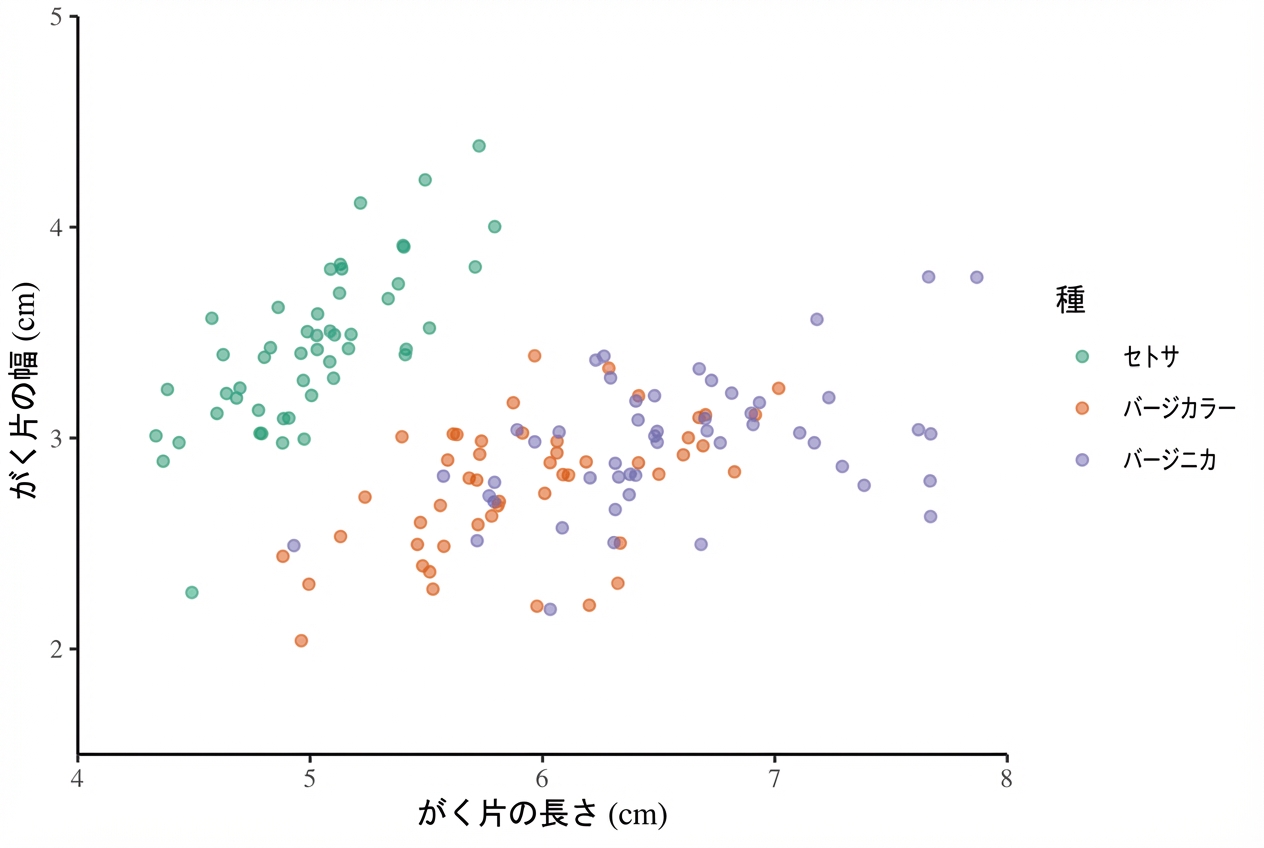
組み込みテーマは theme_*() で呼び出します。

z + 
  theme_classic() +
  theme(text = element_text(family = "serif"))
ggplot2 で始めるデータ可視化入門

テーマの使い方

  1. ゼロから作成(前の動画)
  2. テーマレイヤーオブジェクト
  3. 組み込みテーマ
    • ggplot2 または ggthemes パッケージ
  4. 他パッケージの組み込みテーマ
  5. 既定テーマの更新/設定
ggplot2 で始めるデータ可視化入門

ggthemes パッケージ

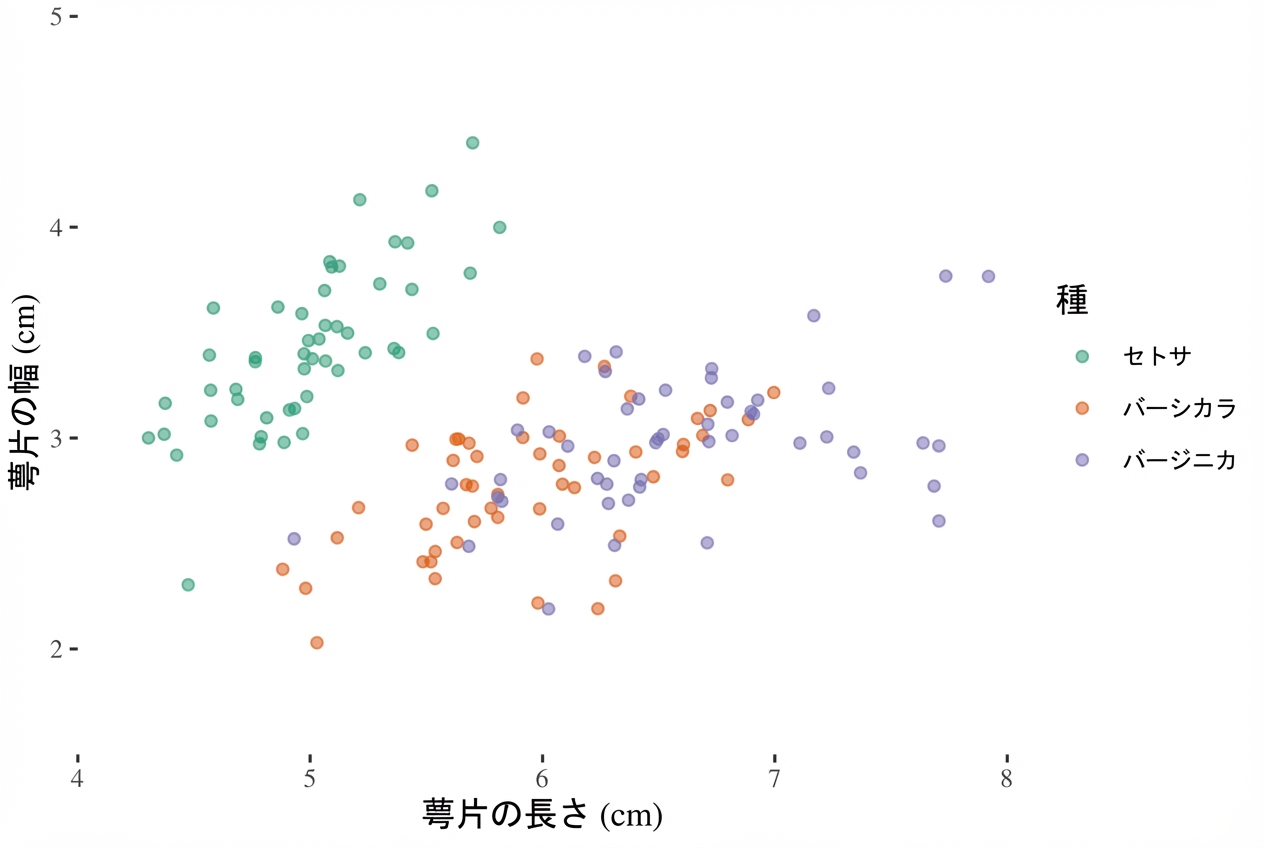
より多くの関数には ggthemes パッケージを使います。

library(ggthemes)
z + 
  theme_tufte()
ggplot2 で始めるデータ可視化入門

テーマの使い方

  1. ゼロから作成(前の動画)
  2. テーマレイヤーオブジェクト
  3. 組み込みテーマ
    • ggplot2 または ggthemes パッケージ
  4. 他パッケージの組み込みテーマ
  5. 既定テーマの更新/設定
ggplot2 で始めるデータ可視化入門

テーマの更新

original <- theme_update(text = element_text(family = "serif", size = 14),
                         rect = element_blank(),
                         panel.grid = element_blank(),
                         title = element_text(color = "#8b0000"),
                         axis.line = element_line(color = "black"))
ggplot2 で始めるデータ可視化入門

テーマの更新

z

ggplot2 で始めるデータ可視化入門

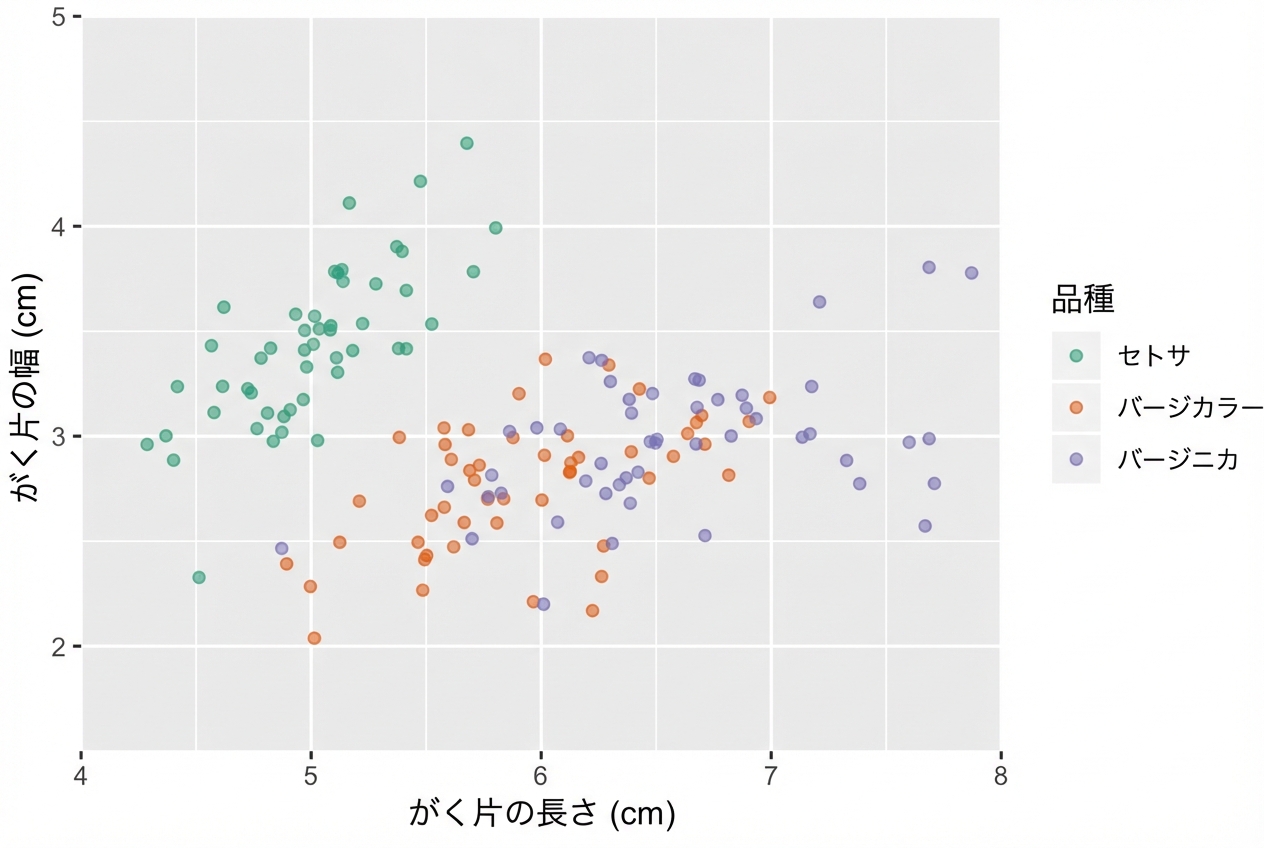
テーマの設定

theme_set(original)

# Alternatively
# theme_set(theme_grey())
ggplot2 で始めるデータ可視化入門

Passons à la pratique !

ggplot2 で始めるデータ可視化入門

Preparing Video For Download...