ggplot2 で始めるデータ可視化入門
Rick Scavetta
Founder, Scavetta Academy
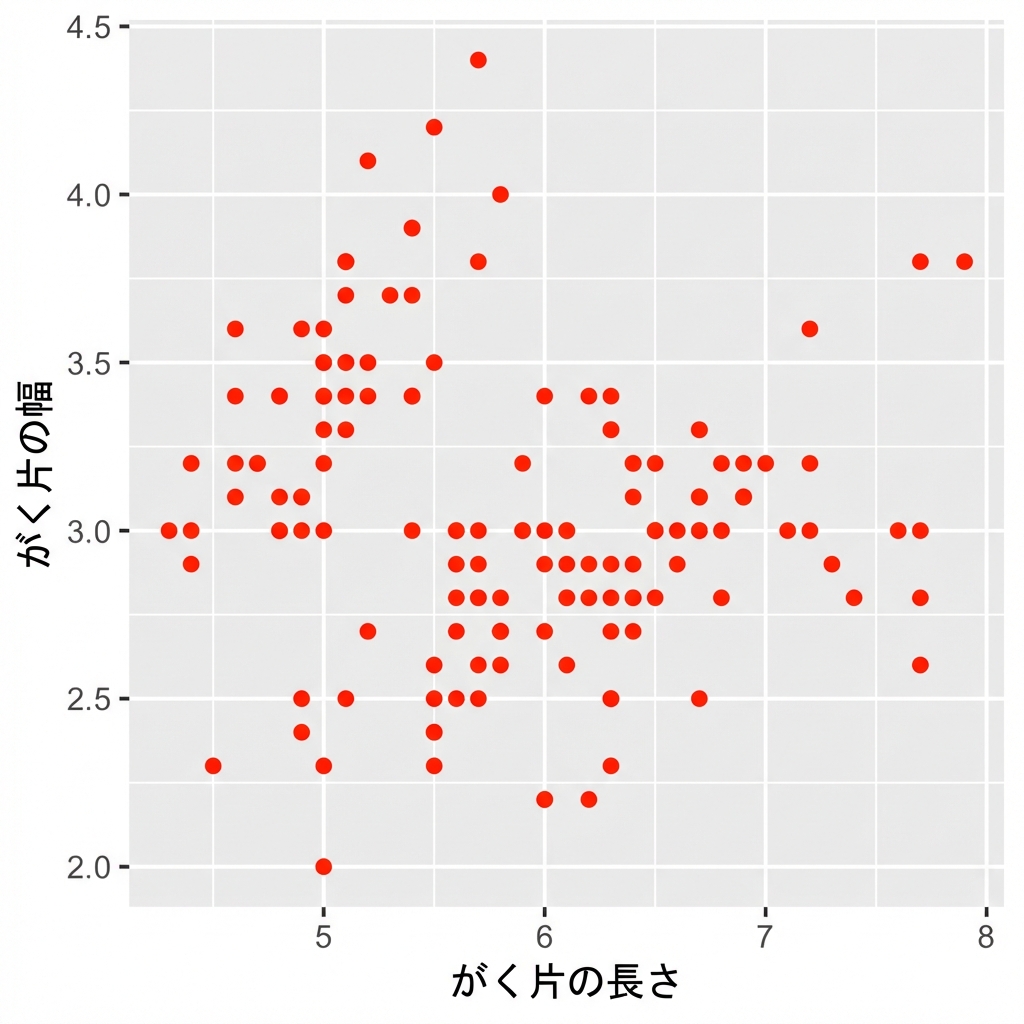
ggplot(iris, aes(x = Sepal.Length,
                 y = Sepal.Width)) +
  geom_point(color = "red")
属性は geom_*() で設定します。
geom_*()
color 属性は "red" に設定。
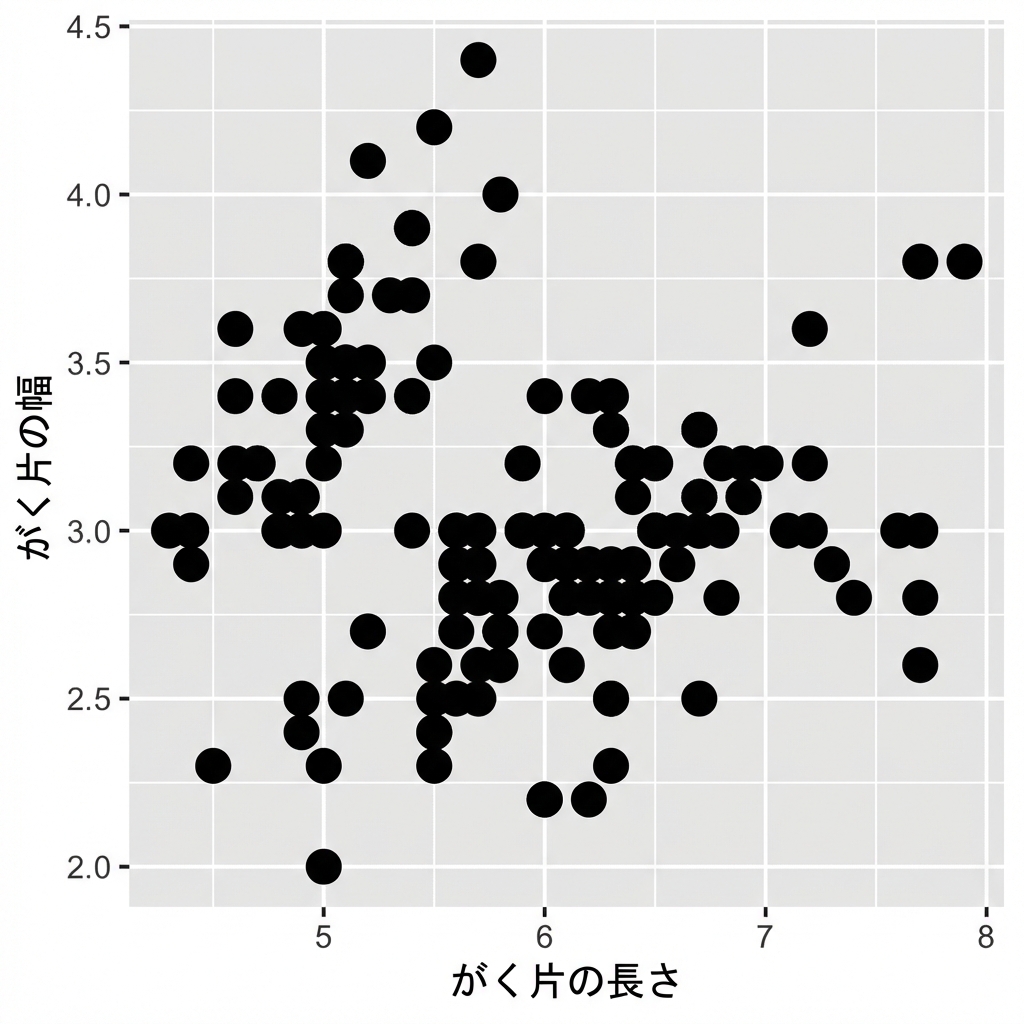
ggplot(iris, aes(x = Sepal.Length,
                 y = Sepal.Width)) +
  geom_point(size = 10)
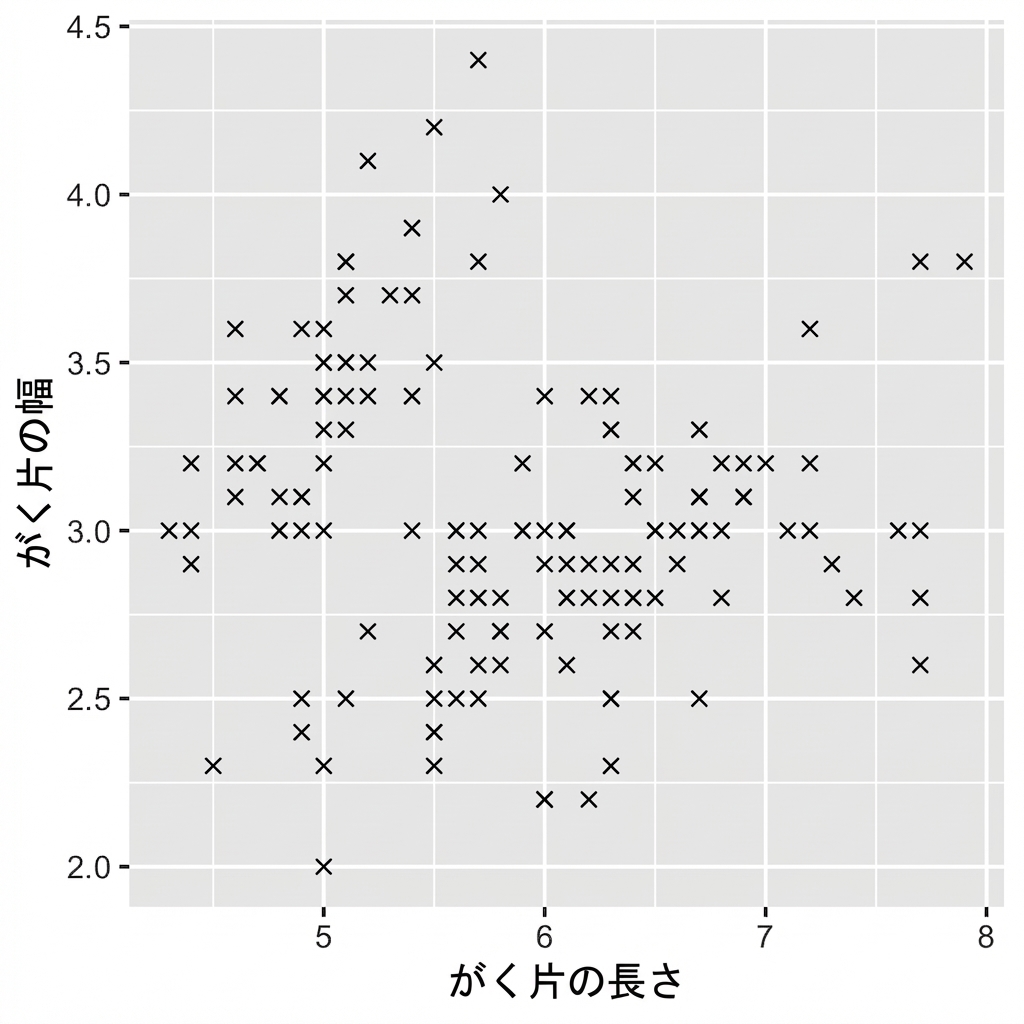
ggplot(iris, aes(x = Sepal.Length,
                 y = Sepal.Width)) +
  geom_point(shape = 4)