ggplot2 で始めるデータ可視化入門
Rick Scavetta
Founder, Scavetta Academy
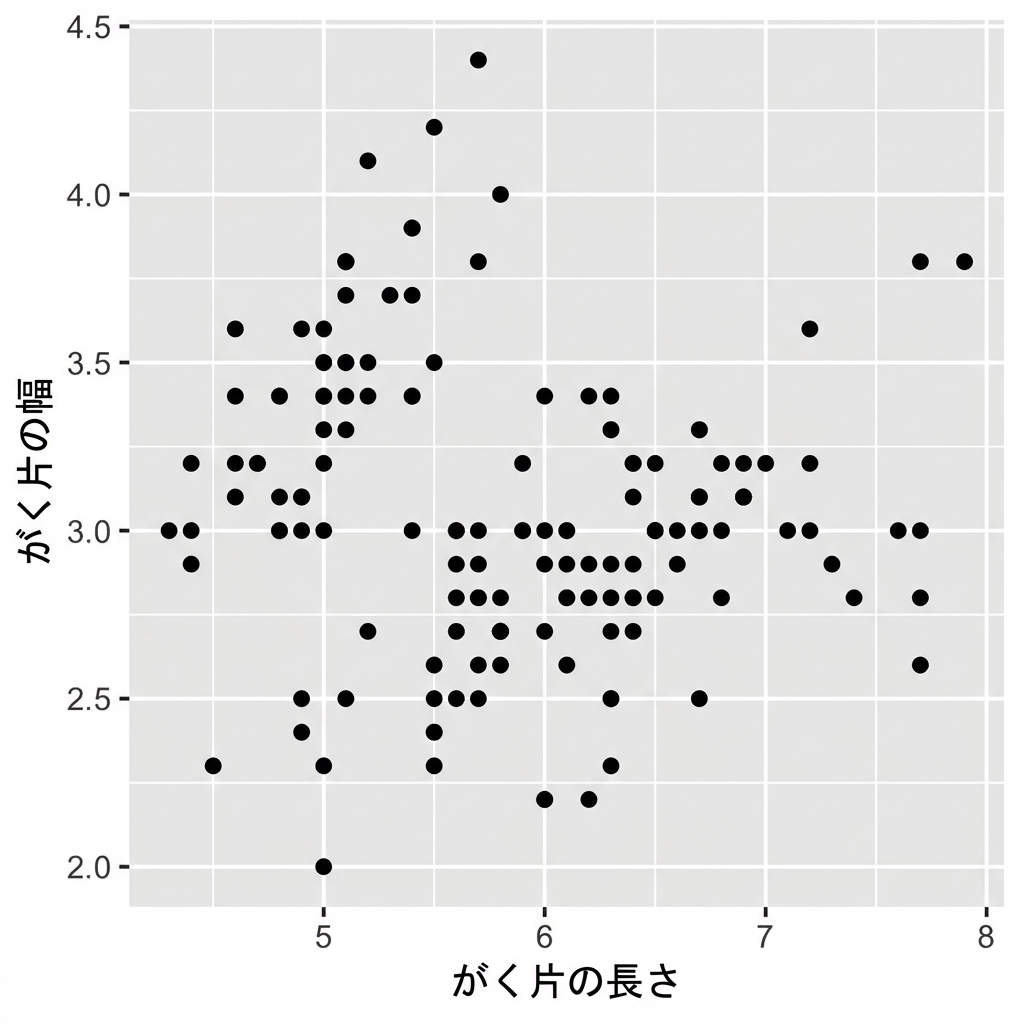
ggplot(iris, aes(x = Sepal.Length,
y = Sepal.Width)) +
geom_point()

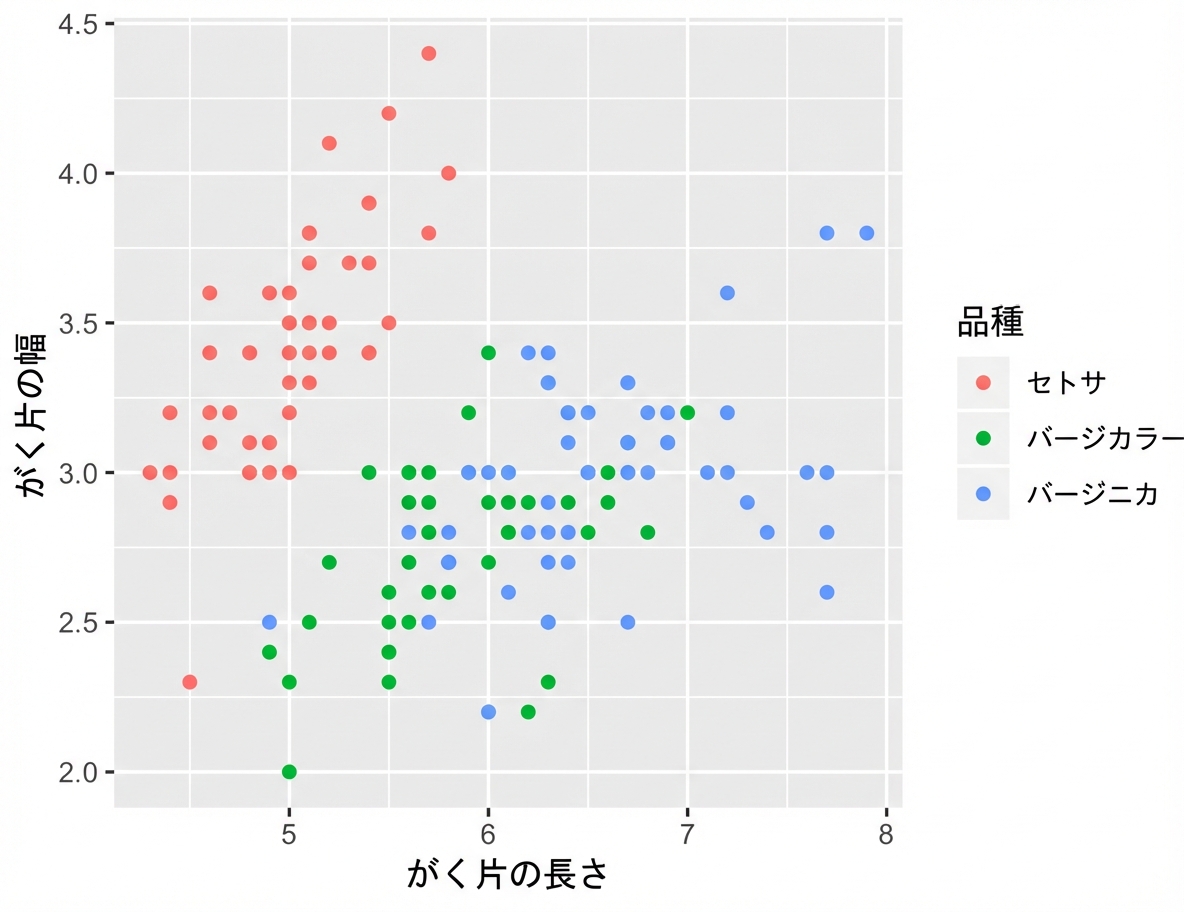
ggplot(iris, aes(x = Sepal.Length,
y = Sepal.Width,
color = Species)) +
geom_point()
| Type | Variable |
|---|---|
| Color | Species |

ggplot(iris, aes(x = Sepal.Length,
y = Sepal.Width,
color = Species)) +
geom_point()
| Type | Variable |
|---|---|
| Color | Species |
Species(データフレーム列)を可視的な美的属性であるcolorに「マッピング」します。

ggplot(iris, aes(x = Sepal.Length,
y = Sepal.Width,
color = Species)) +
geom_point()
| Type | Variable |
|---|---|
| Color | Species |
Species(データフレーム列)を可視的な美的属性であるcolorに「マッピング」します。
aes()で美的属性をマッピングします。

ggplot(iris) +
geom_point(aes(x = Sepal.Length,
y = Sepal.Width,
col = Species))
次の場合のみ必要:

| Aesthetic | Description |
|---|---|
| x | X 軸の位置 |
| y | Y 軸の位置 |
| Aesthetic | Description |
|---|---|
| x | X 軸の位置 |
| y | Y 軸の位置 |
| fill | 塗りの色 |
| Aesthetic | Description |
|---|---|
| x | X 軸の位置 |
| y | Y 軸の位置 |
| fill | 塗りの色 |
| color | 点の色、他の geom の外枠 |
| Aesthetic | Description |
|---|---|
| x | X 軸の位置 |
| y | Y 軸の位置 |
| fill | 塗りの色 |
| color | 点の色、他の geom の外枠 |
| size | 点の面積または半径、線の太さ |
| Aesthetic | Description |
|---|---|
| x | X 軸の位置 |
| y | Y 軸の位置 |
| fill | 塗りの色 |
| color | 点の色、他の geom の外枠 |
| size | 点の面積または半径、線の太さ |
| Aesthetic | Description |
|---|---|
| alpha | 透過度 |
| Aesthetic | Description |
|---|---|
| x | X 軸の位置 |
| y | Y 軸の位置 |
| fill | 塗りの色 |
| color | 点の色、他の geom の外枠 |
| size | 点の面積または半径、線の太さ |
| Aesthetic | Description |
|---|---|
| alpha | 透過度 |
| linetype | 破線パターン |
| Aesthetic | Description |
|---|---|
| x | X 軸の位置 |
| y | Y 軸の位置 |
| fill | 塗りの色 |
| color | 点の色、他の geom の外枠 |
| size | 点の面積または半径、線の太さ |
| Aesthetic | Description |
|---|---|
| alpha | 透過度 |
| linetype | 破線パターン |
| labels | プロットや軸のテキスト |
| Aesthetic | Description |
|---|---|
| x | X 軸の位置 |
| y | Y 軸の位置 |
| fill | 塗りの色 |
| color | 点の色、他の geom の外枠 |
| size | 点の面積または半径、線の太さ |
| Aesthetic | Description |
|---|---|
| alpha | 透過度 |
| linetype | 破線パターン |
| labels | プロットや軸のテキスト |
| shape | 形状 |
ggplot2 で始めるデータ可視化入門