導入

ggplot2 で始めるデータ可視化入門

Rick Scavetta

Founder, Scavetta Academy

担当講師 - Rick Scavetta

- e-mail: [email protected]
- Twitter: @Rick_Scavetta
ggplot2 で始めるデータ可視化入門

データ可視化とデータサイエンス

  • データサイエンスの中核スキル。

ggplot2 で始めるデータ可視化入門

探索と説明

ggplot2 で始めるデータ可視化入門

MASS::mammals

MASS::mammals
                              body   brain
Arctic fox                   3.385   44.50
Owl monkey                   0.480   15.50
Mountain beaver              1.350    8.10
Cow                        465.000  423.00
Grey wolf                   36.330  119.50
Goat                        27.660  115.00
Roe deer                    14.830   98.20
...
Pig                        192.000  180.00
Echidna                      3.000   25.00
Brazilian tapir            160.000  169.00
Tenrec                       0.900    2.60
Phalanger                    1.620   11.40
Tree shrew                   0.104    2.50
Red fox                      4.235   50.40
ggplot2 で始めるデータ可視化入門

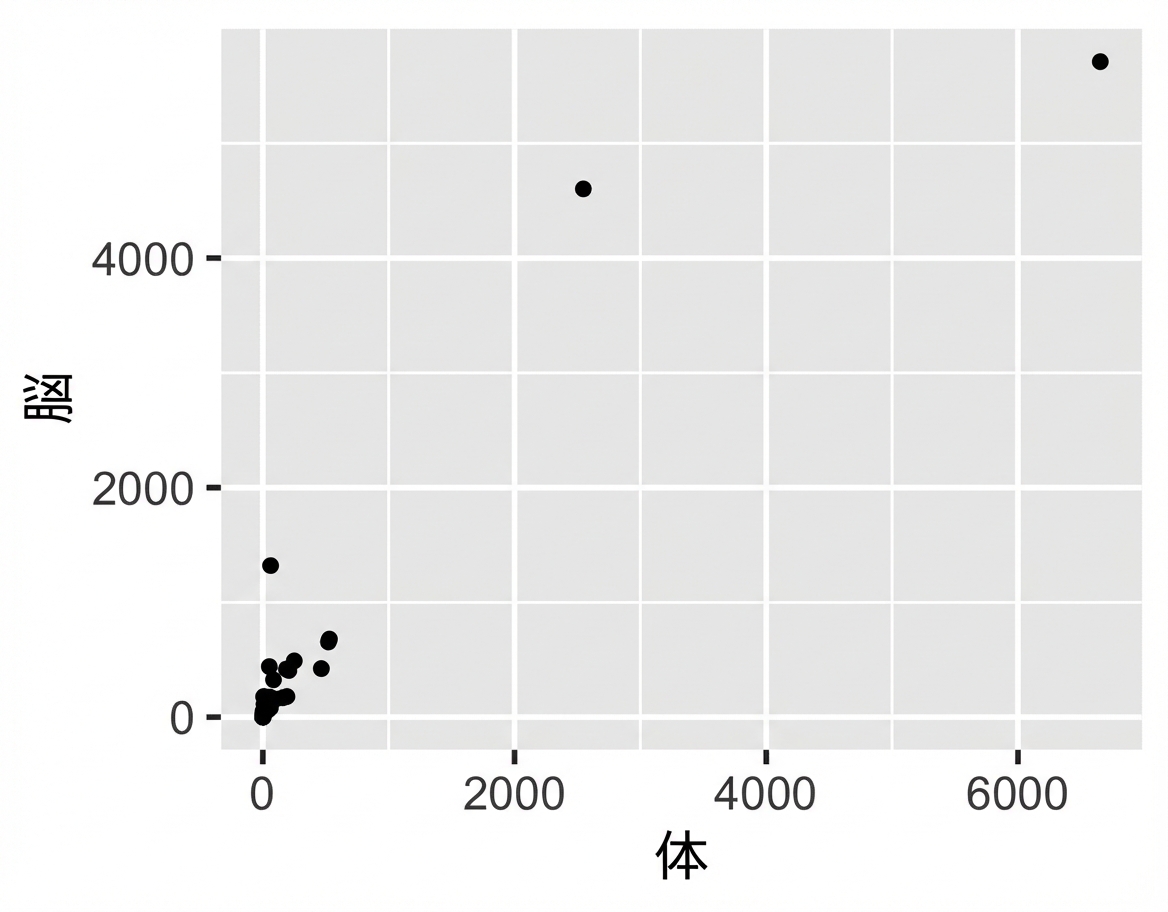
散布図

ggplot(mammals, aes(x = body, y = brain)) +
  geom_point()

1.1.1-1.png

ggplot2 で始めるデータ可視化入門

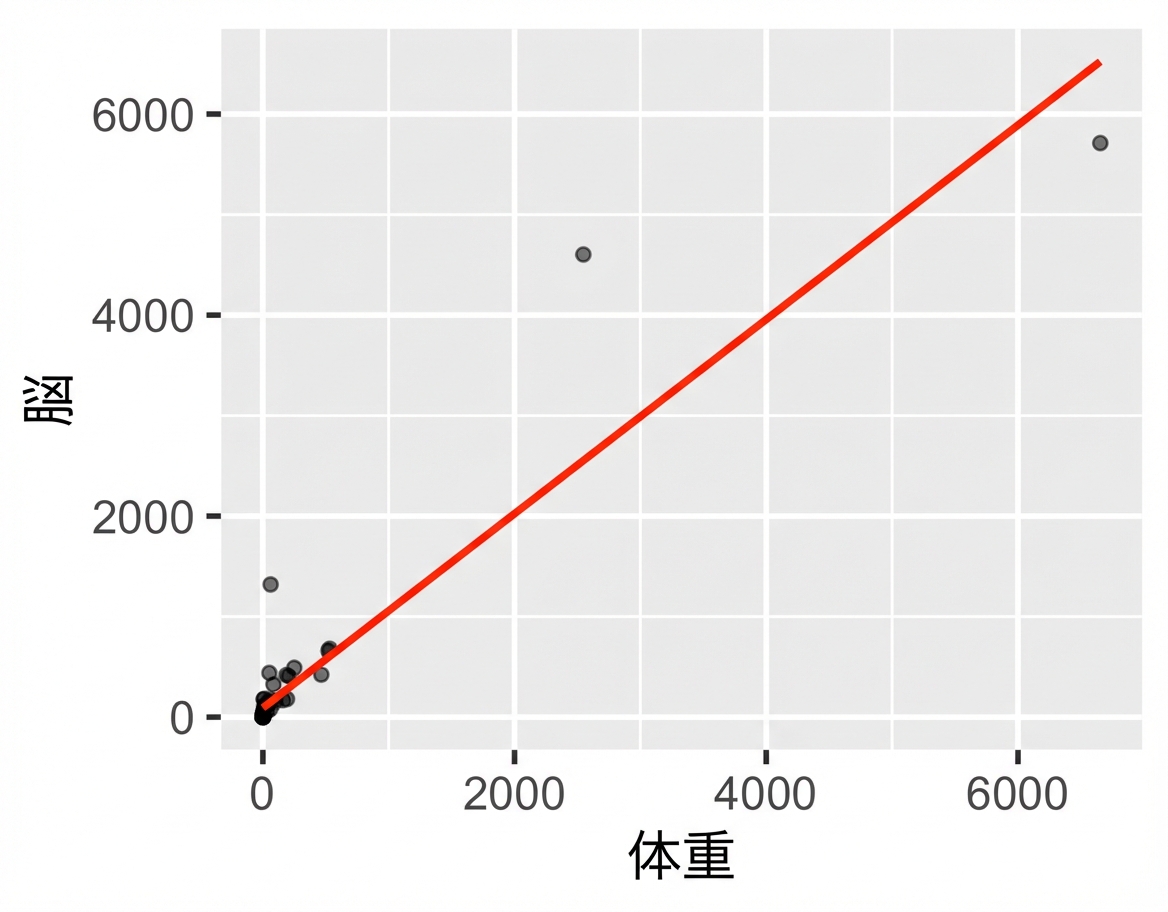
線形モデルで探索

ggplot(mammals, aes(x = body, y = brain)) +
  geom_point(alpha = 0.6) +
  stat_smooth(
    method = "lm", 
    color = "red", 
    se = FALSE
  )

1.1.1-2.png

ggplot2 で始めるデータ可視化入門

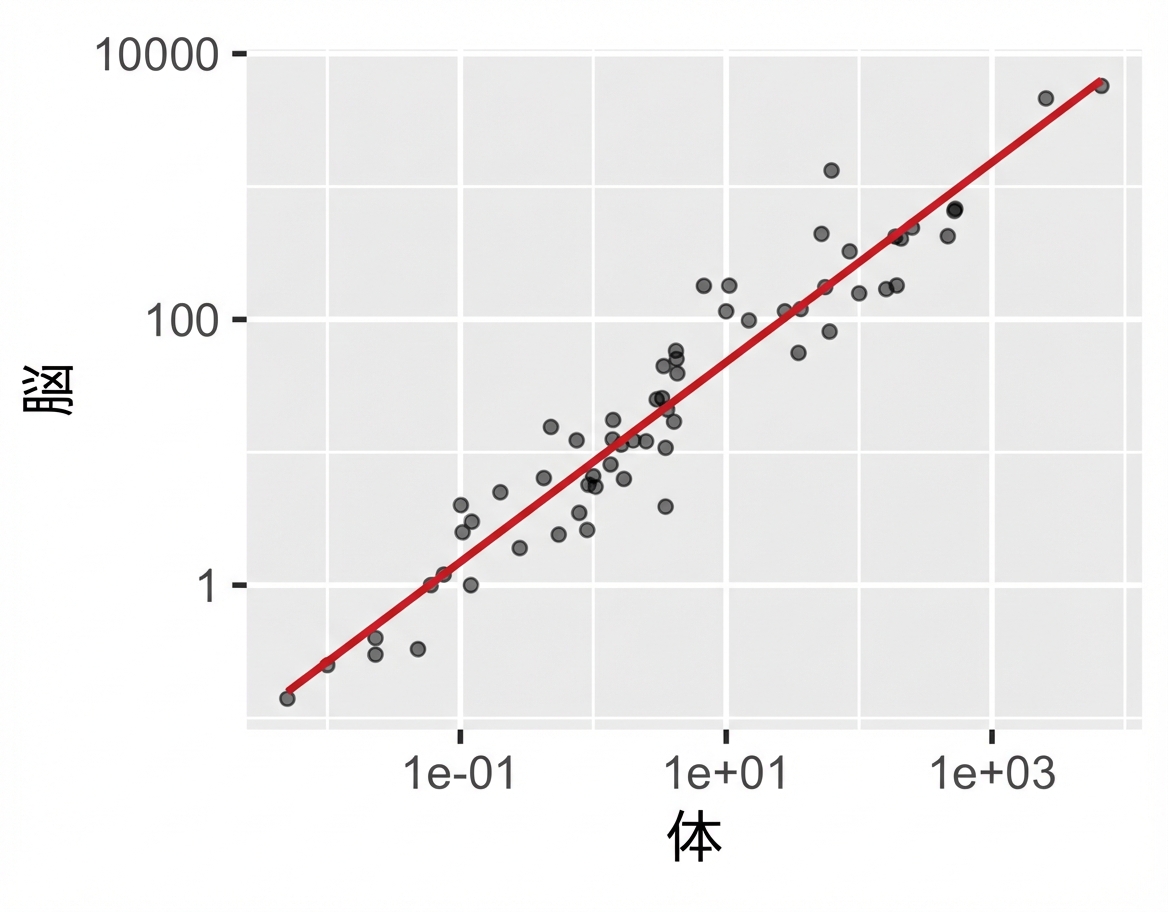
探索:微調整

ggplot(mammals, aes(x = body, y = brain)) +
  geom_point(alpha = 0.6) +
  coord_fixed() +
  scale_x_log10() +
  scale_y_log10() +
  stat_smooth(
    method = "lm", 
    color = "#C42126", 
    se = FALSE, 
    size = 1
  )

1.1.1-3.png

ggplot2 で始めるデータ可視化入門

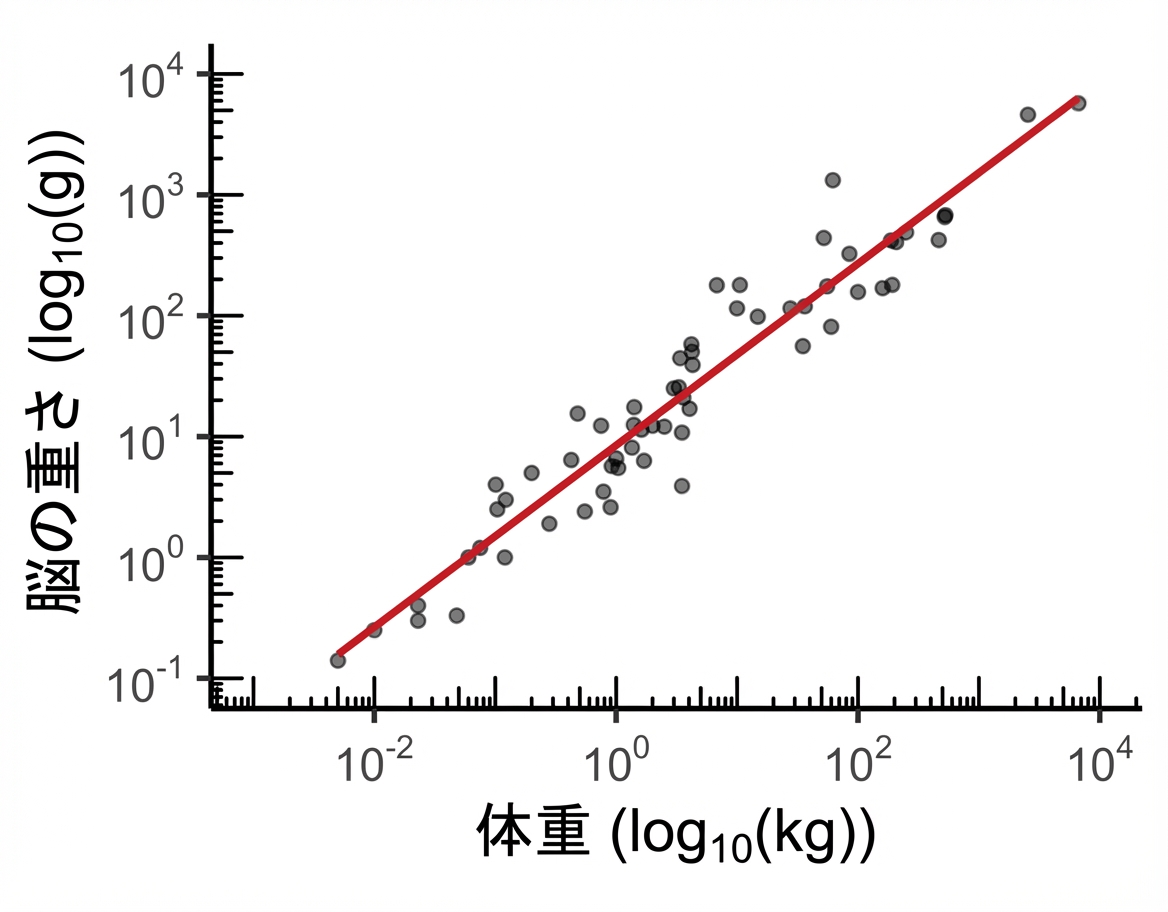
出版レベルのプロット

出版レベルのプロット

ggplot2 で始めるデータ可視化入門

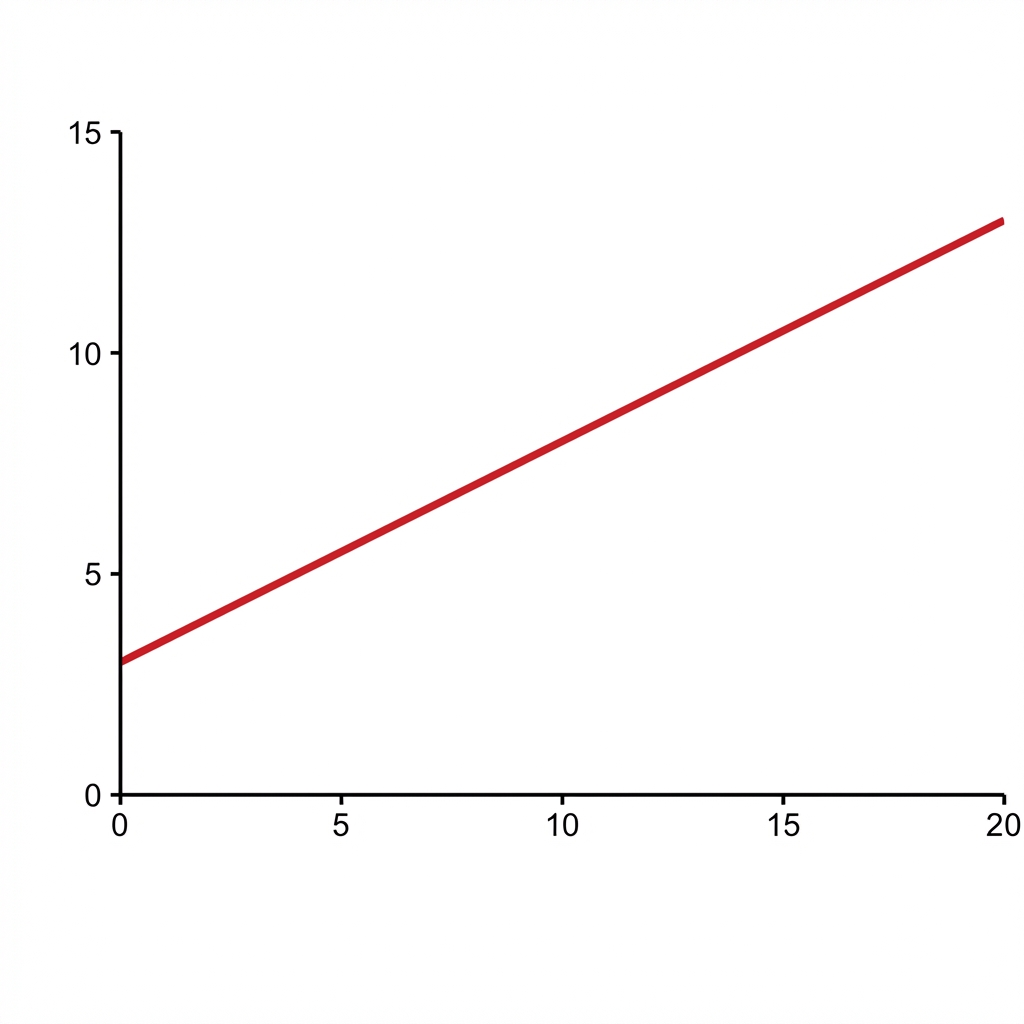
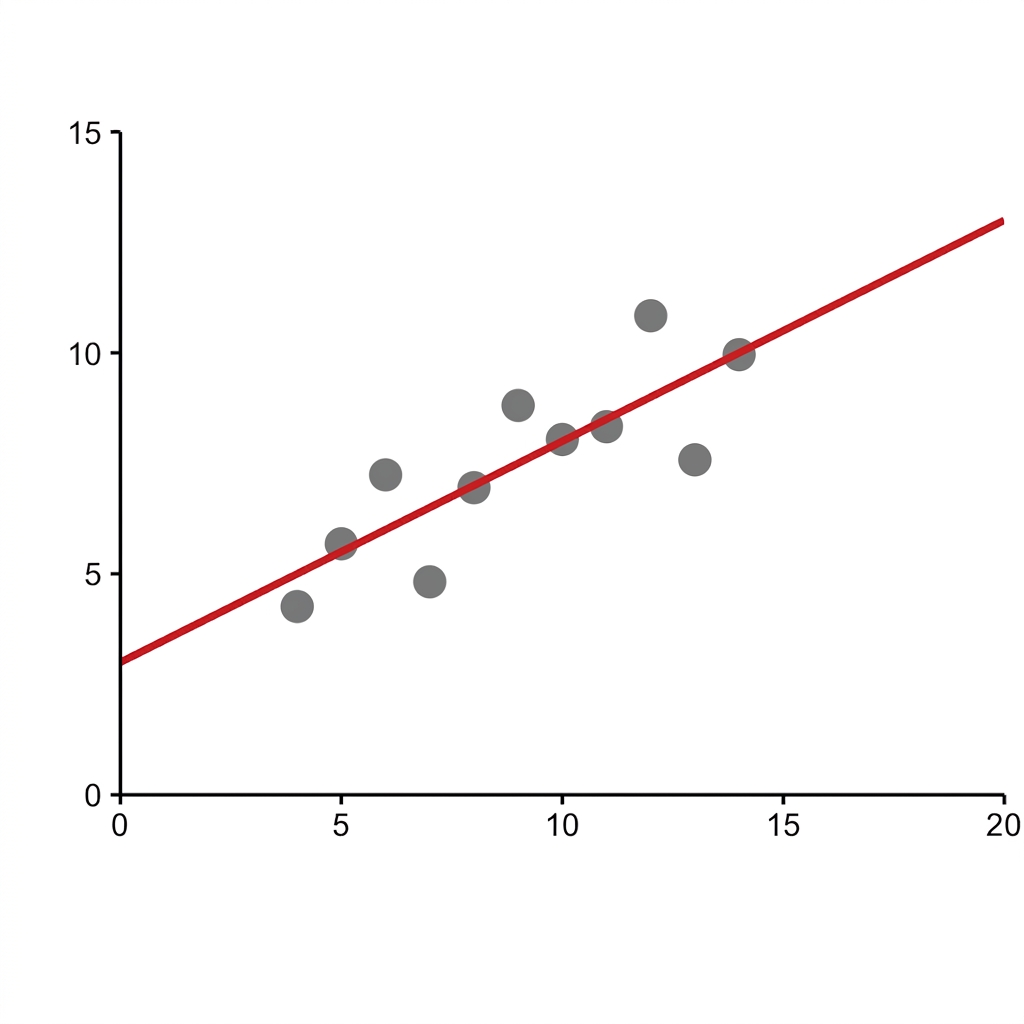
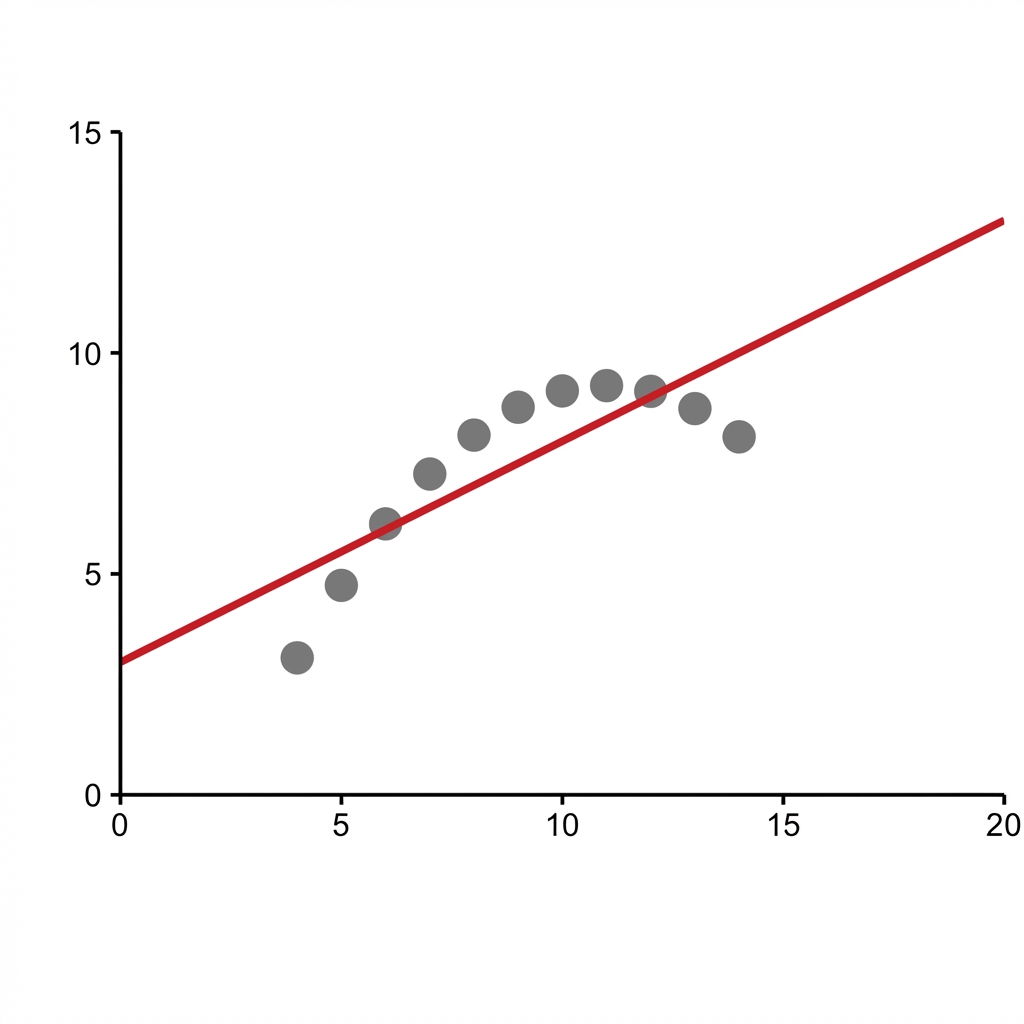
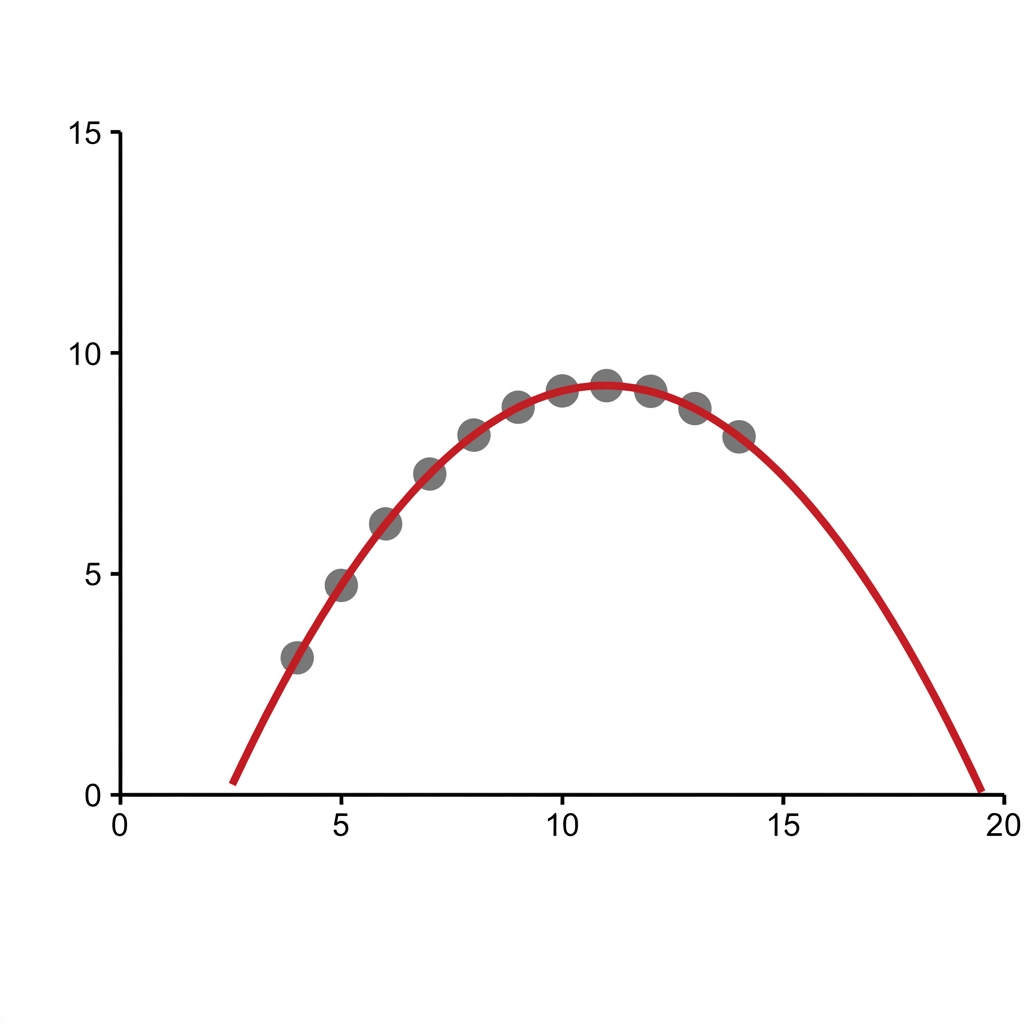
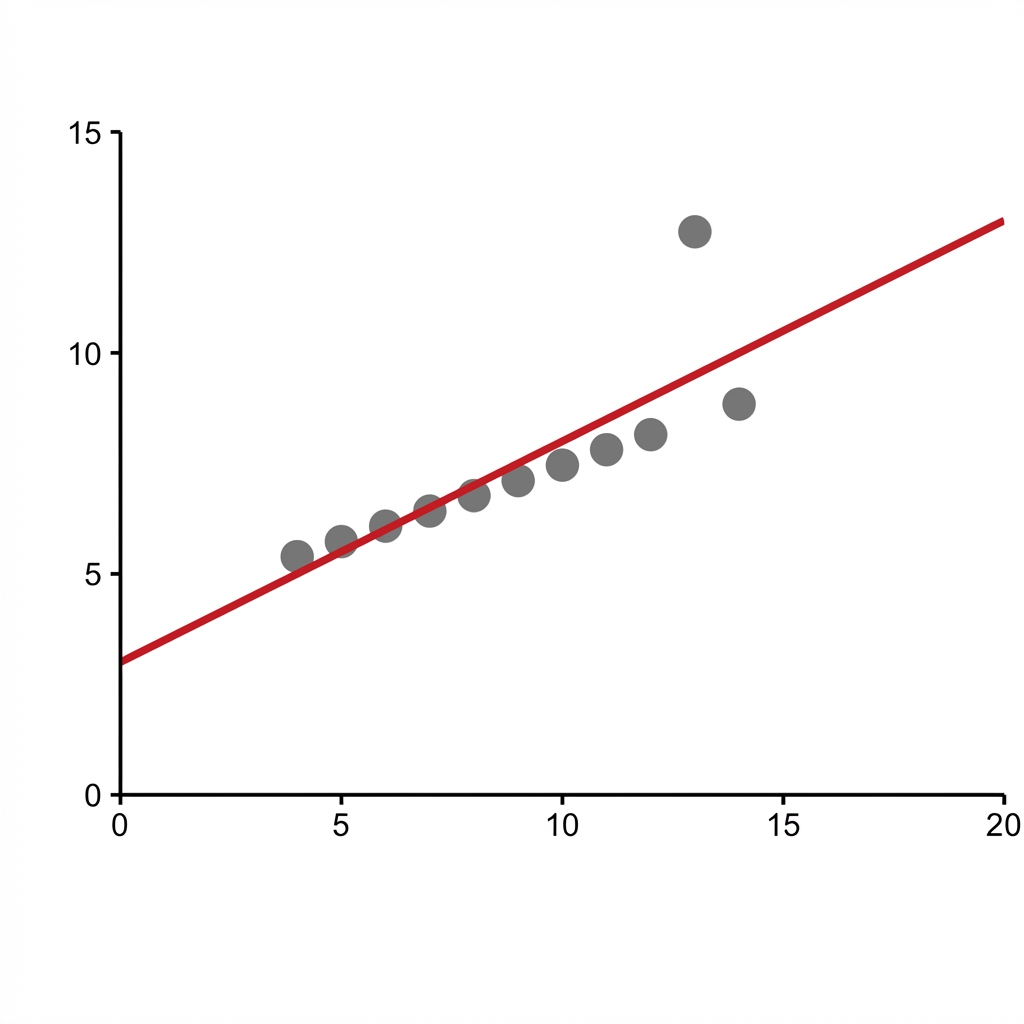
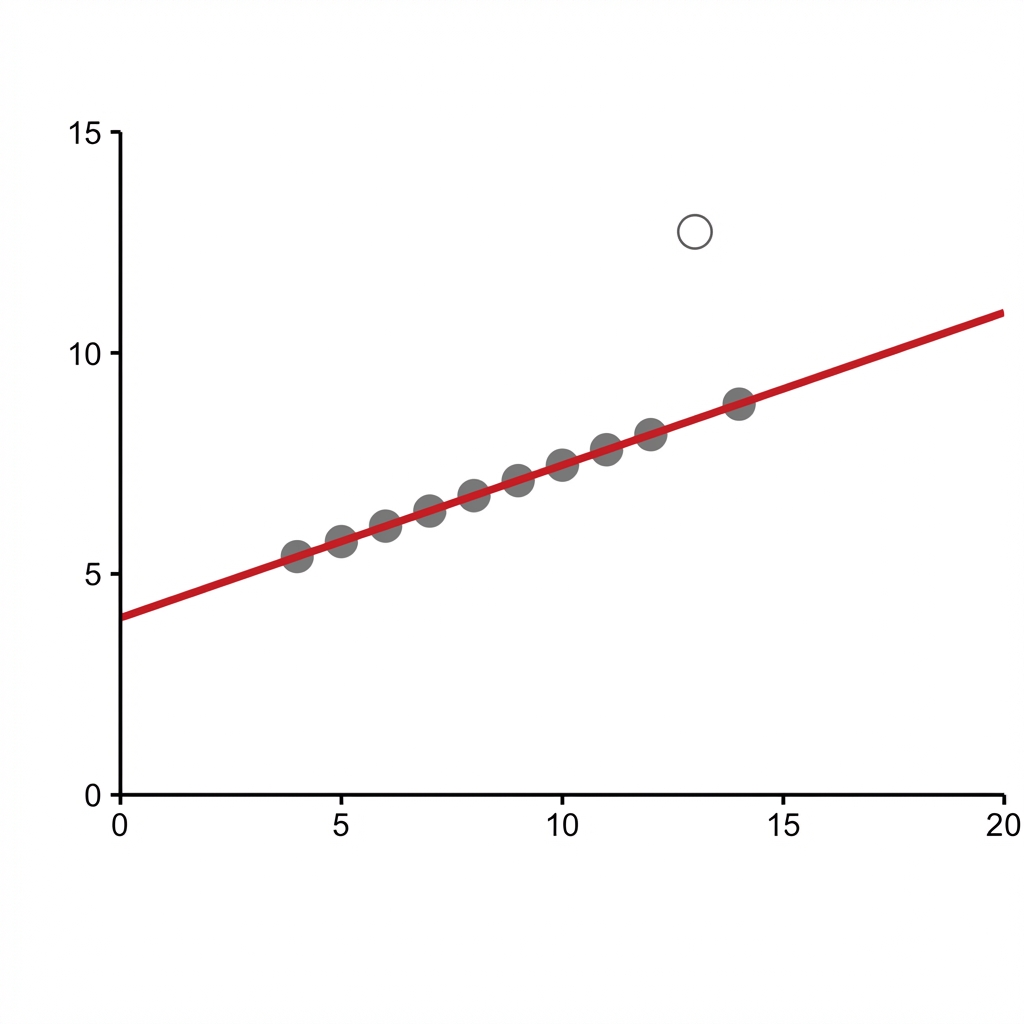
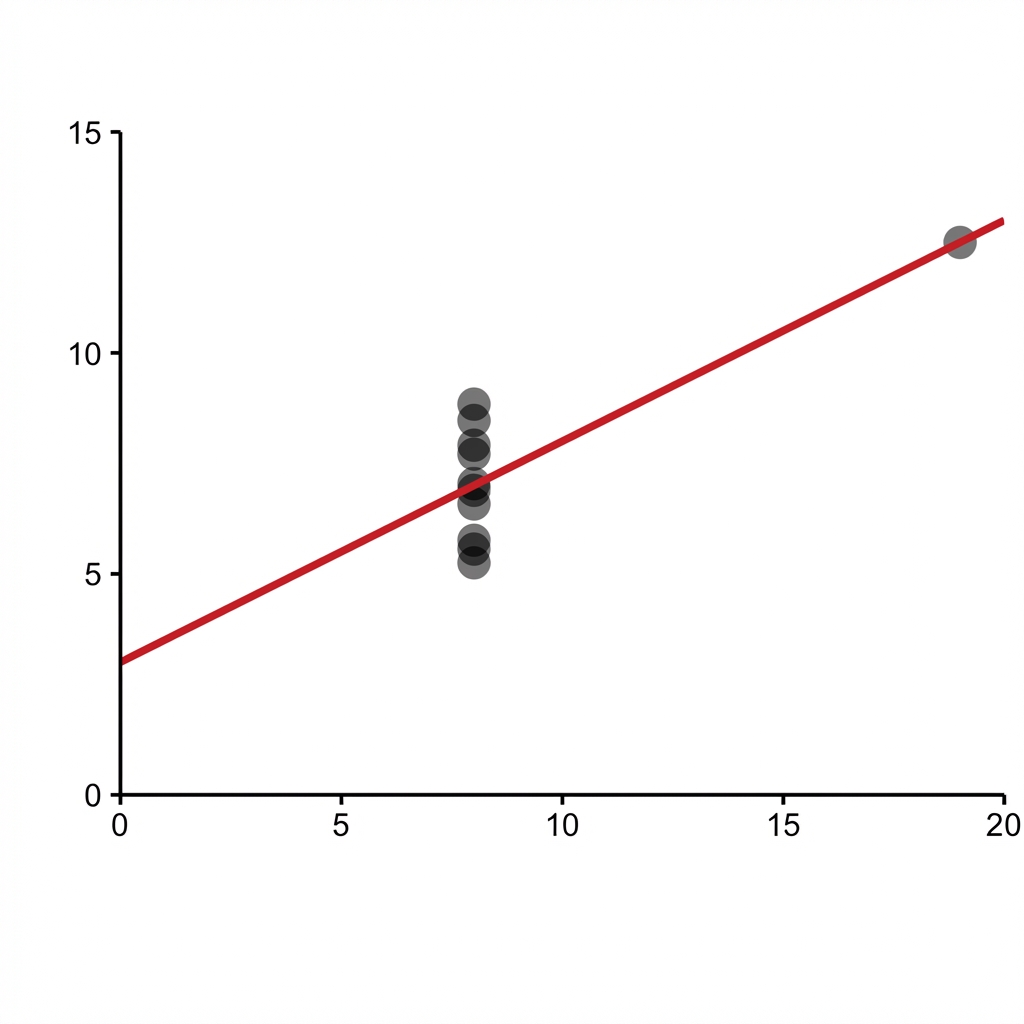
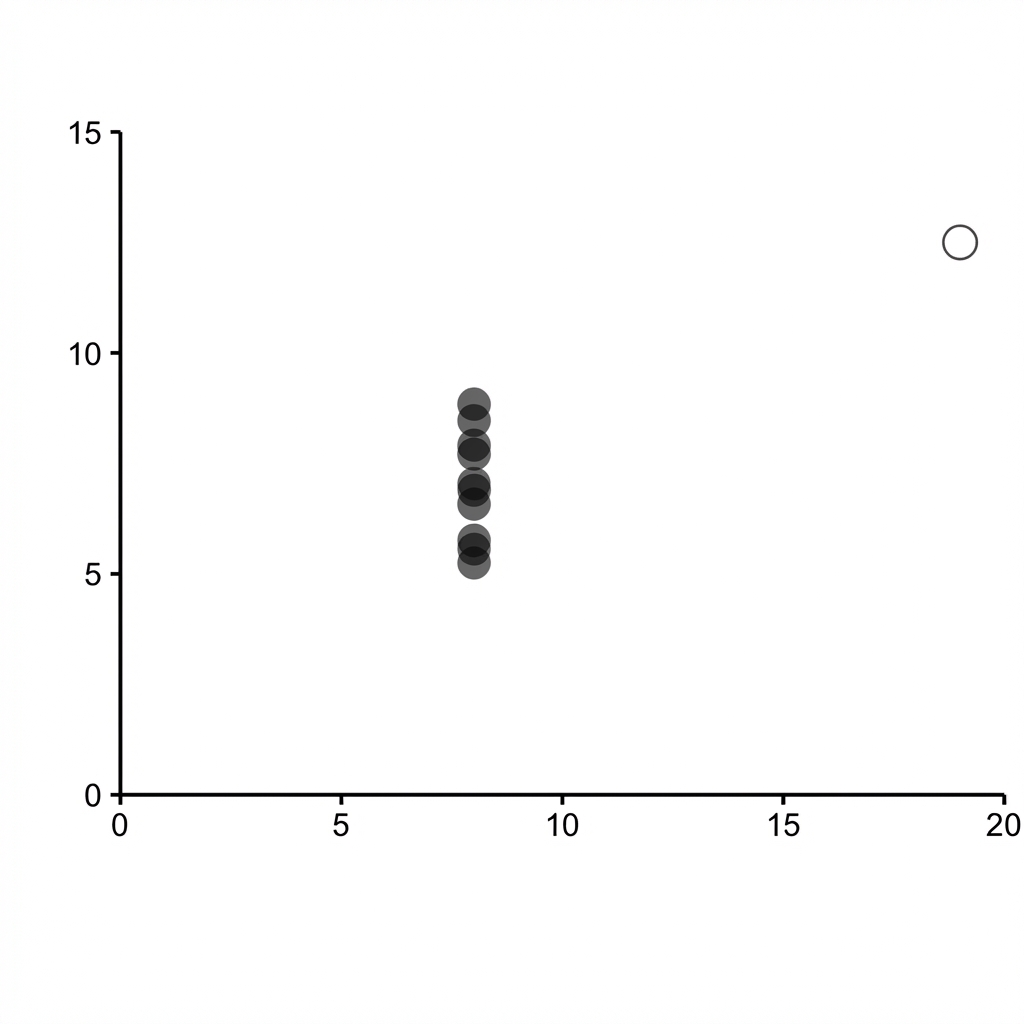
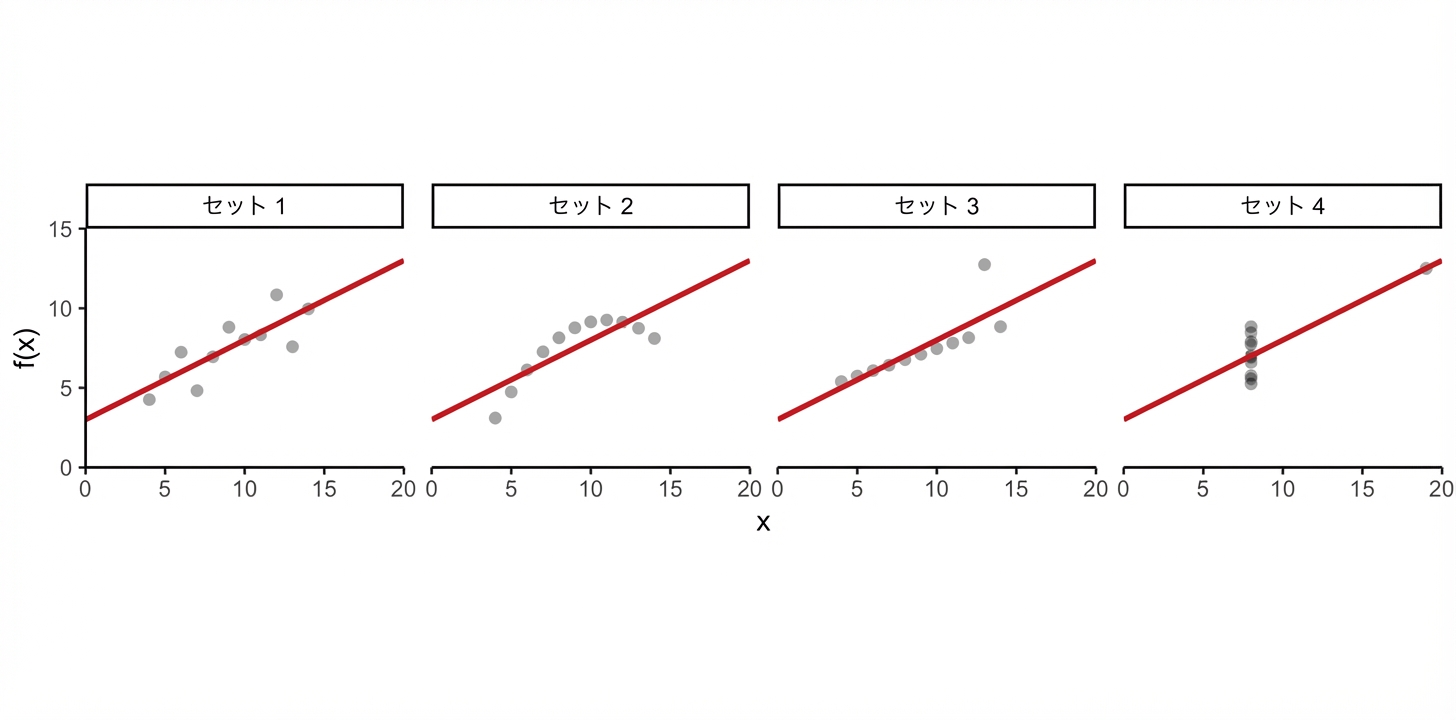
アンスコムの図

ggplot2 で始めるデータ可視化入門

アンスコムの図

ggplot2 で始めるデータ可視化入門

アンスコムの図

ggplot2 で始めるデータ可視化入門

アンスコムの図

ggplot2 で始めるデータ可視化入門

アンスコムの図

ggplot2 で始めるデータ可視化入門

アンスコムの図

ggplot2 で始めるデータ可視化入門

アンスコムの図

ggplot2 で始めるデータ可視化入門

アンスコムの図

ggplot2 で始めるデータ可視化入門

アンスコムの図

ggplot2 で始めるデータ可視化入門

演習に進みましょう!

ggplot2 で始めるデータ可視化入門

Preparing Video For Download...