美的要素のベストプラクティス
ggplot2 で始めるデータ可視化入門

Rick Scavetta
Founder, Scavetta Academy
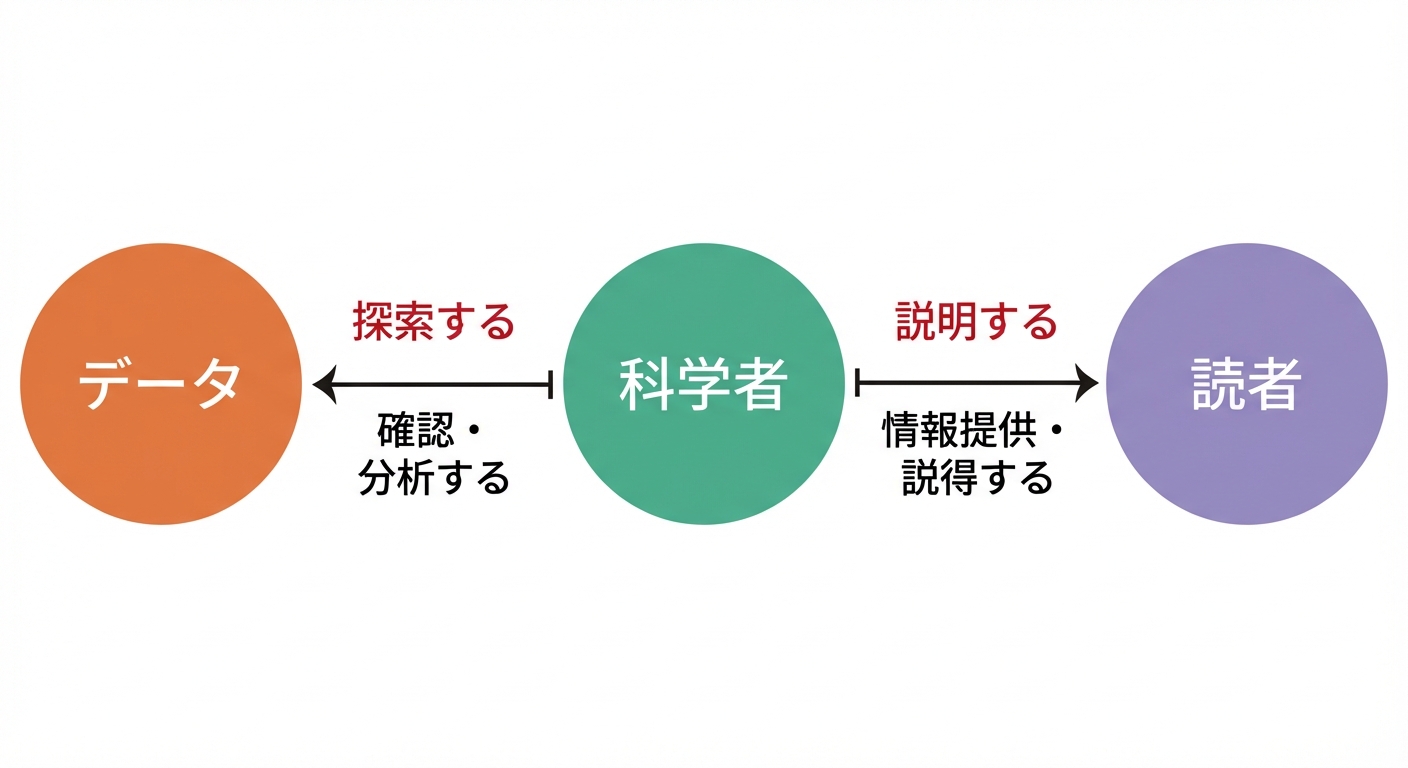
形は機能に従う
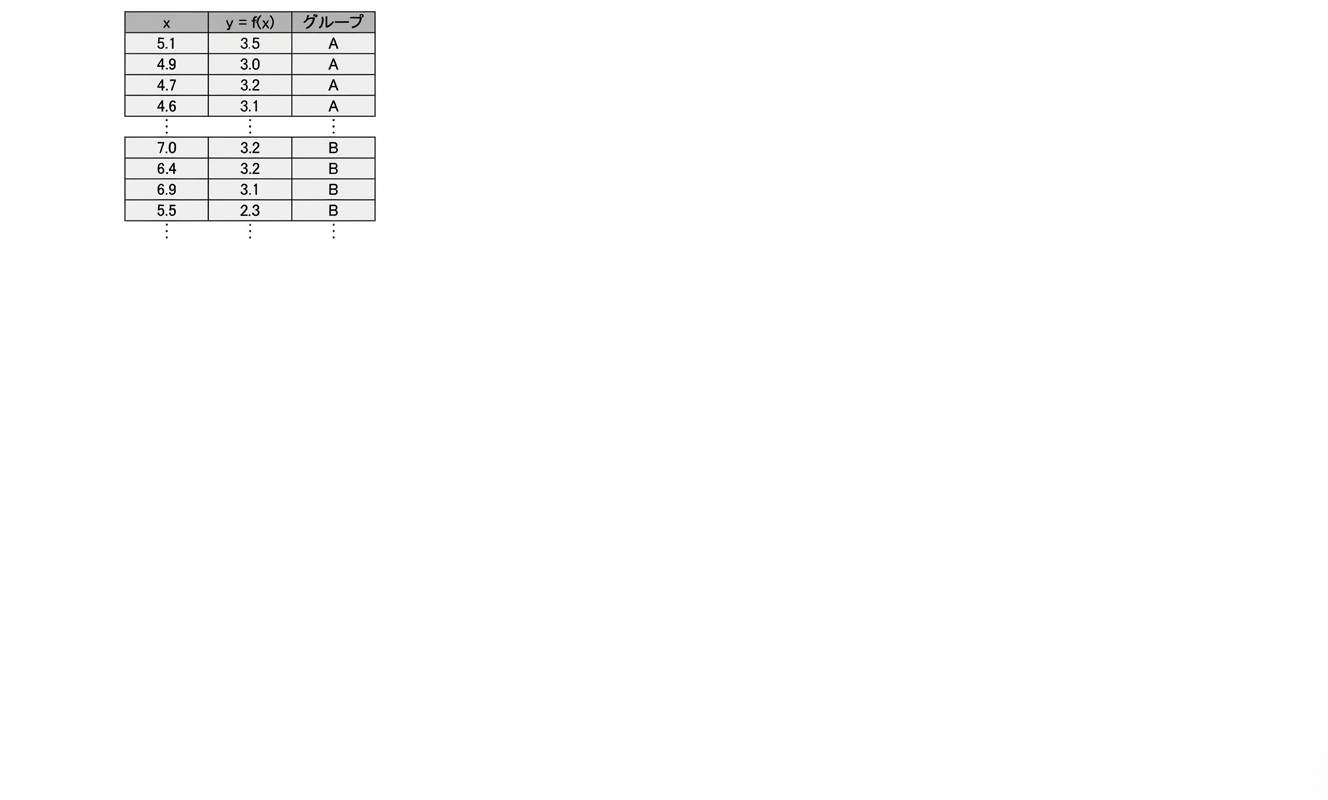
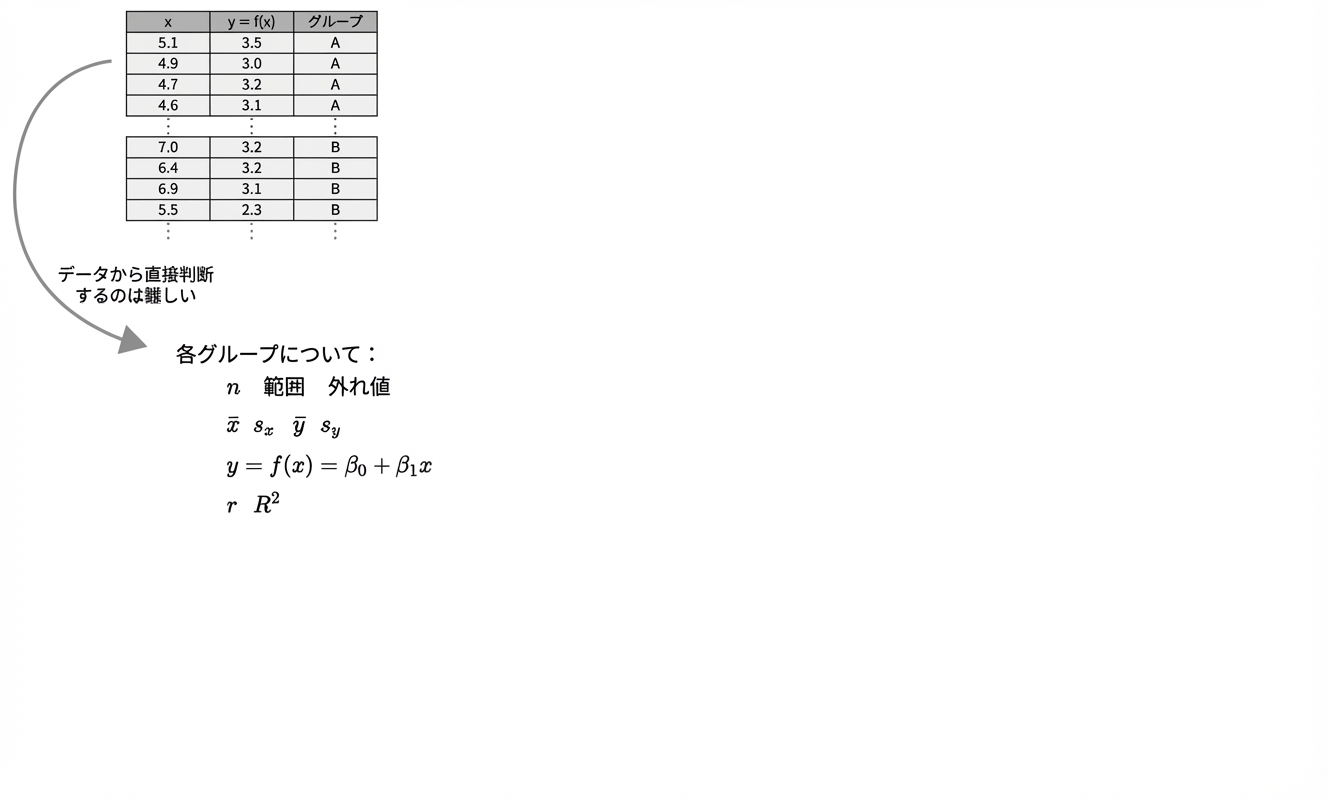
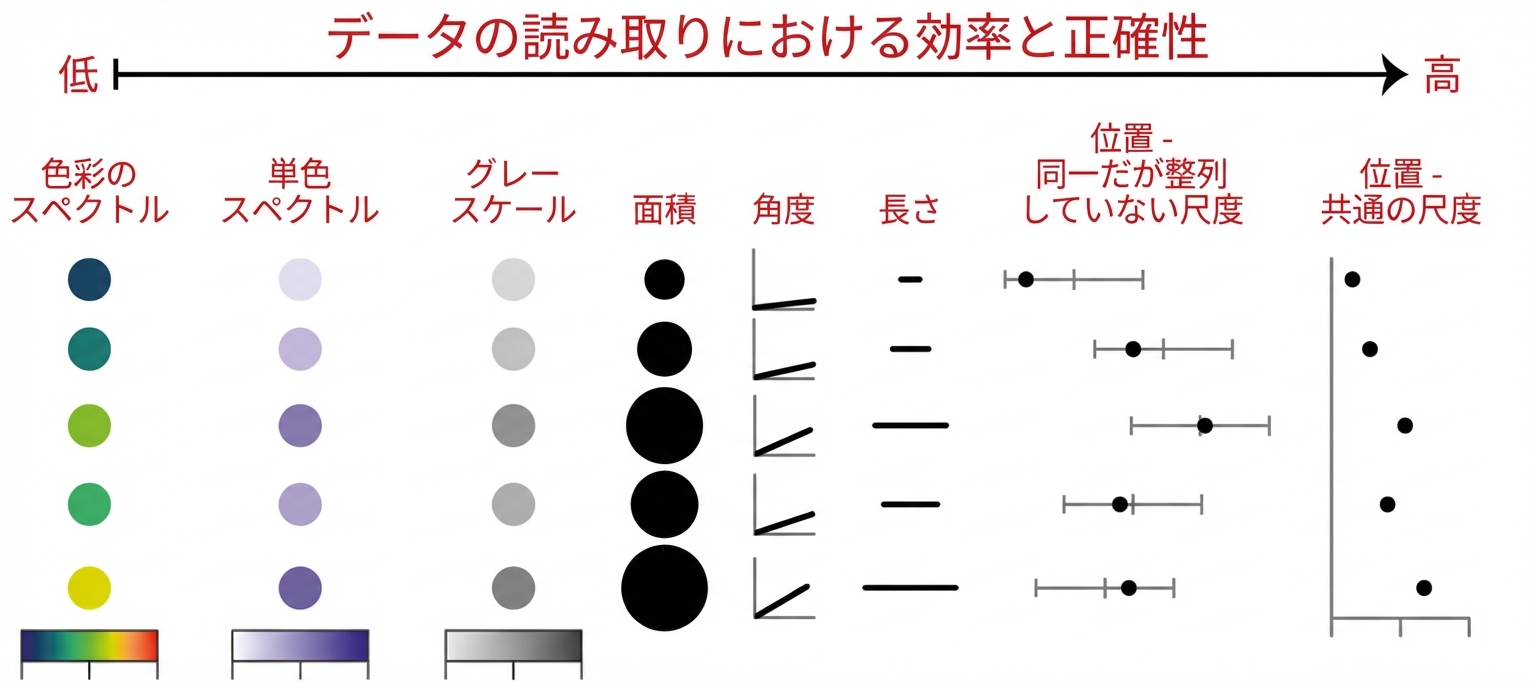
データから情報を抽出する

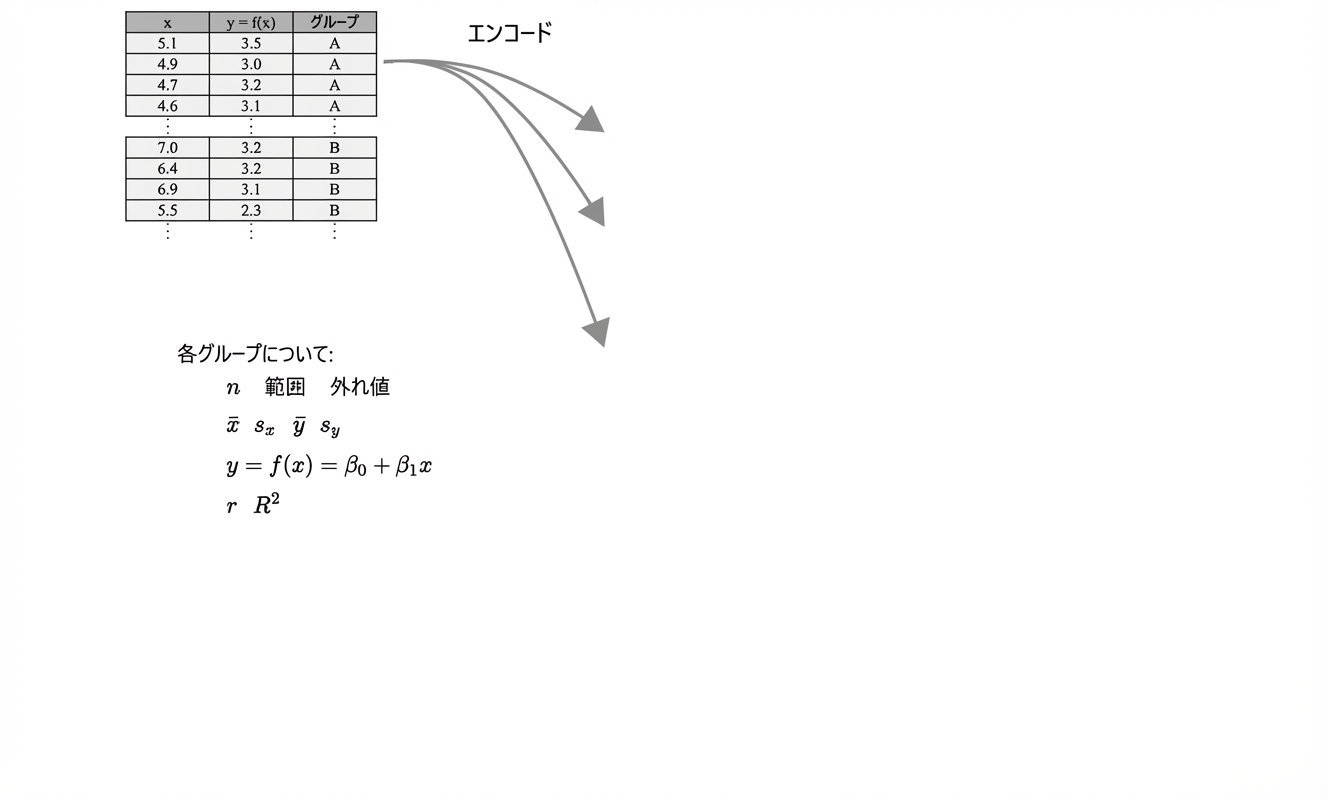
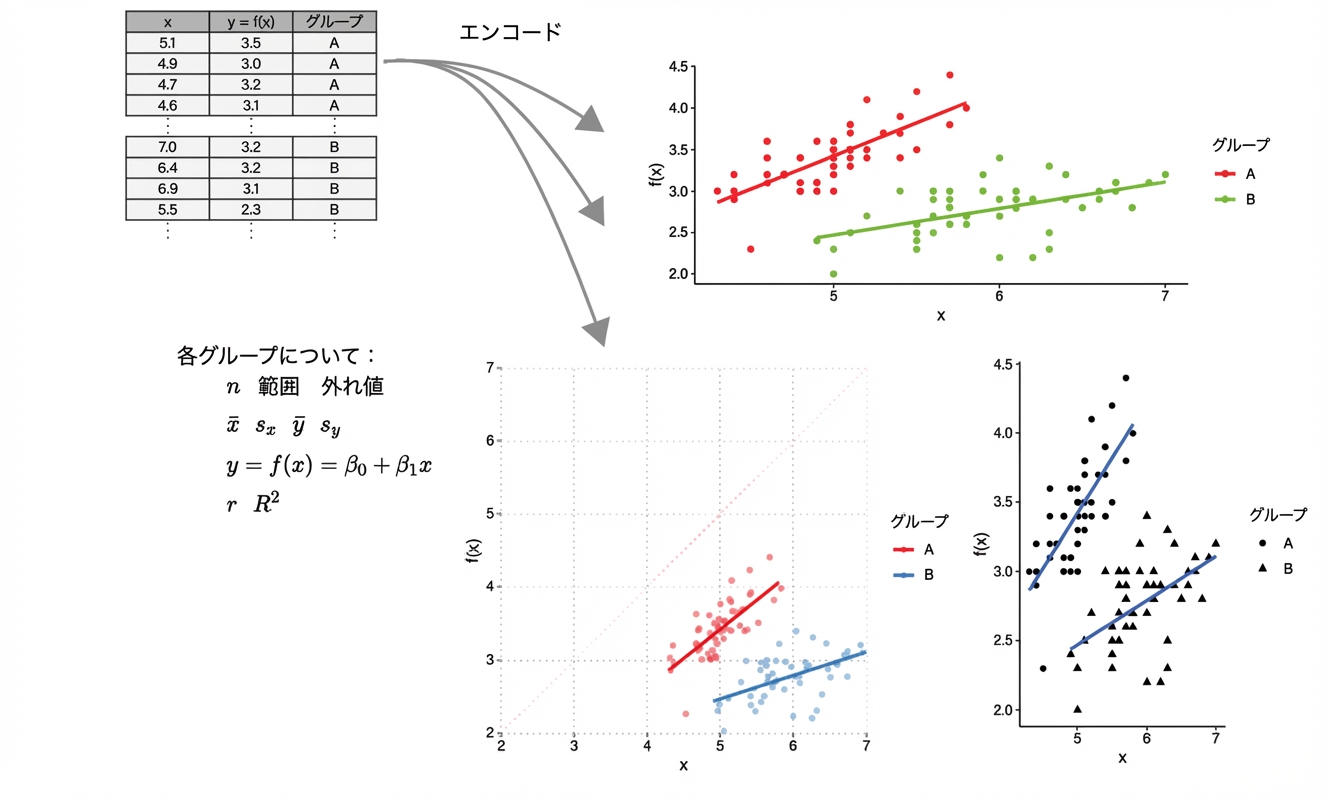
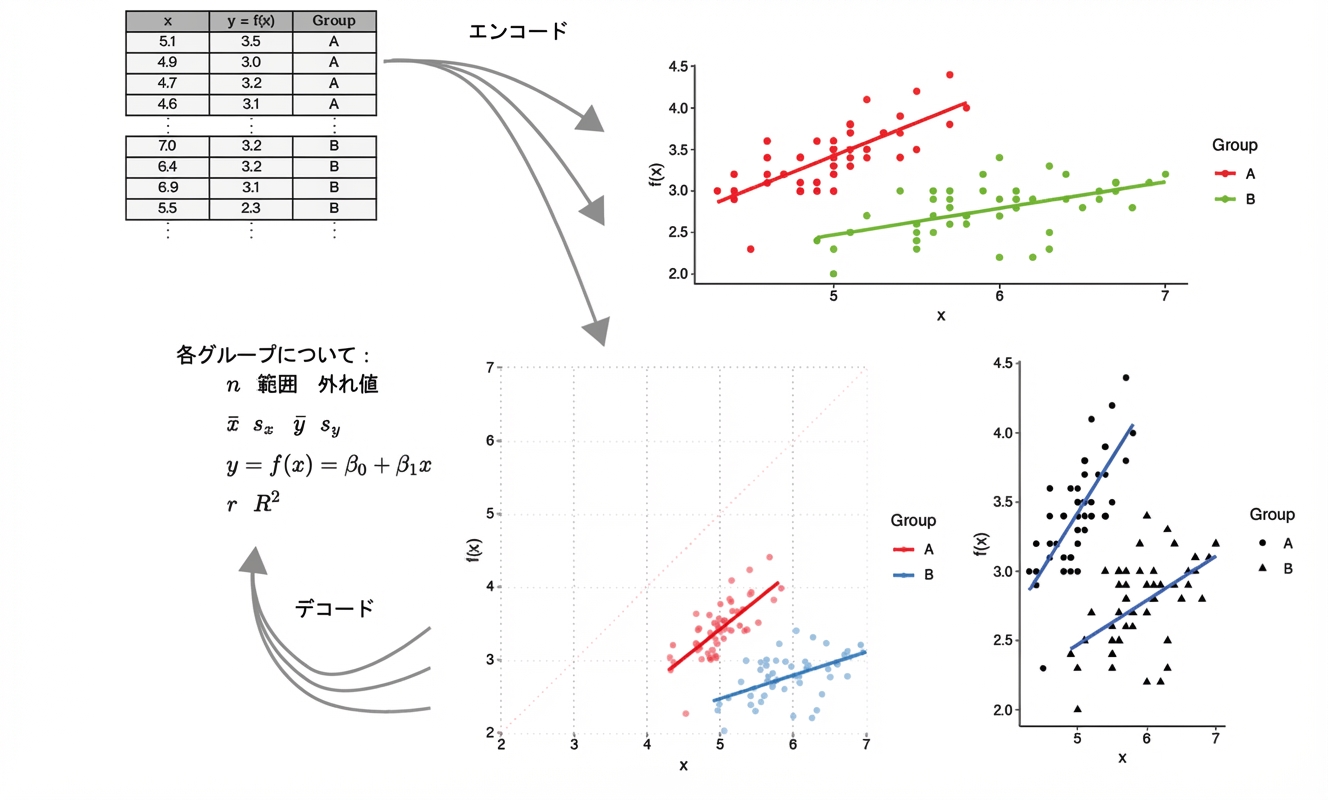
美的要素 - 連続変数
美的要素 - 連続変数
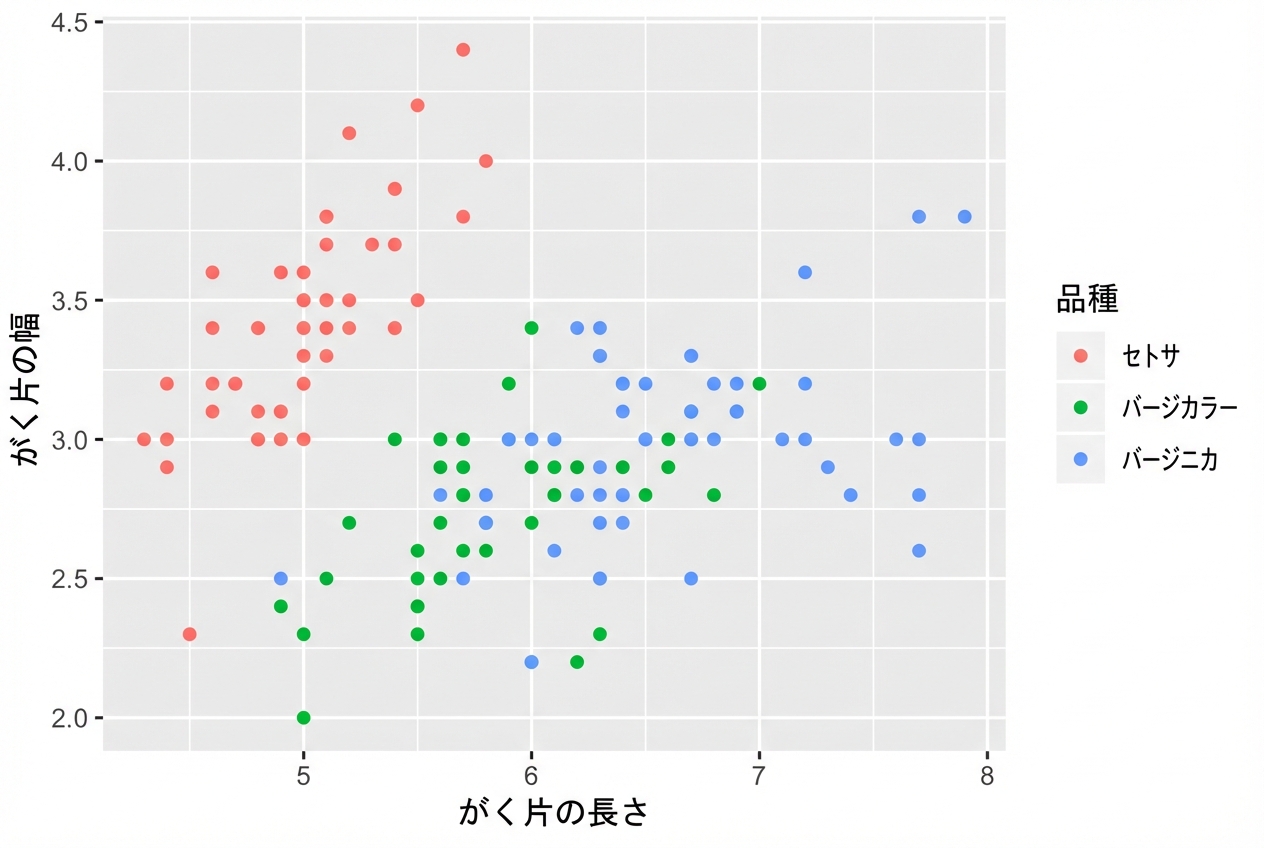
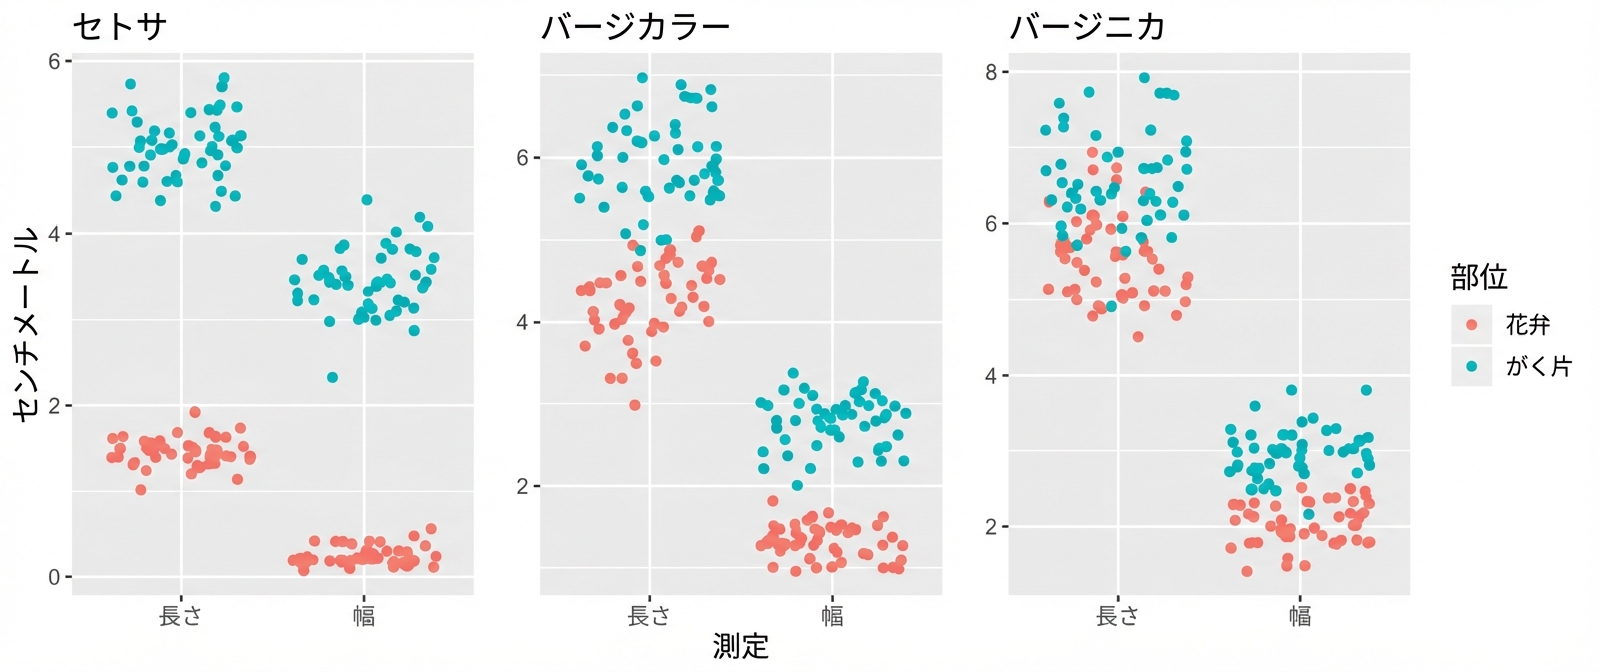
3つのアヤメ散布図
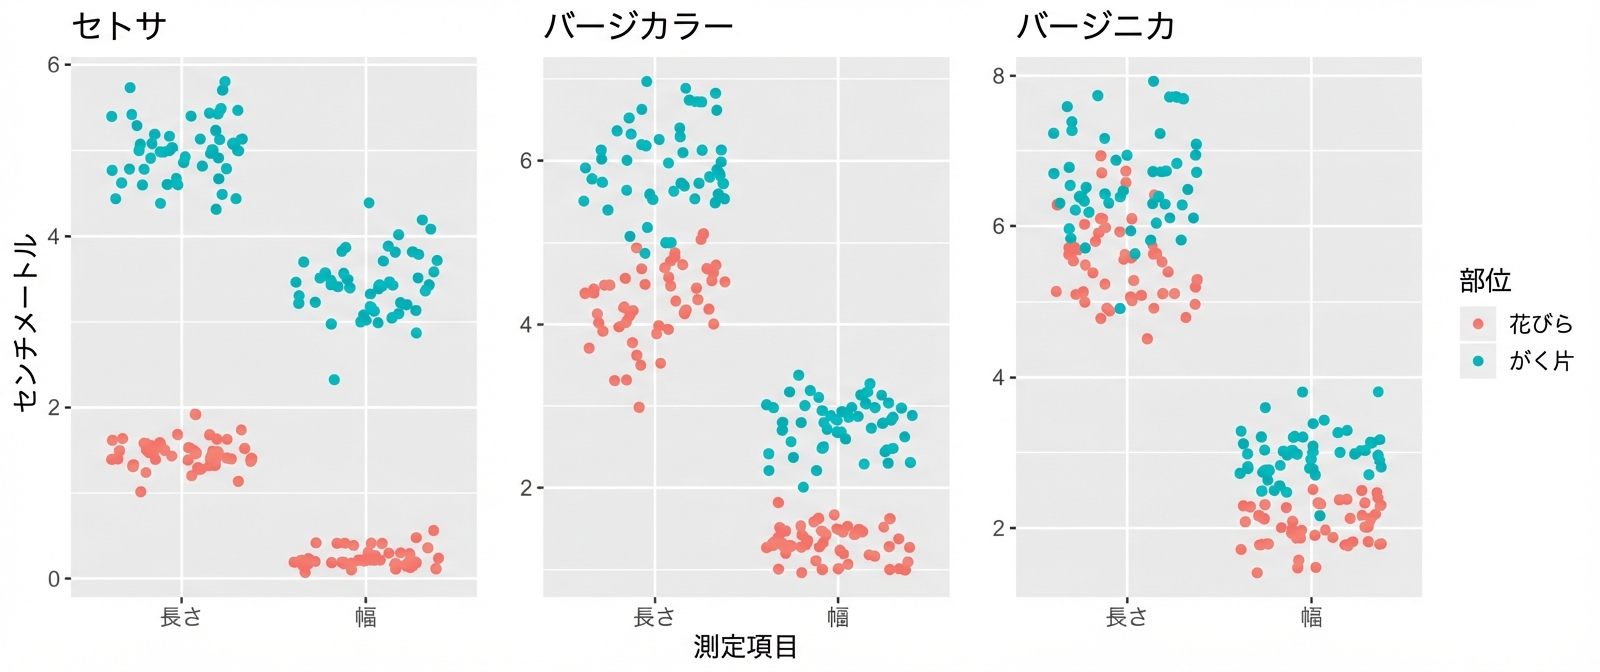
3つのアヤメ散布図:y軸非整列
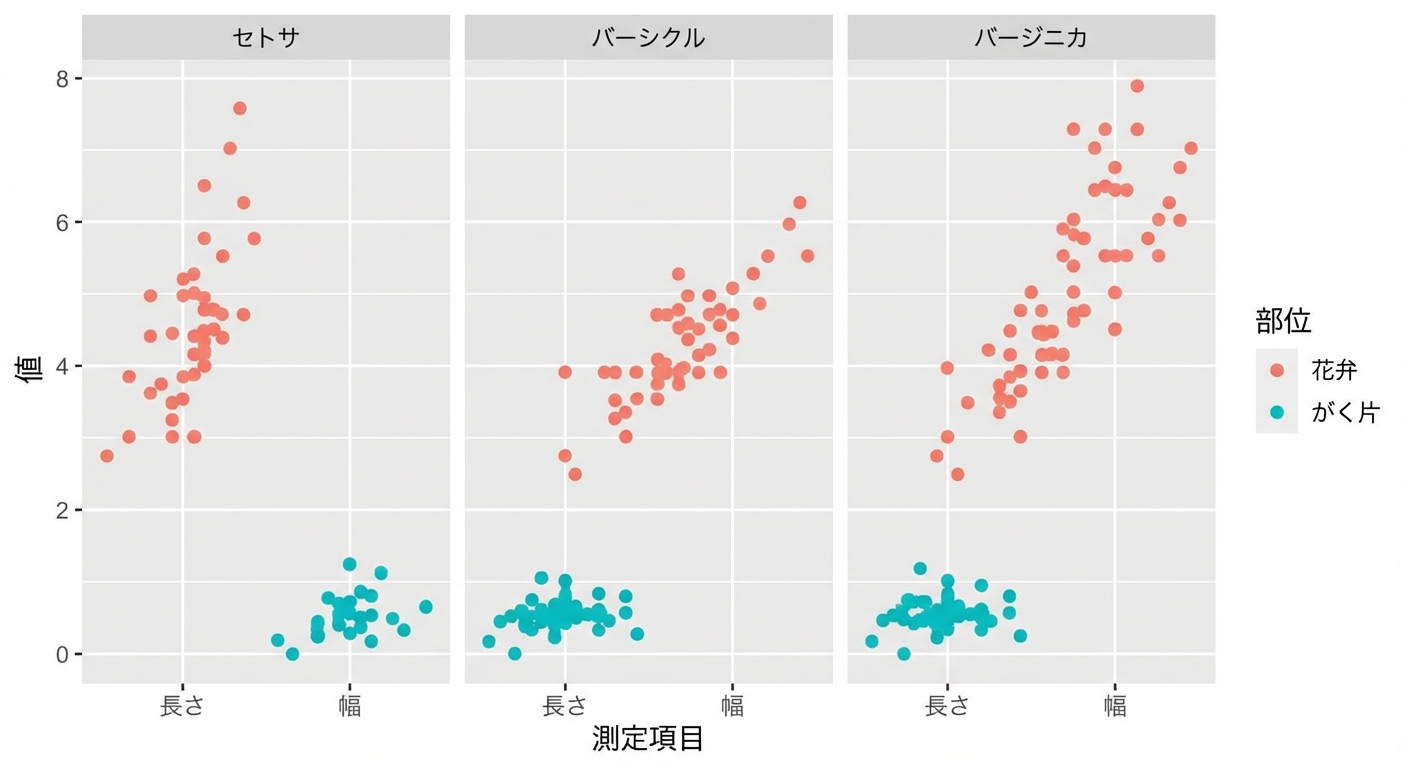
単一の面分割プロット:共通y軸
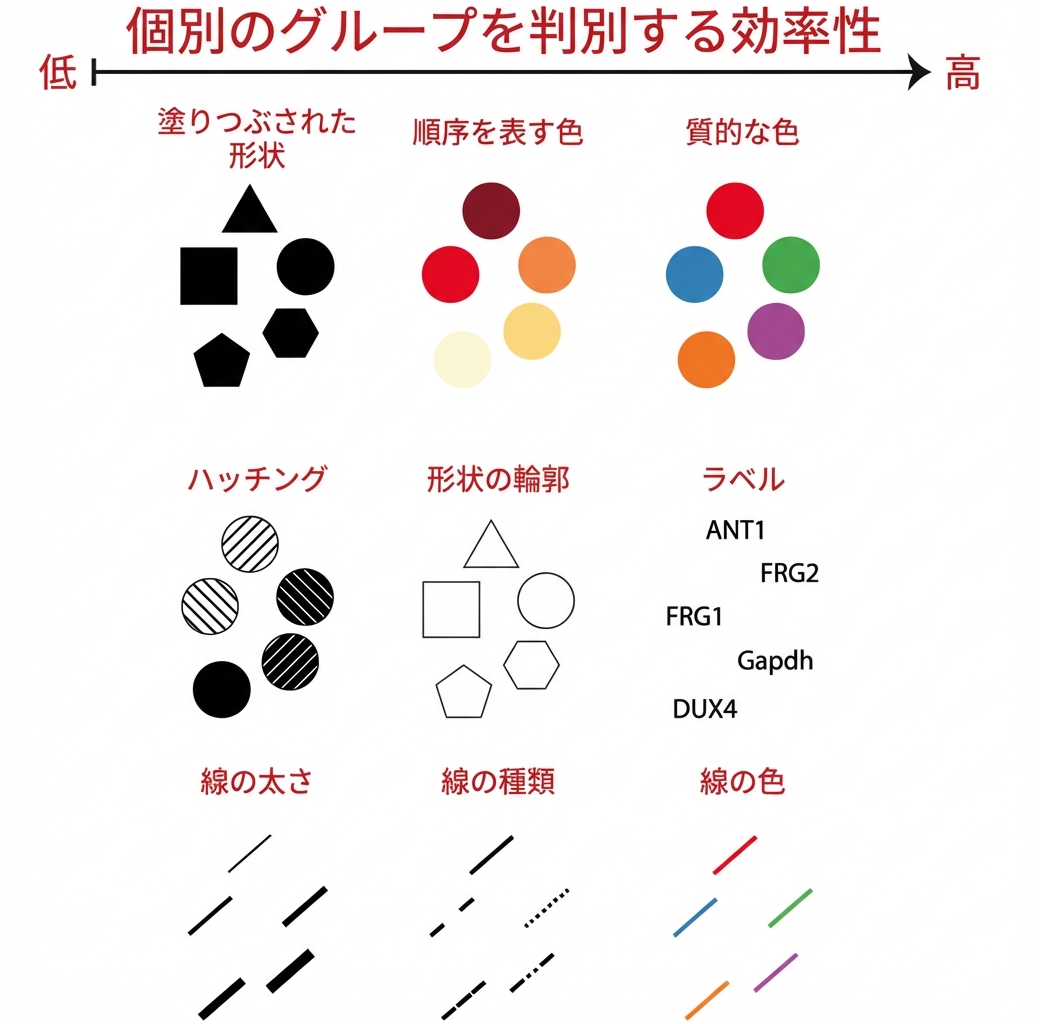
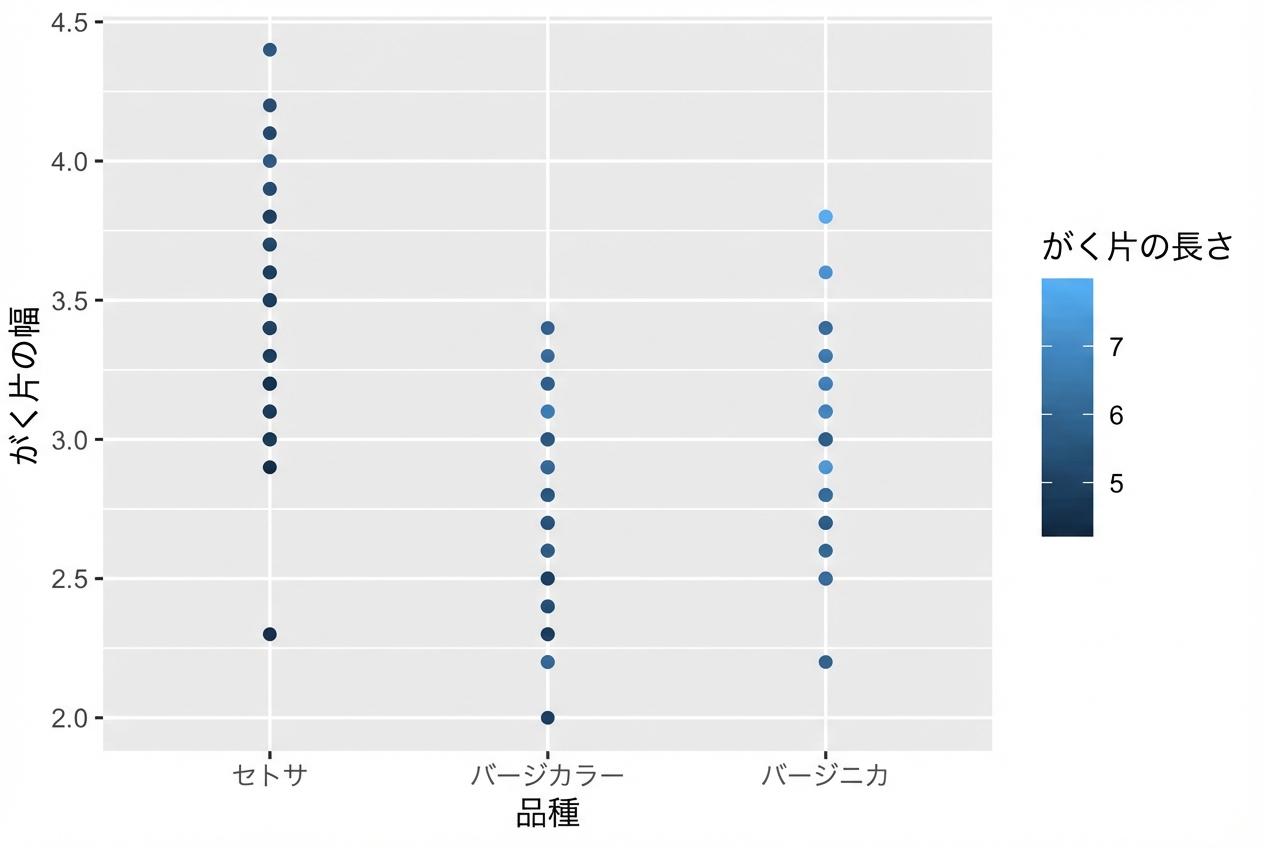
美的要素 - カテゴリ変数
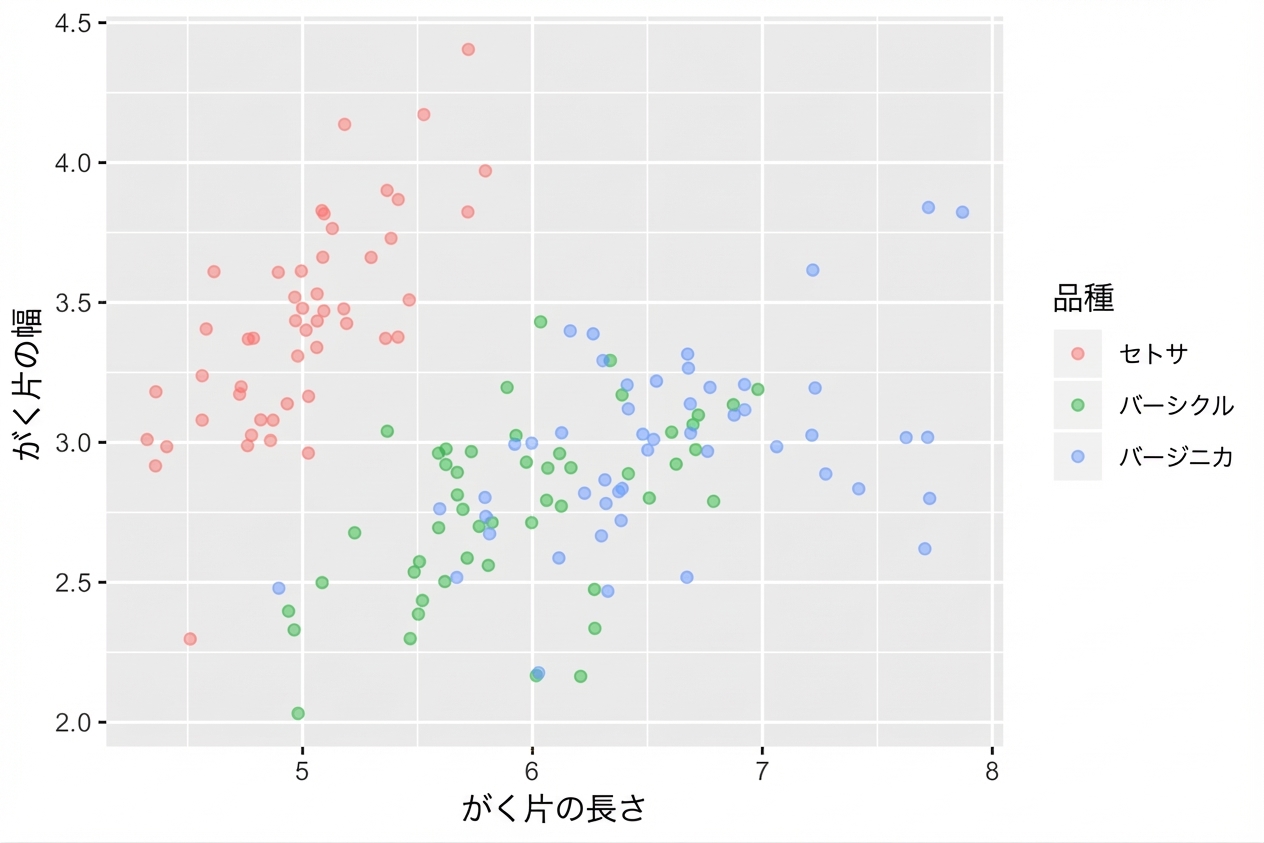
美的要素 - カテゴリ変数
ggplot2 で始めるデータ可視化入門
Rick Scavetta
Founder, Scavetta Academy

