ggplot2のレイヤー

ggplot2 で始めるデータ可視化入門

Rick Scavetta

Founder, Scavetta Academy

ggplot2パッケージ

  • Rで実装されたGrammar of Graphics
  • 重要な概念は2つ:
    1. レイヤーの文法要素
    2. 審美マッピング
ggplot2 で始めるデータ可視化入門

データ

ggplot2 で始めるデータ可視化入門

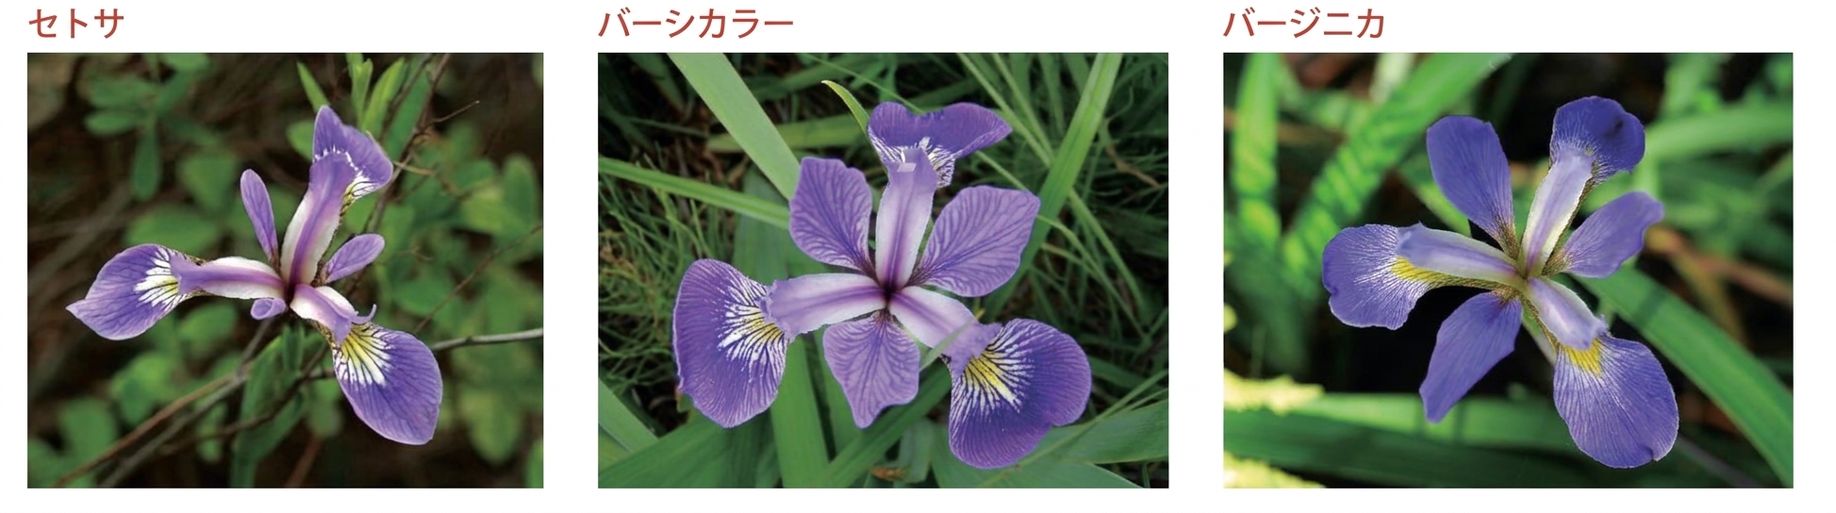
Irisデータセット

1 Fisher, R. A. (1936) The use of multiple measurements in taxonomic problems. Annals of Eugenics, 7, Part II, 179–188. 2 Anderson, Edgar (1935). The irises of the Gaspe Peninsula, Bulletin of the American Iris Society, 59, 2–5.
ggplot2 で始めるデータ可視化入門

Irisデータセット

iris
    Sepal.Length Sepal.Width Petal.Length Petal.Width    Species
1            5.1         3.5          1.4         0.2     setosa
2            4.9         3.0          1.4         0.2     setosa
3            4.7         3.2          1.3         0.2     setosa
...
50           5.0         3.3          1.4         0.2     setosa
51           7.0         3.2          4.7         1.4 versicolor
52           6.4         3.2          4.5         1.5 versicolor
53           6.9         3.1          4.9         1.5 versicolor
...
100          5.7         2.8          4.1         1.3 versicolor
101          6.3         3.3          6.0         2.5  virginica
102          5.8         2.7          5.1         1.9  virginica
103          7.1         3.0          5.9         2.1  virginica
...
150          5.9         3.0          5.1         1.8  virginica
ggplot2 で始めるデータ可視化入門

審美性(aesthetics)

ggplot2 で始めるデータ可視化入門

Irisの審美性

ggplot2 で始めるデータ可視化入門

ジオメトリ(geometries)

ggplot2 で始めるデータ可視化入門

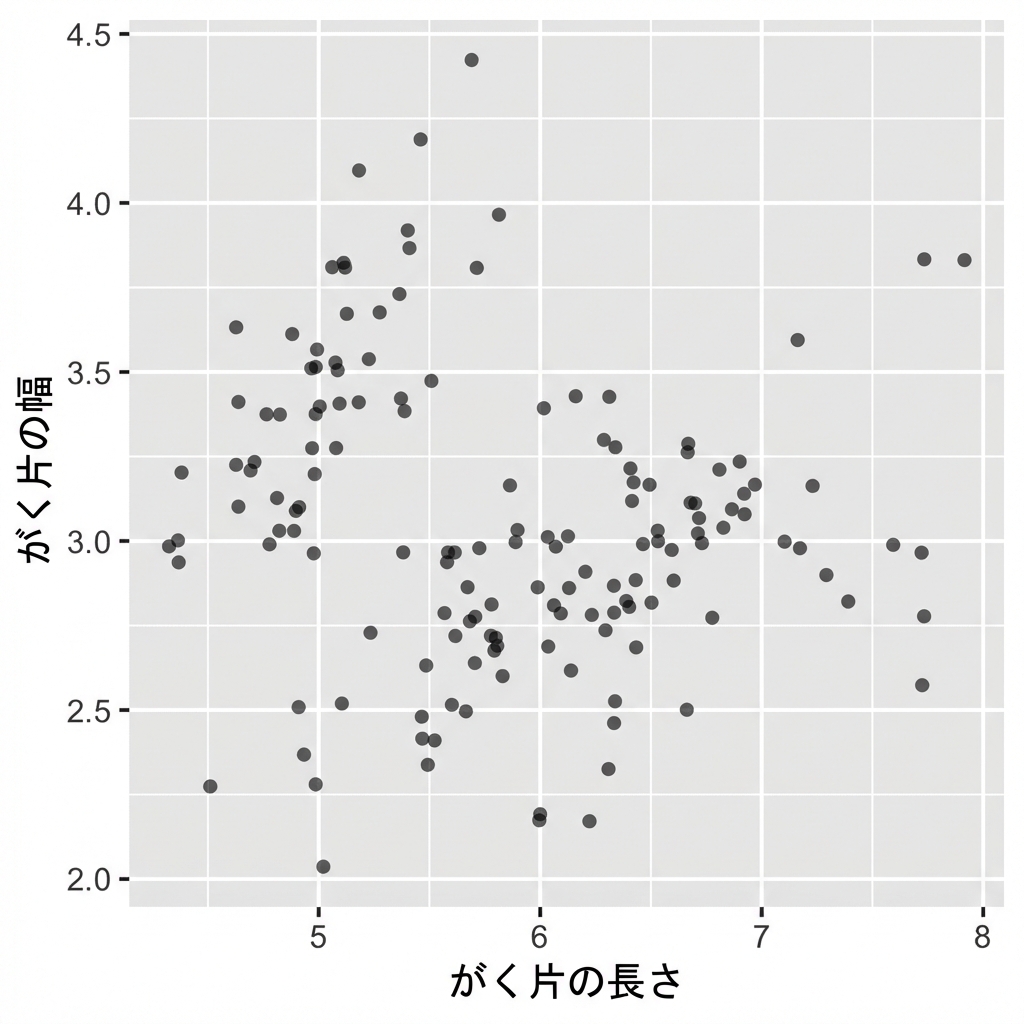
Irisのジオメトリ

g <- ggplot(iris, aes(x = Sepal.Length, y = Sepal.Width)) +
  geom_jitter()
g

ggplot2 で始めるデータ可視化入門

テーマ(themes)

ggplot2 で始めるデータ可視化入門

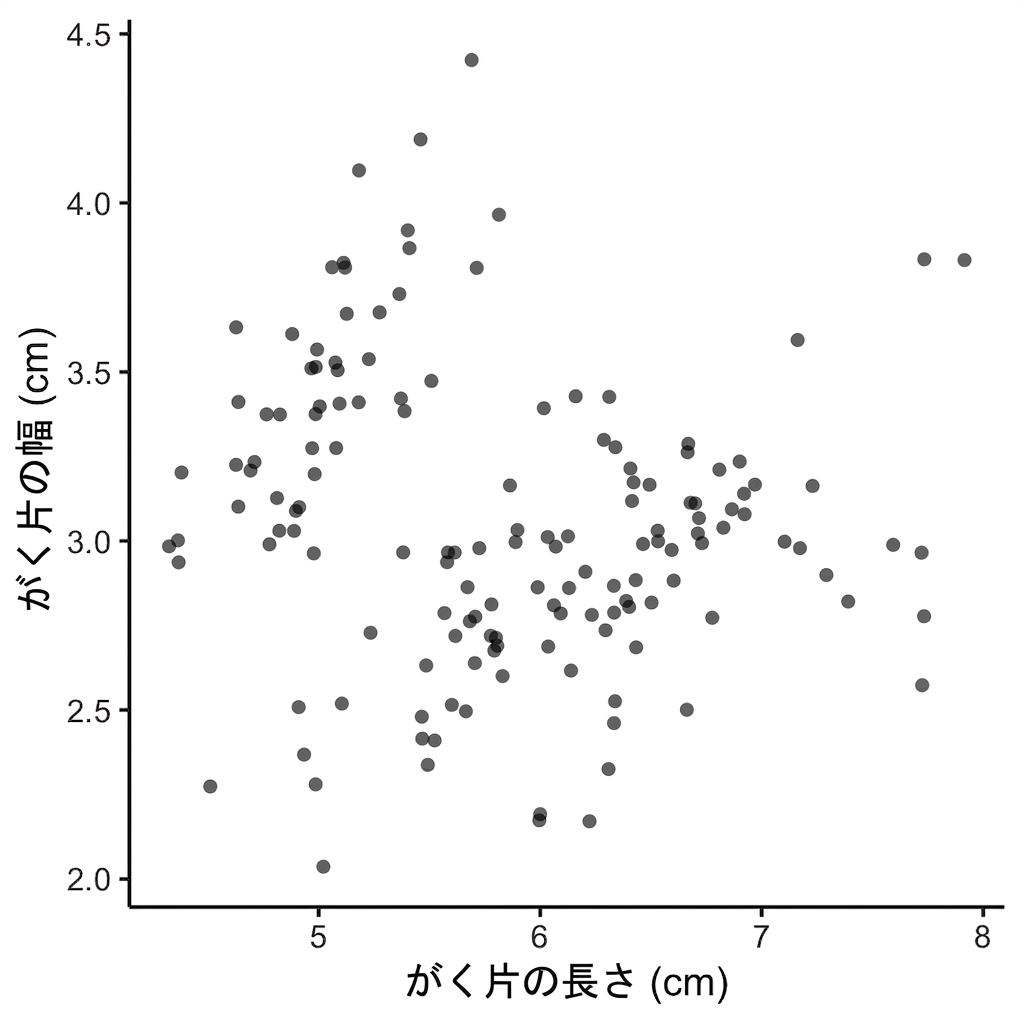
Irisのテーマ

g <- g +
  labs(x = "Sepal Length (cm)", y = "Sepal Width (cm)") +
  theme_classic()
g

ggplot2 で始めるデータ可視化入門

練習しましょう!

ggplot2 で始めるデータ可視化入門

Preparing Video For Download...