可視化を共有する

Matplotlibで学ぶデータ可視化入門

Ariel Rokem

Data Scientist

共有用の図

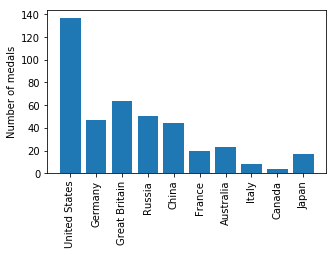
fig, ax = plt.subplots()

ax.bar(medals.index, medals["Gold"])
ax.set_xticklabels(medals.index, rotation=90)
ax.set_ylabel("Number of medals")

plt.show()
Matplotlibで学ぶデータ可視化入門

図をファイルに保存する

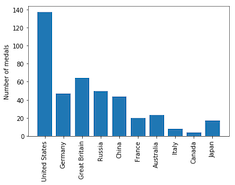
fig, ax = plt.subplots()

ax.bar(medals.index, medals["Gold"])
ax.set_xticklabels(medals.index, rotation=90)
ax.set_ylabel("Number of medals")

fig.savefig("gold_medals.png")
ls
gold_medals.png
Matplotlibで学ぶデータ可視化入門

さまざまなファイル形式

fig.savefig("gold_medals.jpg")
fig.savefig("gold_medals.jpg", quality=50)
fig.savefig("gold_medals.svg")
Matplotlibで学ぶデータ可視化入門

解像度

fig.savefig("gold_medals.png", dpi=300)
Matplotlibで学ぶデータ可視化入門

サイズ

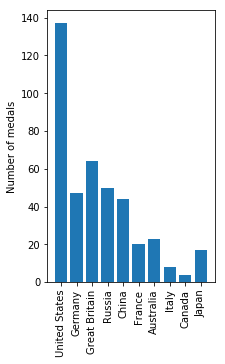
fig.set_size_inches([5, 3])

Matplotlibで学ぶデータ可視化入門

別のアスペクト比

fig.set_size_inches([3, 5])

Matplotlibで学ぶデータ可視化入門

保存を練習しましょう!

Matplotlibで学ぶデータ可視化入門

Preparing Video For Download...