次に進むには
Matplotlib によるデータ可視化入門

Ariel Rokem
Data Scientist
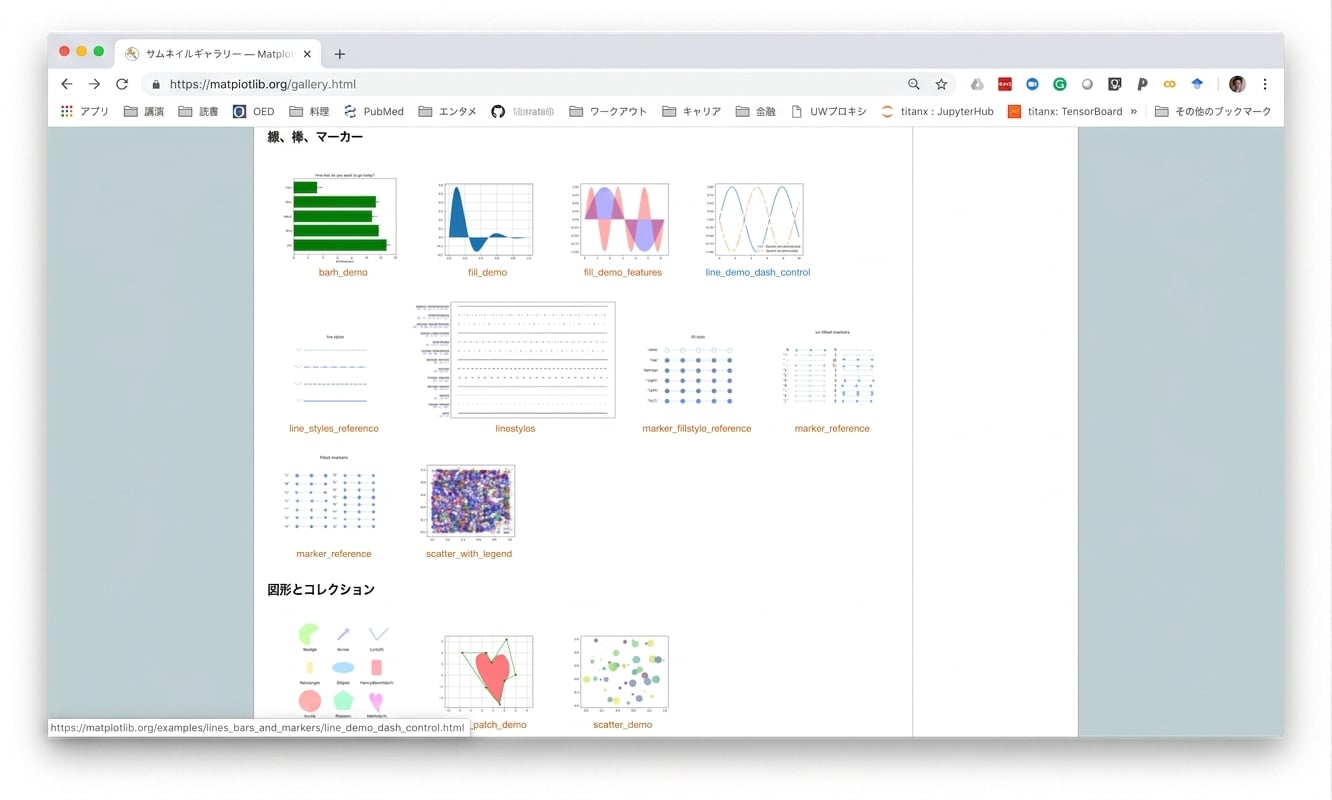
サンプルギャラリー
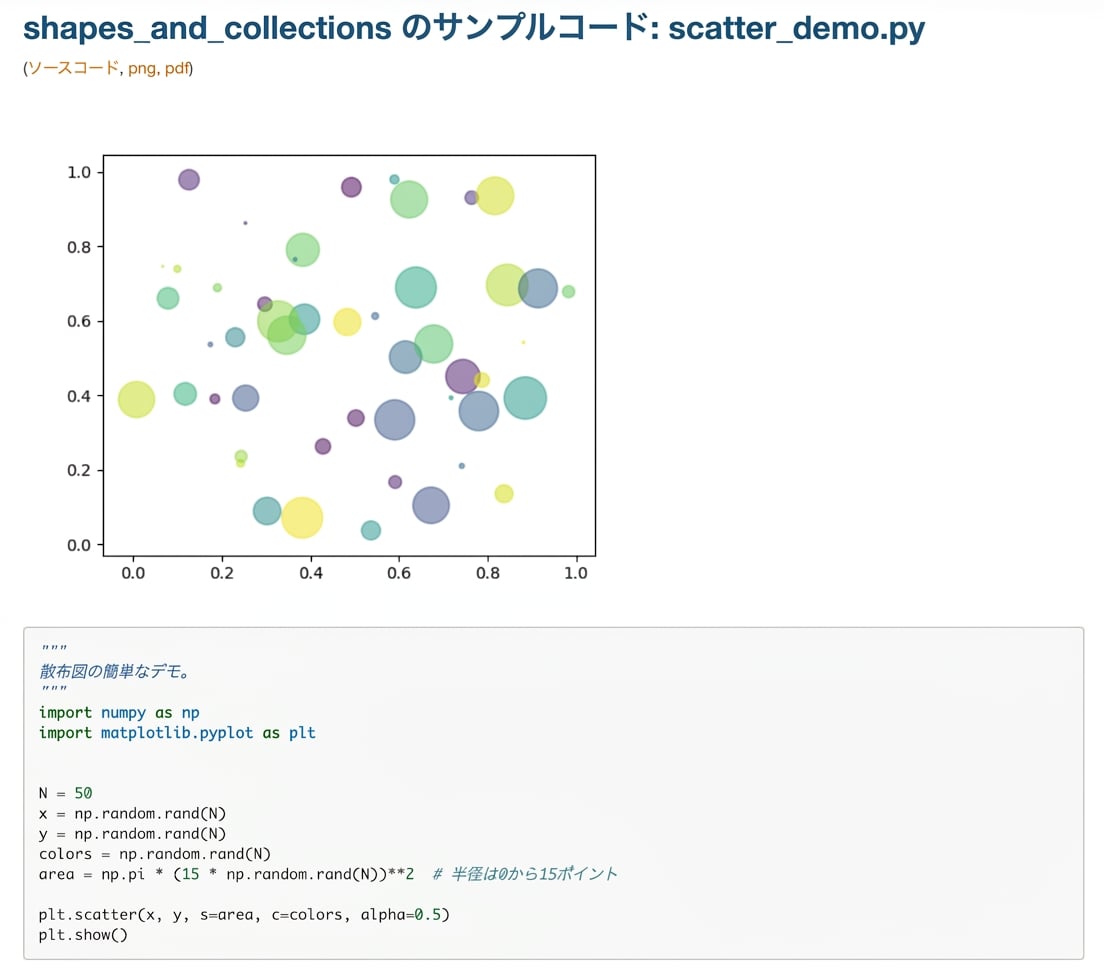
コード付きの例ページ
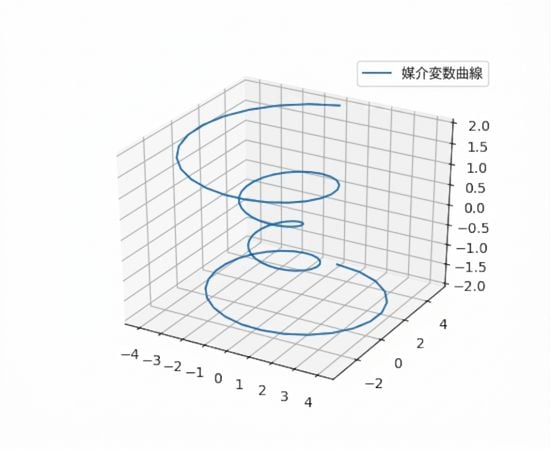
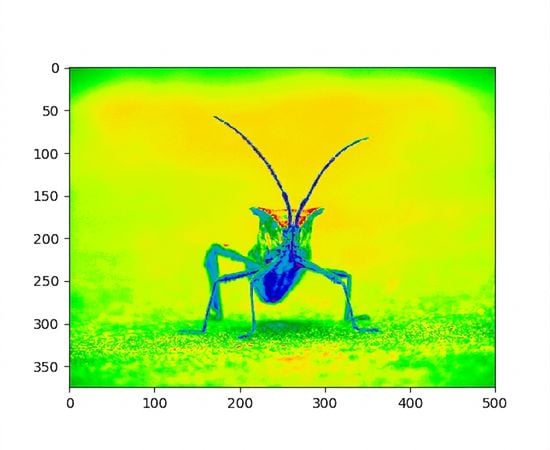
疑似カラーによる画像の可視化
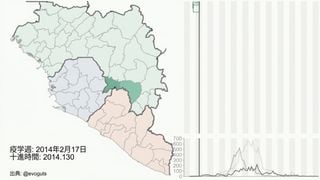
アニメーション
Matplotlibで地理空間データを扱う

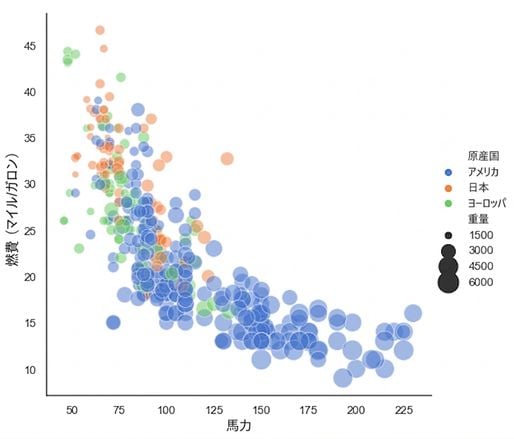
pandas + Matplotlib = Seaborn
seaborn.relplot(x="horsepower", y="mpg", hue="origin", size="weight",
                sizes=(40, 400), alpha=.5, palette="muted",
                height=6, data=mpg)