折れ線グラフ入門

Seaborn を使ったデータ可視化入門

Content Team

DataCamp

ラインプロットとは?
2種類のリレーショナルプロット:散布図と折れ線グラフ

  • 散布図
  • 各点は独立した観測を表す

折れ線グラフ

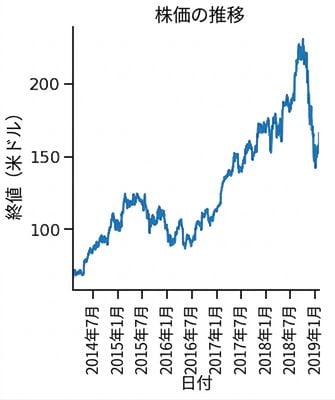
  • 各点は同じ「対象」を表し、通常は時間の経過に沿って追跡される

Line plot of stock price over time

Seaborn を使ったデータ可視化入門

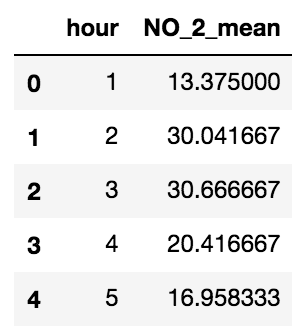
大気汚染データ

  • 市内各所に設置された大気測定ステーション
  • 二酸化窒素濃度を測定した大気サンプル

First five rows of air pollution DataFrame

Seaborn を使ったデータ可視化入門

散布図

import matplotlib.pyplot as plt
import seaborn as sns

sns.relplot(x="hour", y="NO_2_mean", 
            data=air_df_mean, 
            kind="scatter")

plt.show()

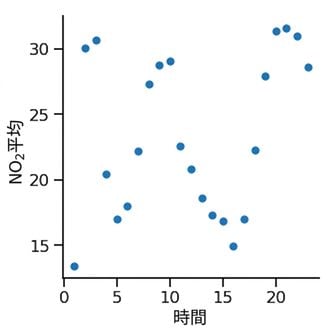
Scatter plot of average nitrogen dioxide over time

Seaborn を使ったデータ可視化入門

折れ線グラフ

import matplotlib.pyplot as plt
import seaborn as sns

sns.relplot(x="hour", y="NO_2_mean", 
            data=air_df_mean, 
            kind="line")

plt.show()

Line plot of average nitrogen dioxide over time

Seaborn を使ったデータ可視化入門

場所によるサブグループ分け

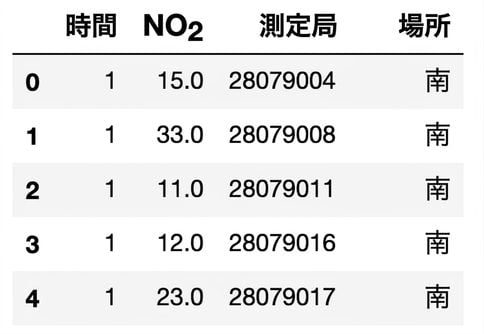
First five rows of air pollution by location DataFrame

Seaborn を使ったデータ可視化入門

場所によるサブグループ分け

import matplotlib.pyplot as plt
import seaborn as sns

sns.relplot(x="hour", y="NO_2_mean", 
            data=air_df_loc_mean, 
            kind="line",
            style="location", 
            hue="location")

plt.show()

Line plot of average nitrogen dioxide over time per region

Seaborn を使ったデータ可視化入門

マーカーを追加する

import matplotlib.pyplot as plt
import seaborn as sns

sns.relplot(x="hour", y="NO_2_mean", 
            data=air_df_loc_mean, 
            kind="line", 
            style="location", 
            hue="location",
            markers=True)

plt.show()

Line plot with markers added

Seaborn を使ったデータ可視化入門

線のスタイルによる区別をオフにする

import matplotlib.pyplot as plt
import seaborn as sns

sns.relplot(x="hour", y="NO_2_mean", 
            data=air_df_loc_mean, 
            kind="line", 
            style="location", 
            hue="location",
            markers=True,
            dashes=False)

plt.show()

Line plot with markers and solid lines

Seaborn を使ったデータ可視化入門

各x値に複数の観測値

First five rows of air pollution DataFrame per station

Seaborn を使ったデータ可視化入門

各x値に複数の観測値

散布図
import matplotlib.pyplot as plt
import seaborn as sns

sns.relplot(x="hour", y="NO_2", 
            data=air_df, 
            kind="scatter")

plt.show()

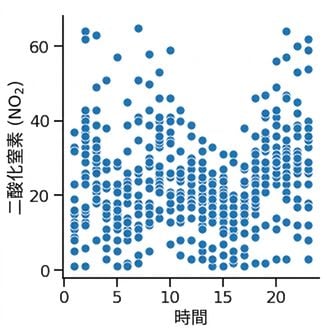
Scatter plot of nitrogen dioxide for all stations over time

Seaborn を使ったデータ可視化入門

各x値に複数の観測値

折れ線グラフ
import matplotlib.pyplot as plt
import seaborn as sns

sns.relplot(x="hour", y="NO_2", 
            data=air_df, 
            kind="line")

plt.show()

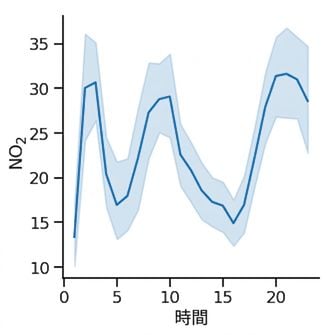
Line plot of nitrogen dioxide for all stations over time

Seaborn を使ったデータ可視化入門

各x値に複数の観測値

網掛け部分は信頼区間を示す

  • データセットが無作為標本であると仮定する
  • 平均値がこの区間内にあると95%の信頼をもって言える
  • 推定値の不確実性を示す

Line plot of nitrogen dioxide for all stations over time

Seaborn を使ったデータ可視化入門

信頼区間を標準偏差に置き換える

import matplotlib.pyplot as plt
import seaborn as sns

sns.relplot(x="hour", y="NO_2", 
            data=air_df, 
            kind="line",
            errorbar="sd")

plt.show()

Line plot with standard deviation

Seaborn を使ったデータ可視化入門

信頼区間を非表示にする

import matplotlib.pyplot as plt
import seaborn as sns

sns.relplot(x="hour", y="NO_2", 
            data=air_df, 
            kind="line",
            errorbar=None)

plt.show()

Line plot with no confidence interval

Seaborn を使ったデータ可視化入門

練習しましょう!

Seaborn を使ったデータ可視化入門

Preparing Video For Download...