ポイントプロット

Seaborn を使ったデータ可視化入門

Content Team

DataCamp

ポイントプロットとは?
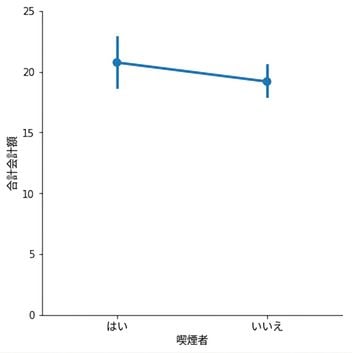
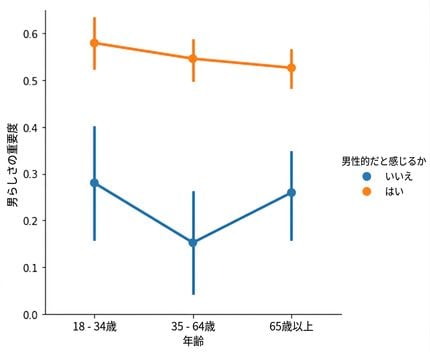
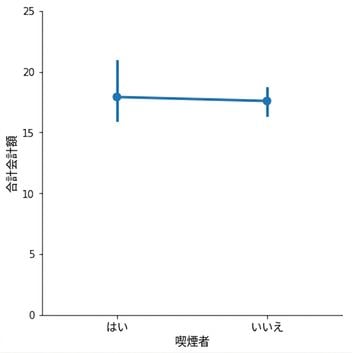
  • 点は量的変数の平均を示す
  • 縦線は95%信頼区間を示す

Point plot of average bill of smokers vs. non-smokers

1 Waskom, M. L. (2021). seaborn: statistical data visualization. https://seaborn.pydata.org/
Seaborn を使ったデータ可視化入門

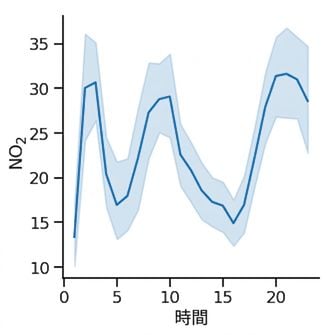
折れ線グラフ:時間の経過に伴う二酸化窒素の平均濃度 Line plot of nitrogen dioxide over time

ポイントプロット:喫煙者と非喫煙者の平均会計額 Point plot of average bill of smokers vs. non-smokers

1 Waskom, M. L. (2021). seaborn: statistical data visualization. https://seaborn.pydata.org/
Seaborn を使ったデータ可視化入門

ポイントプロット vs. 棒グラフ

どちらも以下を表示:

  • 量的変数の平均
  • 平均の95%信頼区間

違い:

  • 折れ線グラフでは、x軸に量的変数(通常は時間)を使用する
  • ポイントプロットでは、x軸にカテゴリ変数を使用する
Seaborn を使ったデータ可視化入門

ポイントプロット vs. 棒グラフ

どちらも以下を表示:

  • 量的変数の平均
  • 平均の95%信頼区間
Seaborn を使ったデータ可視化入門

ポイントプロット vs. 棒グラフ

Bar plot of masculinity with hue

Point plot of masculinity with hue

Seaborn を使ったデータ可視化入門

ポイントプロットの作成

import matplotlib.pyplot as plt
import seaborn as sns

sns.catplot(x="age", 
            y="masculinity_important", 
            data=masculinity_data,
            hue="feel_masculine",
            kind="point")

plt.show()

Point plot of masculinity with hue

Seaborn を使ったデータ可視化入門

点をつなぐ線をなくす

import matplotlib.pyplot as plt
import seaborn as sns

sns.catplot(x="age", 
            y="masculinity_important", 
            data=masculinity_data,
            hue="feel_masculine",
            kind="point",
            linestyle="none")

plt.show()

Point plot of masculinity with hue and points disconnected

Seaborn を使ったデータ可視化入門

中央値の表示

import matplotlib.pyplot as plt
import seaborn as sns

sns.catplot(x="smoker", 
            y="total_bill", 
            data=tips, 
            kind="point")

plt.show()

Point plot of average total bill for smokers vs. non-smokers

1 Waskom, M. L. (2021). seaborn: statistical data visualization. https://seaborn.pydata.org/
Seaborn を使ったデータ可視化入門

中央値の表示

import matplotlib.pyplot as plt
import seaborn as sns
from numpy import median

sns.catplot(x="smoker", 
            y="total_bill", 
            data=tips, 
            kind="point", 
            estimator=median)

plt.show()

Point plot of median total bill for smokers vs. non-smokers

1 Waskom, M. L. (2021). seaborn: statistical data visualization. https://seaborn.pydata.org/
Seaborn を使ったデータ可視化入門

信頼区間のカスタマイズ

import matplotlib.pyplot as plt
import seaborn as sns

sns.catplot(x="smoker", 
            y="total_bill", 
            data=tips, 
            kind="point",
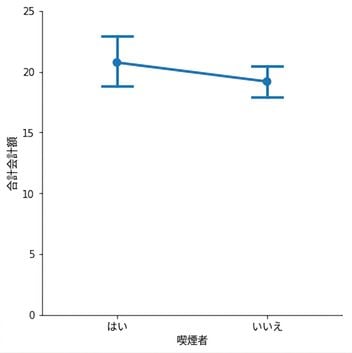
            capsize=0.2)

plt.show()

Point plot with caps on confidence intervals

1 Waskom, M. L. (2021). seaborn: statistical data visualization. https://seaborn.pydata.org/
Seaborn を使ったデータ可視化入門

信頼区間を非表示にする

import matplotlib.pyplot as plt
import seaborn as sns

sns.catplot(x="smoker", 
            y="total_bill", 
            data=tips, 
            kind="point",
            errorbar=None)

plt.show()

Point plot with no confidence intervals

1 Waskom, M. L. (2021). seaborn: statistical data visualization. https://seaborn.pydata.org/
Seaborn を使ったデータ可視化入門

練習しましょう!

Seaborn を使ったデータ可視化入門

Preparing Video For Download...