箱ひげ図の作成

Seaborn を使ったデータ可視化入門

Content Team

DataCamp

箱ひげ図とは?
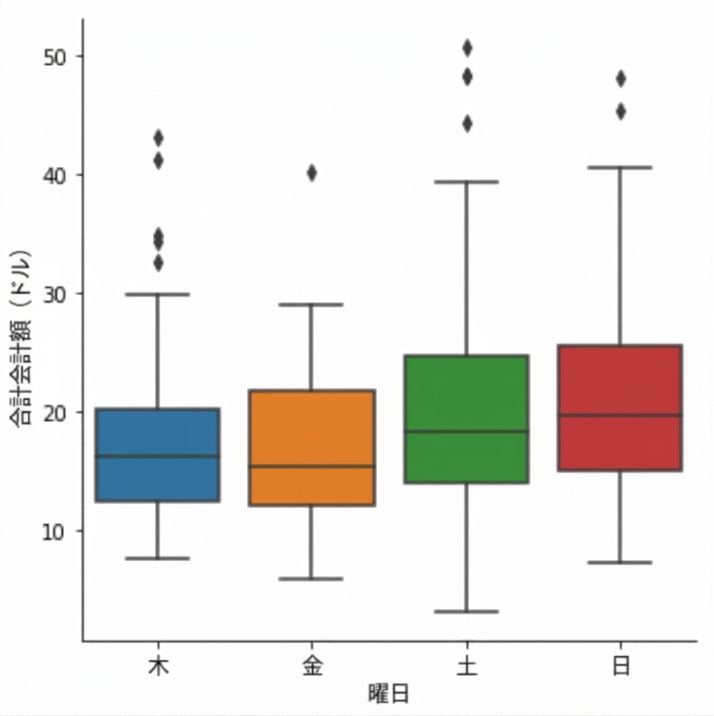
  • 量的データの分布を示す
  • 中央値、ばらつき、歪度、外れ値を確認できる
  • グループ間の比較がしやすい

Box plot of total bill broken down by day of the week

1 Waskom, M. L. (2021). seaborn: statistical data visualization. https://seaborn.pydata.org/
Seaborn を使ったデータ可視化入門

箱ひげ図の作成方法

import matplotlib.pyplot as plt
import seaborn as sns

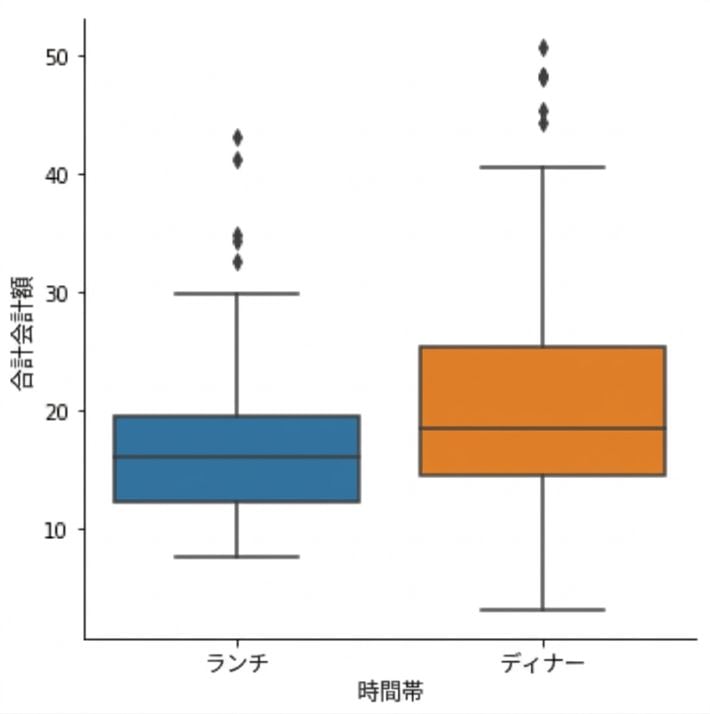
g = sns.catplot(x="time", 
                y="total_bill",
                data=tips, 
                kind="box")

plt.show()

Box plot of total bill broken down by time of day

1 Waskom, M. L. (2021). seaborn: statistical data visualization. https://seaborn.pydata.org/
Seaborn を使ったデータ可視化入門

カテゴリの順序を変更する

import matplotlib.pyplot as plt
import seaborn as sns

g = sns.catplot(x="time", 
                y="total_bill",
                data=tips, 
                kind="box",
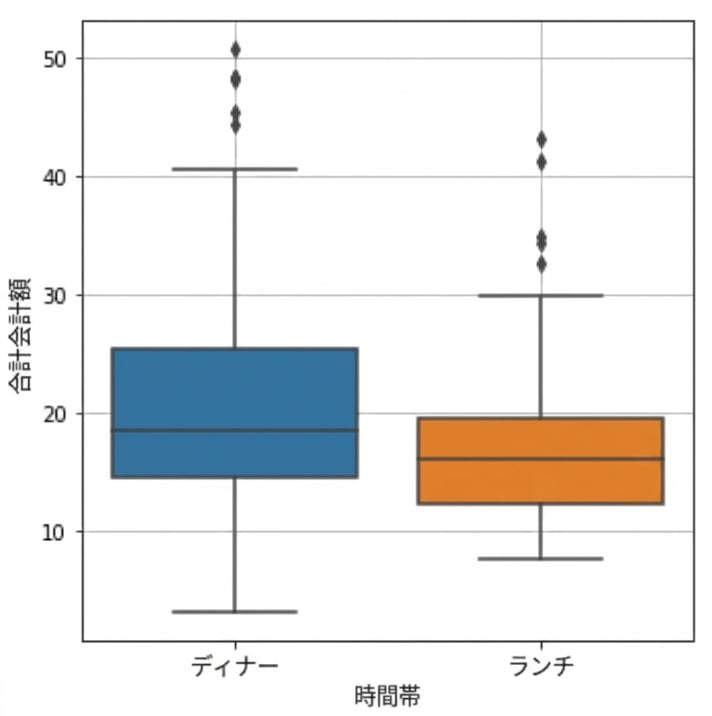
                order=["Dinner", 
                       "Lunch"])

plt.show()

Box plot with dinner shown before lunch

1 Waskom, M. L. (2021). seaborn: statistical data visualization. https://seaborn.pydata.org/
Seaborn を使ったデータ可視化入門

外れ値を非表示にする

import matplotlib.pyplot as plt
import seaborn as sns

g = sns.catplot(x="time", 
                y="total_bill",
                data=tips, 
                kind="box",
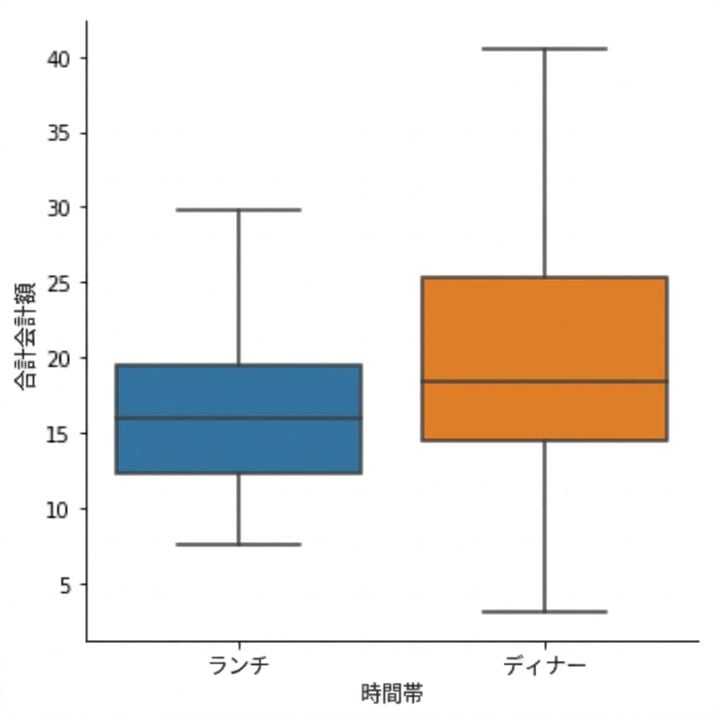
                showfliers=False)

plt.show()

Box plot with outliers omitted

1 Waskom, M. L. (2021). seaborn: statistical data visualization. https://seaborn.pydata.org/
Seaborn を使ったデータ可視化入門

`whis`を使ってひげを変更する

  • デフォルトでは、ひげは四分位範囲の1.5倍まで伸びる
  • ひげを四分位範囲(IQR)の2.0倍まで伸ばす: whis=2.0
  • 第5パーセンタイルと第95パーセンタイルを表示する: whis=[5, 95]
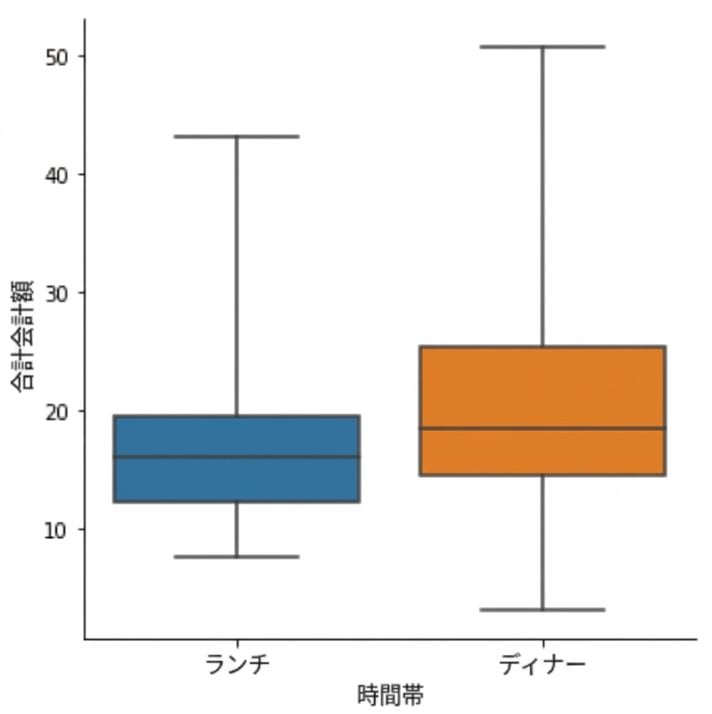
  • 最小値と最大値を表示する: whis=[0, 100]
Seaborn を使ったデータ可視化入門

`whis`を使ってひげを変更する

import matplotlib.pyplot as plt
import seaborn as sns

g = sns.catplot(x="time", 
                y="total_bill",
                data=tips, 
                kind="box",
                whis=[0, 100])

plt.show()

Box plot with whiskers set to minimum and maximum

1 Waskom, M. L. (2021). seaborn: statistical data visualization. https://seaborn.pydata.org/
Seaborn を使ったデータ可視化入門

練習しましょう!

Seaborn を使ったデータ可視化入門

Preparing Video For Download...