プロットのスタイルと色を変更する

Seaborn を使ったデータ可視化入門

Content Team

DataCamp

なぜカスタマイズするのか?

スタイルを変更する理由:

  • 個人の好み
  • 可読性の向上
  • 解釈を導く
Seaborn を使ったデータ可視化入門

図のスタイルを変更する

  • 図の「スタイル」には、背景と軸が含まれる
  • プリセットのオプション:"white"、"dark"、"whitegrid"、"darkgrid"、"ticks"
  • sns.set_style()
Seaborn を使ったデータ可視化入門

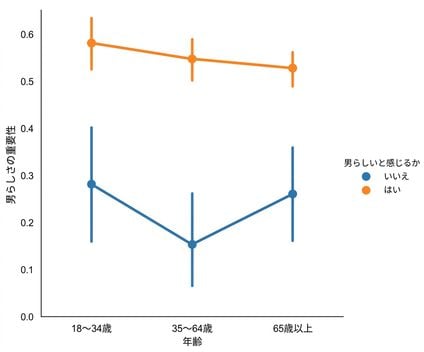
デフォルトの図のスタイル("white")

sns.catplot(x="age", 
            y="masculinity_important",
            data=masculinity_data,
            hue="feel_masculine",
            kind="point")

plt.show()

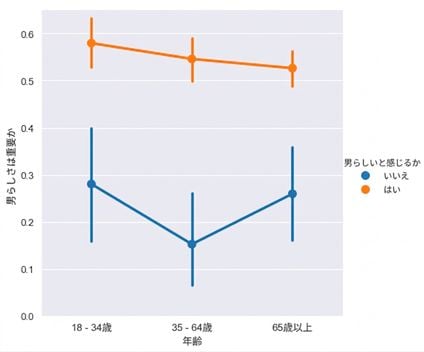
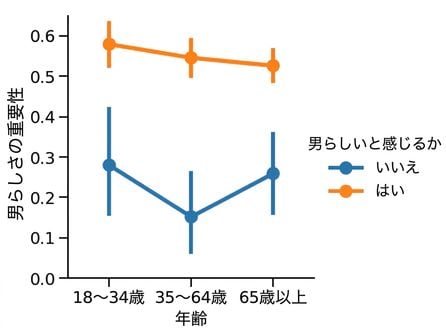
Point plot of masculinity survey

Seaborn を使ったデータ可視化入門

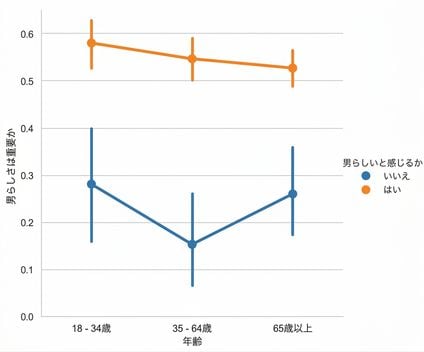
図のスタイル: "whitegrid"

sns.set_style("whitegrid")

sns.catplot(x="age", 
            y="masculinity_important",
            data=masculinity_data,
            hue="feel_masculine",
            kind="point")

plt.show()

Point plot with white grid background

Seaborn を使ったデータ可視化入門

その他のスタイル

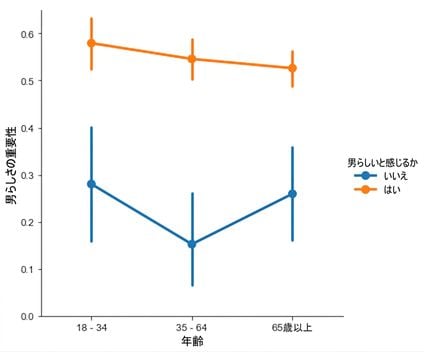
sns.set_style("ticks")

sns.catplot(x="age", 
            y="masculinity_important",
            data=masculinity_data,
            hue="feel_masculine",
            kind="point")

plt.show()

Point plot with ticks

Seaborn を使ったデータ可視化入門

その他のスタイル

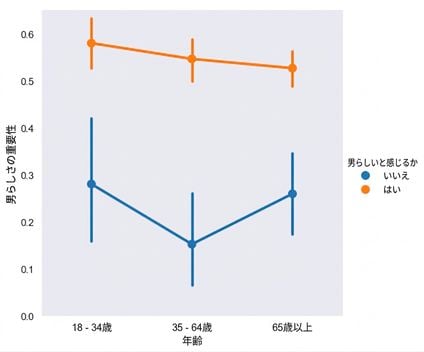
sns.set_style("dark")

sns.catplot(x="age", 
            y="masculinity_important",
            data=masculinity_data,
            hue="feel_masculine",
            kind="point")

plt.show()

Point plot with dark background

Seaborn を使ったデータ可視化入門

その他のスタイル

sns.set_style("darkgrid")

sns.catplot(x="age", 
            y="masculinity_important",
            data=masculinity_data,
            hue="feel_masculine",
            kind="point")

plt.show()

Point plot with dark grid background

Seaborn を使ったデータ可視化入門

カラーパレットを変更する

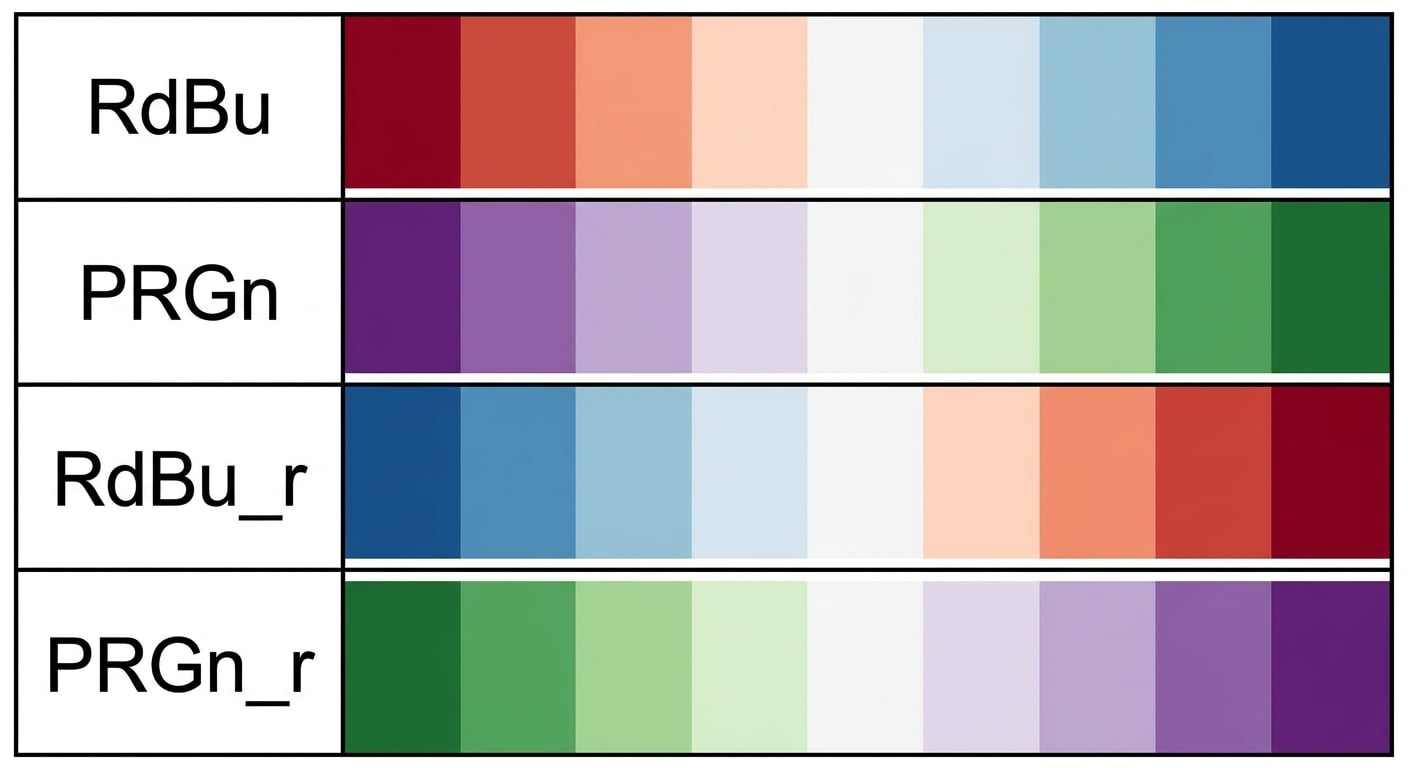
  • 図の「カラーパレット」は、プロットの主要な要素の色を変更する
  • sns.set_palette()
  • プリセットのパレットを使用するか、カスタムパレットを作成する
Seaborn を使ったデータ可視化入門

カラーパレットを変更する

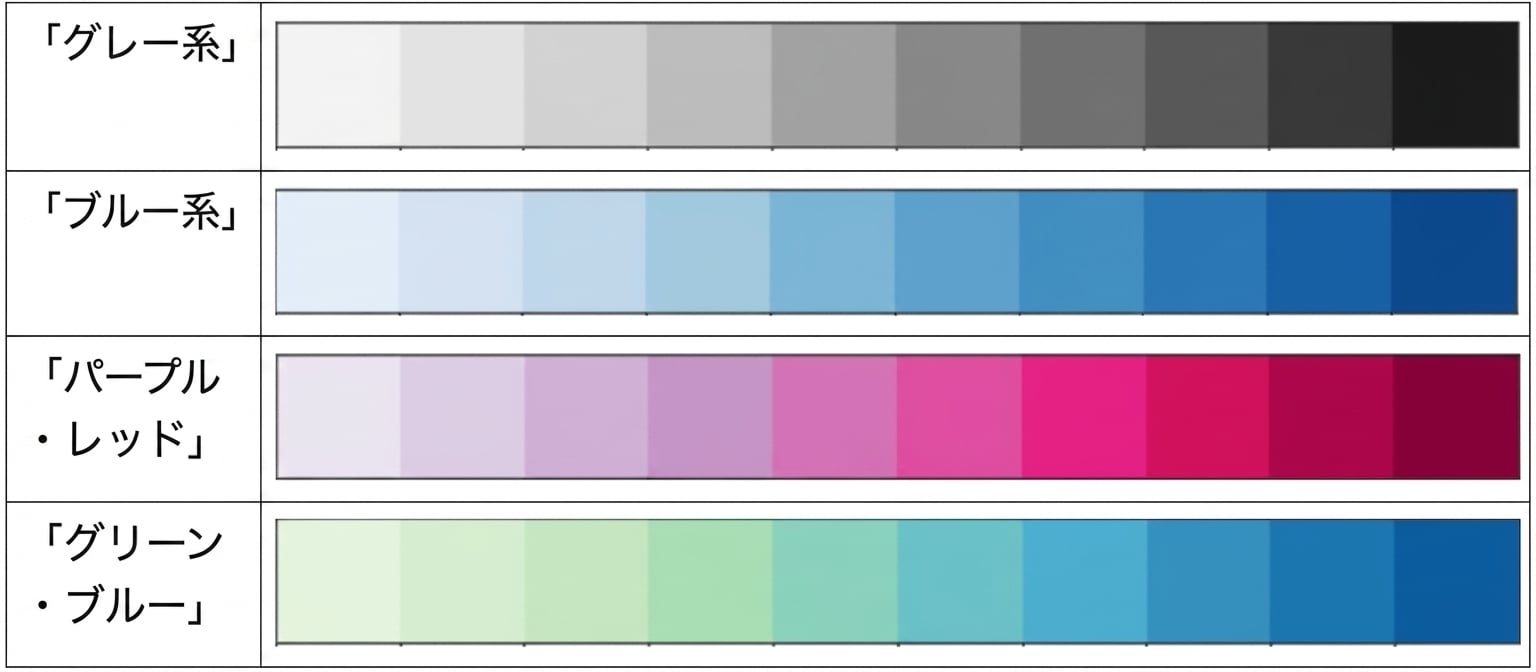
Four example diverging palettes

Seaborn を使ったデータ可視化入門

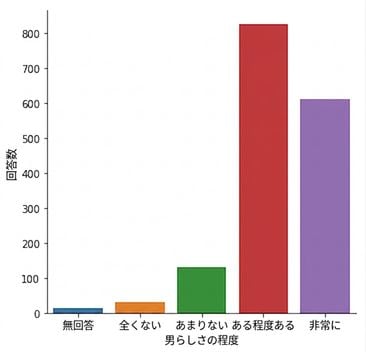
例(デフォルトのカラーパレット)

category_order = ["No answer", 
                  "Not at all",
                  "Not very", 
                  "Somewhat", 
                  "Very"]

sns.catplot(x="how_masculine",
            data=masculinity_data,
            kind="count",
            order=category_order)

plt.show()

Count plot of survey responses

Seaborn を使ったデータ可視化入門

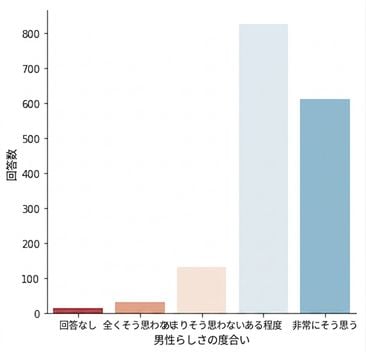
例(発散型パレット)

sns.set_palette("RdBu")

category_order = ["No answer", 
                  "Not at all",
                  "Not very", 
                  "Somewhat", 
                  "Very"]

sns.catplot(x="how_masculine",
            data=masculinity_data,
            kind="count",
            order=category_order)

plt.show()

Count plot with diverging palette

Seaborn を使ったデータ可視化入門

シーケンシャルパレット

Four example sequential palettes

Seaborn を使ったデータ可視化入門

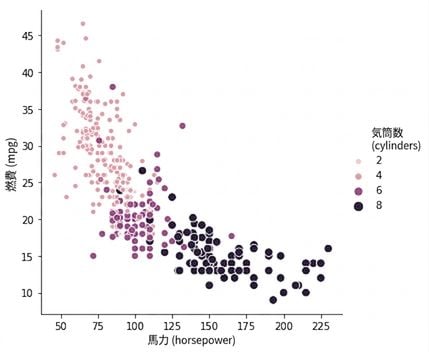
連続的スケールの例

Scatter plot of horsepower vs. mpg with sequential palette

1 Waskom, M. L. (2021). seaborn: statistical data visualization. https://seaborn.pydata.org/
Seaborn を使ったデータ可視化入門

カスタムパレット

custom_palette = ["red", "green", "orange", "blue",
                  "yellow", "purple"]

sns.set_palette(custom_palette)

Custom color name palette

Seaborn を使ったデータ可視化入門

カスタムパレット

custom_palette = ['#FBB4AE', '#B3CDE3', '#CCEBC5', 
                  '#DECBE4', '#FED9A6', '#FFFFCC', 
                  '#E5D8BD', '#FDDAEC', '#F2F2F2']

sns.set_palette(custom_palette)

Custom hex code palette

Seaborn を使ったデータ可視化入門

スケールを変更する

  • 図の「コンテキスト」は、プロット要素とラベルのスケールを変更する
  • sns.set_context()
Seaborn を使ったデータ可視化入門

デフォルトのコンテキスト: "paper"

sns.catplot(x="age", 
            y="masculinity_important",
            data=masculinity_data,
            hue="feel_masculine",
            kind="point")

plt.show()

Point plot with notebook context

Seaborn を使ったデータ可視化入門

より大きいスケールのコンテキスト: "talk"

sns.set_context("talk")

sns.catplot(x="age", 
            y="masculinity_important",
            data=masculinity_data,
            hue="feel_masculine",
            kind="point")

plt.show()

Point plot with larger context

Seaborn を使ったデータ可視化入門

練習しましょう!

Seaborn を使ったデータ可視化入門

Preparing Video For Download...