よくできました!次のステップは?

Seaborn を使ったデータ可視化入門

Content Team

DataCamp

Seabornはどの段階で活用できる?

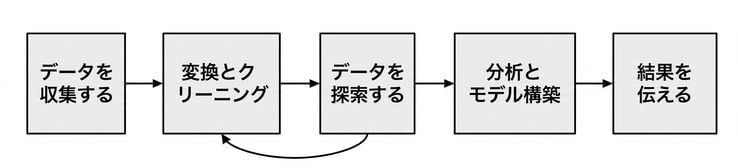
Data analysis workflow

Seaborn を使ったデータ可視化入門

Seabornはどの段階で活用できる?

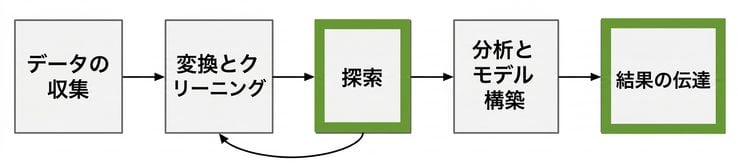
Data analysis workflow with explore and communicate highlighted

Seaborn を使ったデータ可視化入門

次のステップ: データを探索し、結果を伝える

Data analysis workflow with explore and communicate highlighted

次のステップ:

  • Seabornの高度な可視化
  • Matplotlibの高度なカスタマイズ
Seaborn を使ったデータ可視化入門

次のステップ: データを収集する

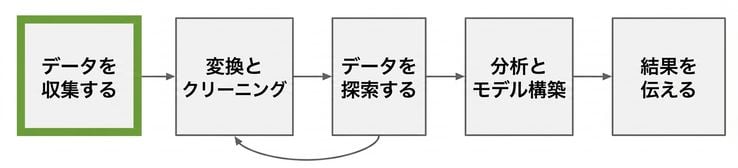
Data analysis workflow with gather data highlighted

次のステップ: Python

Seaborn を使ったデータ可視化入門

次のステップ: 変換とクリーニング

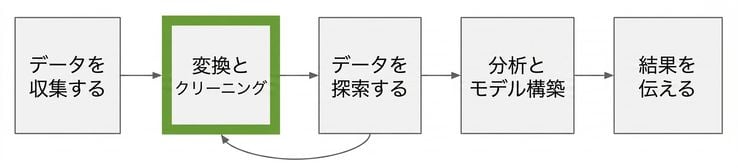
Data analysis workflow with transform and clean highlighted

次のステップ:

  • データをpandas DataFrameに取り込む
  • データをクリーニングする
  • 整然データ形式に変換する
Seaborn を使ったデータ可視化入門

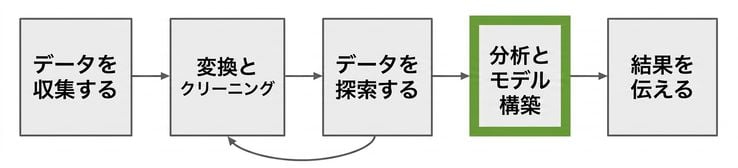
次のステップ: 分析とモデル構築

Data analysis workflow with analyze and build highlighted

次のステップ:

  • 統計分析
  • 信頼区間の計算と解釈
Seaborn を使ったデータ可視化入門

まとめ

Seaborn を使ったデータ可視化入門

Preparing Video For Download...