Seaborn入門

Seaborn を使ったデータ可視化入門

Content Team

DataCamp

Seabornとは?
  • Pythonのデータ可視化ライブラリ
  • よく使われる種類のプロットを簡単に作成できる

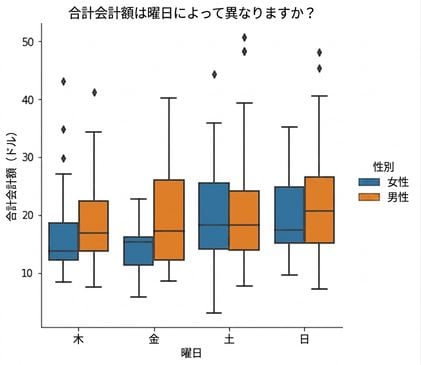
Box plots of total bill for each day of the week, factored by male vs. female

1 Waskom, M. L. (2021). seaborn: statistical data visualization. https://seaborn.pydata.org/
Seaborn を使ったデータ可視化入門

Seabornはなぜ便利?

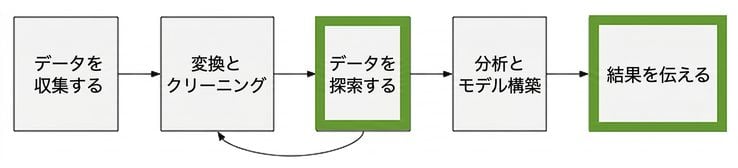
Picture of a data analysis workflow

Seaborn を使ったデータ可視化入門

Seabornの利点

  • 使いやすい
  • pandas のデータ構造と相性が良い
  • matplotlib を基盤として構築されている
Seaborn を使ったデータ可視化入門

はじめに

import seaborn as sns

import matplotlib.pyplot as plt

Samuel Norman Seaborn (sns)

  • テレビドラマ「ザ・ホワイトハウス」
Seaborn を使ったデータ可視化入門

例 1: 散布図

import seaborn as sns
import matplotlib.pyplot as plt

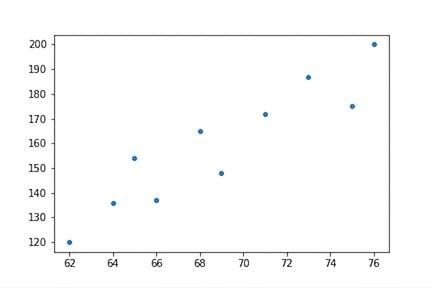
height = [62, 64, 69, 75, 66, 68, 65, 71, 76, 73] weight = [120, 136, 148, 175, 137, 165, 154, 172, 200, 187]
sns.scatterplot(x=height, y=weight)
plt.show()

Scatter plot of height vs. weight

Seaborn を使ったデータ可視化入門

例 2: カウントプロットを作成する

import seaborn as sns
import matplotlib.pyplot as plt

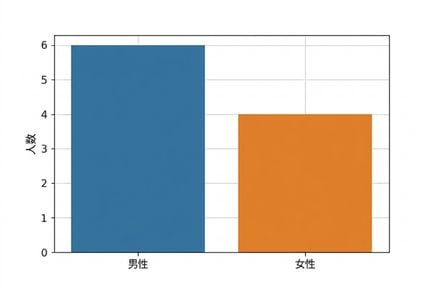
gender = ["Female", "Female", "Female", "Female", "Male", "Male", "Male", "Male", "Male", "Male"]
sns.countplot(x=gender)
plt.show()

性別のカウントプロット

Seaborn を使ったデータ可視化入門

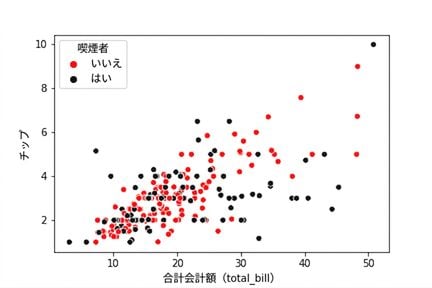
Scatter plot with black and red hue colors

Line plot with markers and solid lines

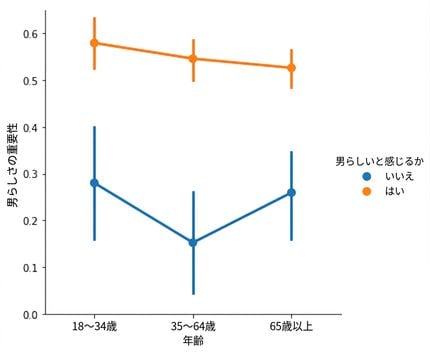
Point plot of masculinity with hue

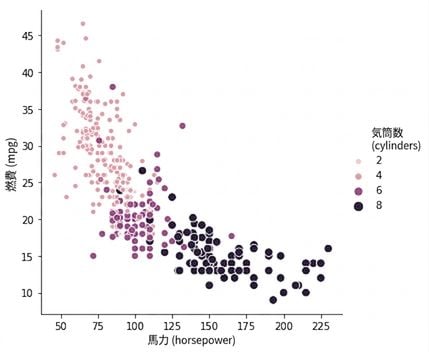
Scatter plot of horsepower vs. mpg with sequential palette

1 Waskom, M. L. (2021). seaborn: statistical data visualization. https://seaborn.pydata.org/
Seaborn を使ったデータ可視化入門

練習しましょう!

Seaborn を使ったデータ可視化入門

Preparing Video For Download...