カウントプロットと棒グラフ

Seaborn を使ったデータ可視化入門

Content Team

DataCamp

カテゴリプロット
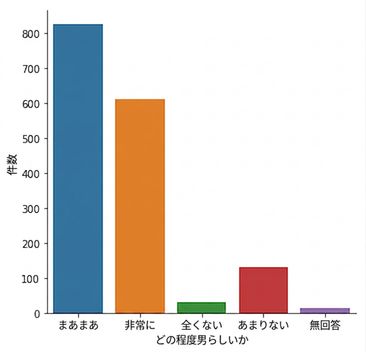
  • 例:カウントプロット、棒グラフ
  • カテゴリ変数を含む
  • グループ間の比較

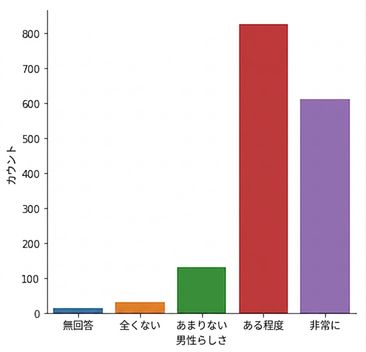
Count plot of masculinity responses

Seaborn を使ったデータ可視化入門

catplot()

  • カテゴリプロットの作成に使用する
  • relplot()と同じ利点がある
  • col= と row=でサブプロットを簡単に作成できる
Seaborn を使ったデータ可視化入門

countplot() と catplot()

import matplotlib.pyplot as plt
import seaborn as sns

sns.countplot(x="how_masculine",
              data=masculinity_data)

plt.show()

Count plot of masculinity responses

Seaborn を使ったデータ可視化入門

countplot() と catplot()

import matplotlib.pyplot as plt
import seaborn as sns

sns.catplot(x="how_masculine",
            data=masculinity_data,
            kind="count")

plt.show()

Count plot of masculinity responses

Seaborn を使ったデータ可視化入門

順序を変更する

import matplotlib.pyplot as plt
import seaborn as sns

category_order = ["No answer", "Not at all", "Not very", "Somewhat", "Very"]
sns.catplot(x="how_masculine", data=masculinity_data, kind="count", order=category_order)
plt.show()

Reordered count plot of masculinity responses

Seaborn を使ったデータ可視化入門

棒グラフ

カテゴリごとの量的変数の平均を表示する

import matplotlib.pyplot as plt
import seaborn as sns

sns.catplot(x="day",
            y="total_bill",
            data=tips,
            kind="bar")

plt.show()

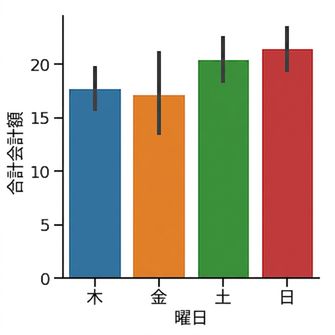
Bar plot of average bill per day

1 Waskom, M. L. (2021). seaborn: statistical data visualization. https://seaborn.pydata.org/
Seaborn を使ったデータ可視化入門

信頼区間

  • 線は平均値の95%信頼区間を示す
  • 推定値の不確実性を示す
  • データが無作為標本であると仮定する

Bar plot of average bill per day

1 Waskom, M. L. (2021). seaborn: statistical data visualization. https://seaborn.pydata.org/
Seaborn を使ったデータ可視化入門

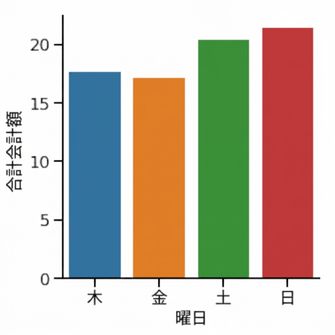
信頼区間を非表示にする

import matplotlib.pyplot as plt
import seaborn as sns

sns.catplot(x="day",
            y="total_bill",
            data=tips,
            kind="bar",
            errorbar=None)

plt.show()

Bar plot with no confidence intervals

1 Waskom, M. L. (2021). seaborn: statistical data visualization. https://seaborn.pydata.org/
Seaborn を使ったデータ可視化入門

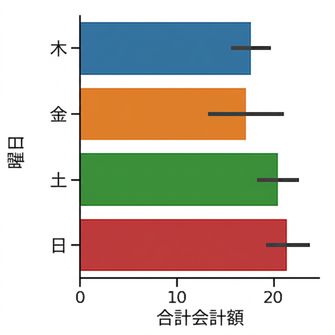
向きを変更する

import matplotlib.pyplot as plt
import seaborn as sns

sns.catplot(x="total_bill",
            y="day",
            data=tips,
            kind="bar")

plt.show()

Horizontal bar plot

1 Waskom, M. L. (2021). seaborn: statistical data visualization. https://seaborn.pydata.org/
Seaborn を使ったデータ可視化入門

練習しましょう!

Seaborn を使ったデータ可視化入門

Preparing Video For Download...