総まとめ

Seaborn を使ったデータ可視化入門

Content Team

DataCamp

はじめに

Seabornをインポートするには:

import seaborn as sns

Matplotlibをインポートするには:

import matplotlib.pyplot as plt

プロットを表示するには:

plt.show()
Seaborn を使ったデータ可視化入門

リレーショナルプロット

  • 2つの量的変数の関係を示す
  • 例:散布図、折れ線グラフ
sns.relplot(x="x_variable_name", 
            y="y_variable_name", 
            data=pandas_df, 
            kind="scatter")
Seaborn を使ったデータ可視化入門

カテゴリプロット

  • カテゴリ変数で分けた各カテゴリにおける量的変数の分布を示す
  • 例:棒グラフ、カウントプロット、箱ひげ図、ポイントプロット
sns.catplot(x="x_variable_name", 
            y="y_variable_name", 
            data=pandas_df, 
            kind="bar")
Seaborn を使ったデータ可視化入門

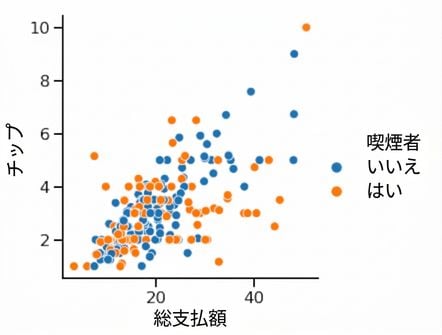
hueで3つ目の変数を追加する

hue を設定すると、サブグループが作成され、1つのプロット内でそれぞれ異なる色で表示されます。

Scatter plot with hue

1 Waskom, M. L. (2021). seaborn: statistical data visualization. https://seaborn.pydata.org/
Seaborn を使ったデータ可視化入門

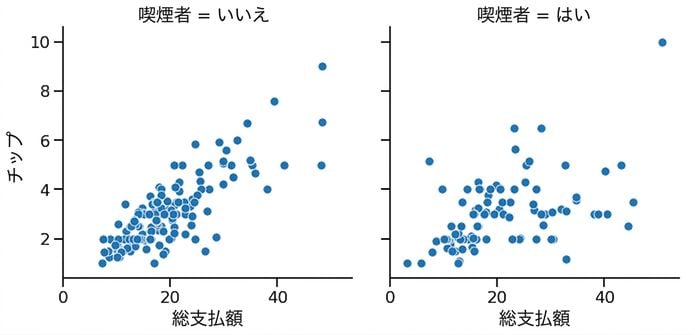
3つ目の変数を追加する(row/col)

relplot() または catplot() で row や col、またはその両方を設定すると、サブグループが作成され、それぞれ別のサブプロットに表示されます。

Scatter plot with subplots

1 Waskom, M. L. (2021). seaborn: statistical data visualization. https://seaborn.pydata.org/
Seaborn を使ったデータ可視化入門

カスタマイズ

  • 背景を変更する: sns.set_style()
  • メイン要素の色を変更する: sns.set_palette()
  • スケールを変更する: sns.set_context()
Seaborn を使ったデータ可視化入門

タイトルを追加する

オブジェクトの型 プロットの種類 タイトルの追加方法
FacetGrid relplot(), catplot() g.figure.suptitle()
AxesSubplot scatterplot()、countplot()、など g.set_title()
Seaborn を使ったデータ可視化入門

最後の仕上げ

x軸とy軸にラベルを追加する:

g.set(xlabel="new x-axis label",
      ylabel="new y-axis label")

x軸の目盛りラベルを回転する:

plt.xticks(rotation=90)
Seaborn を使ったデータ可視化入門

練習しましょう!

Seaborn を使ったデータ可視化入門

Preparing Video For Download...