散らばりの尺度

Rで学ぶ統計入門

Maggie Matsui

Content Developer, DataCamp

散らばりとは?
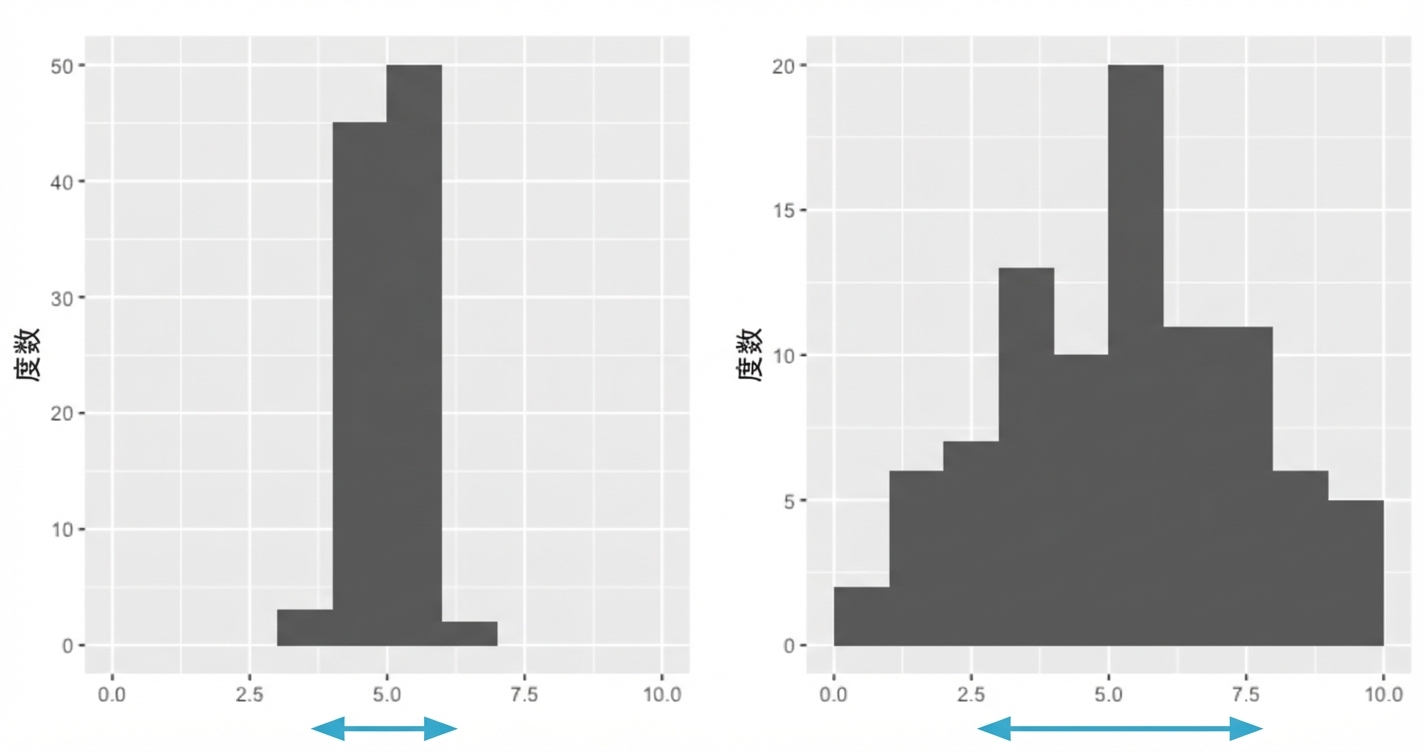
2つのヒストグラム:一方は狭く少数の値に集中,もう一方は広く多くの値に分布。

Rで学ぶ統計入門

分散

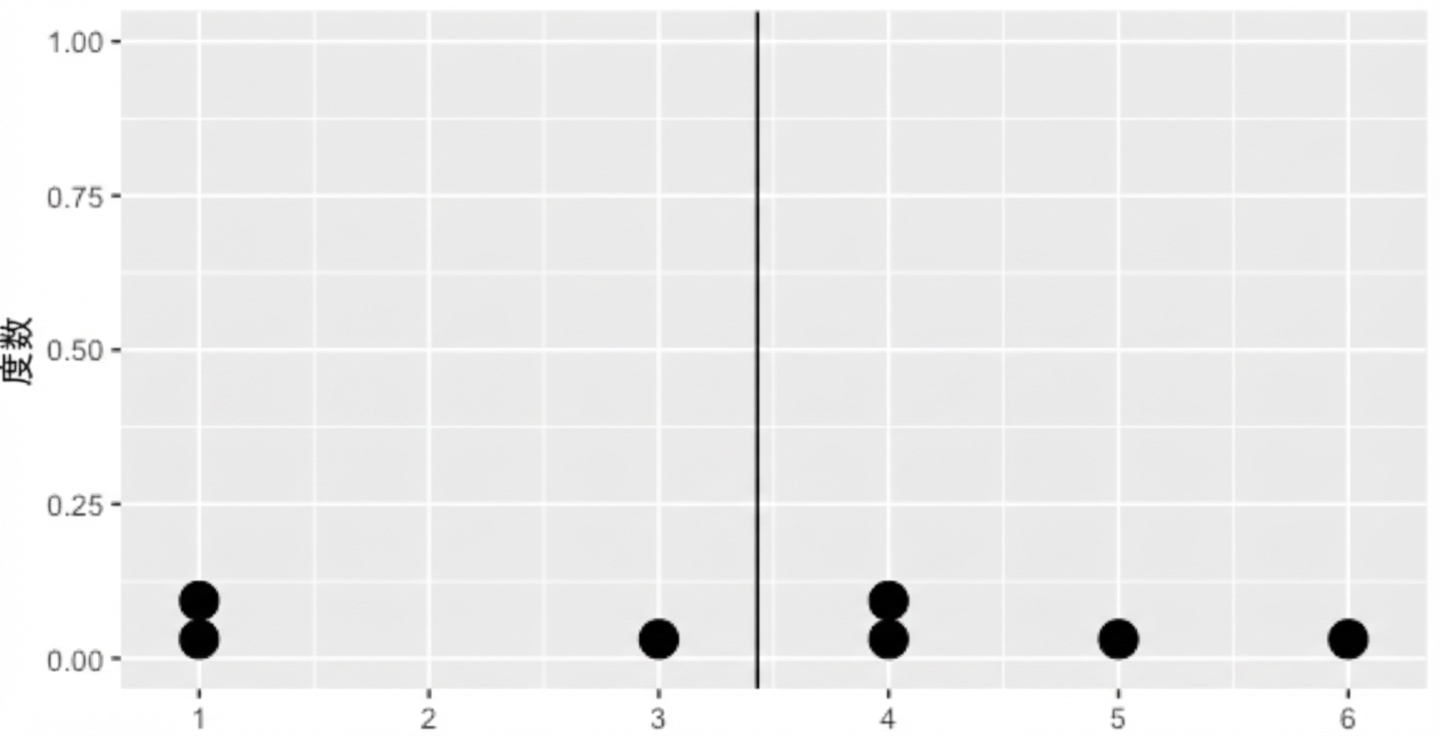
各データ点と平均の平均距離 7つのデータ点のドットプロット。中央の黒線が平均を示す。

Rで学ぶ統計入門

分散の計算

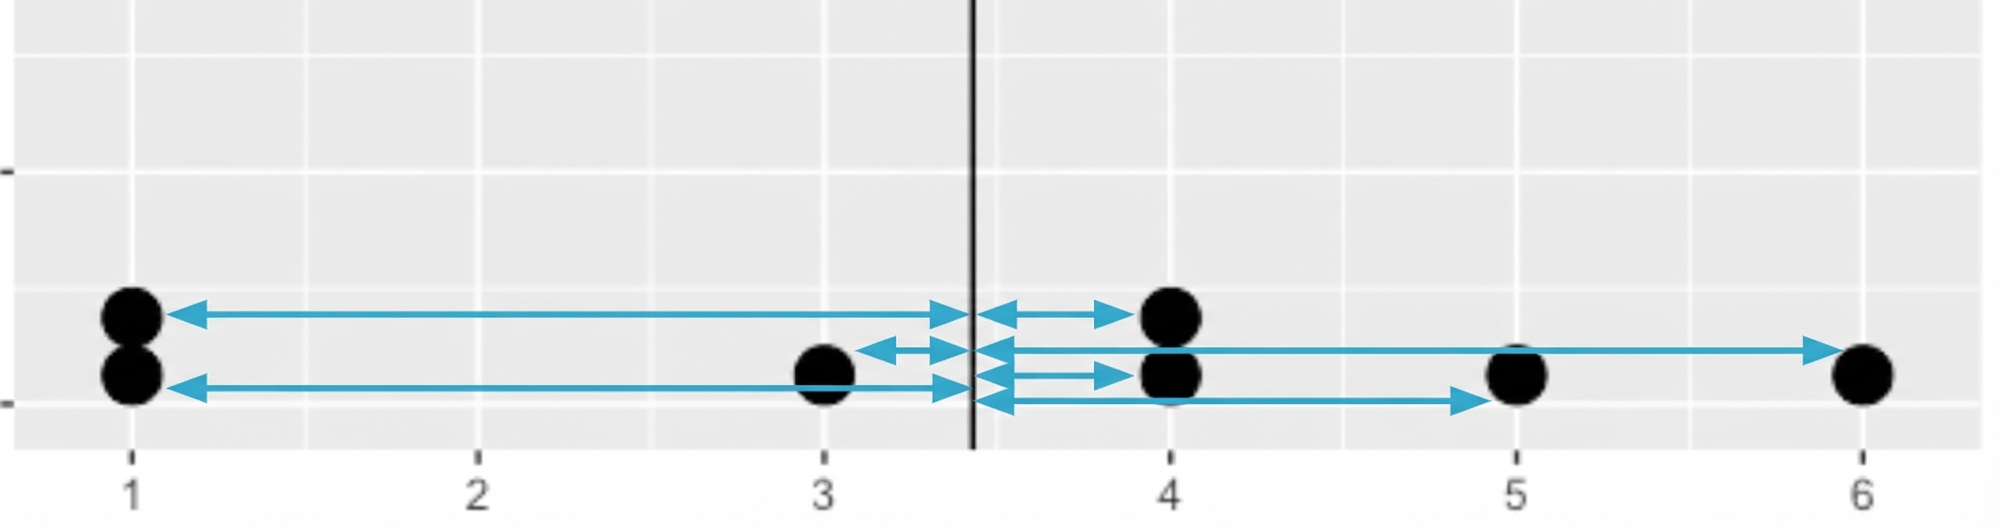
7つのデータ点のドットプロット。中央の黒線が平均を示す。各点と中央線の間に矢印。

dists <- msleep$sleep_total - mean(msleep$sleep_total)
dists
1.66626506  6.56626506 ... -4.13373494  2.06626506 -0.63373494
Rで学ぶ統計入門

分散の計算

squared_dists <- (dists)^2
2.776439251 43.115836841 ... 17.087764552  4.269451299  0.401619974
sum_sq_dists <- sum(squared_dists)
sum_sq_dists
1624.066
Rで学ぶ統計入門

分散の計算

sum_sq_dists/82
19.80568
var(msleep$sleep_total)
19.80568
Rで学ぶ統計入門

標準偏差

sqrt(var(msleep$sleep_total))
4.450357
# 'sleep_total' の標準偏差
sd(msleep$sleep_total)
4.450357
Rで学ぶ統計入門

平均絶対偏差

dists <- msleep$sleep_total - mean(msleep$sleep_total)
mean(abs(dists))
3.566701


標準偏差 vs. 平均絶対偏差

  • 標準偏差は距離を二乗し、遠い値をより強く罰する。
  • MAD は各距離を等しく扱う。
  • 優劣はないが、標準偏差の方が一般的。
Rで学ぶ統計入門

四分位数

quantile(msleep$sleep_total)
   0%   25%   50%   75%  100% 
 1.90  7.85 10.10 13.75 19.90

第2四分位=50パーセンタイル=中央値

Rで学ぶ統計入門

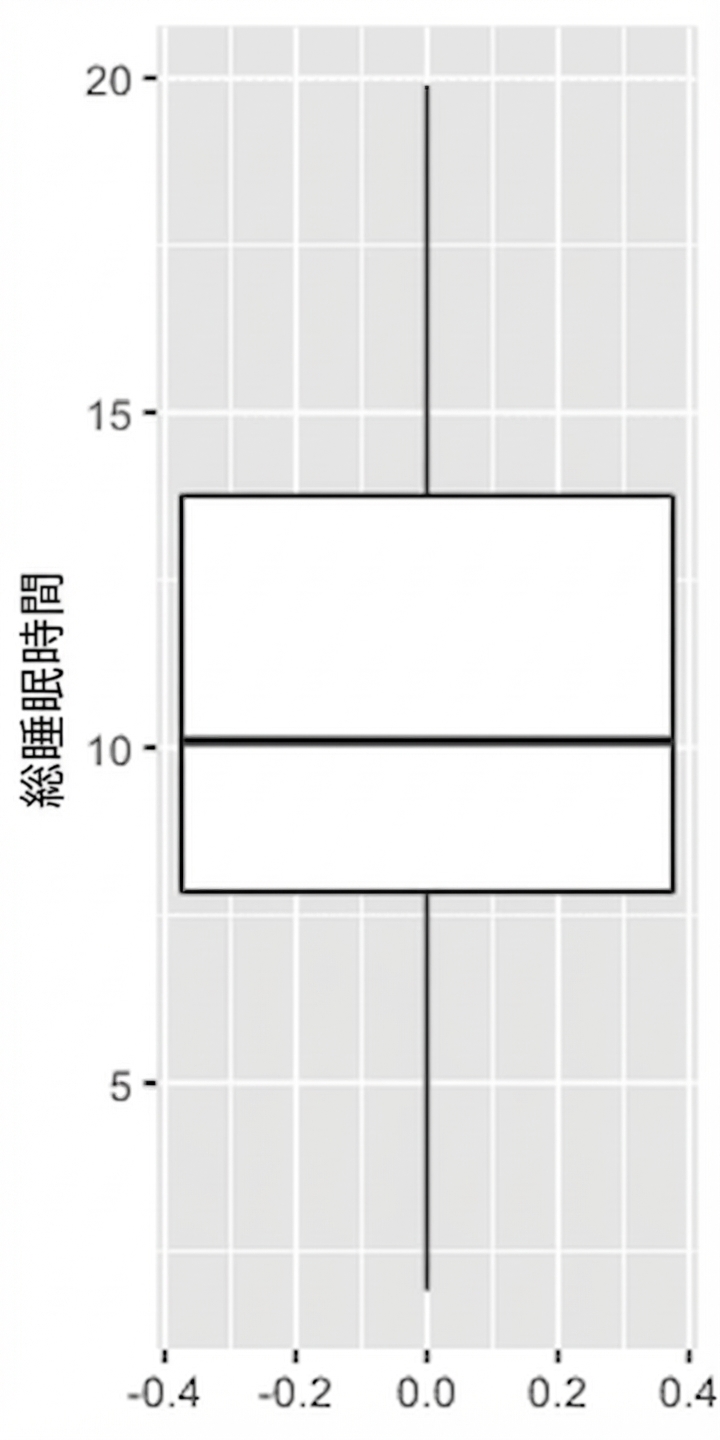
箱ひげ図は四分位数を利用

ggplot(msleep, aes(y = sleep_total)) +
  geom_boxplot()

哺乳類の総睡眠時間の箱ひげ図

Rで学ぶ統計入門

分位点(Quantiles)

quantile(msleep$sleep_total, probs = c(0, 0.2, 0.4, 0.6, 0.8, 1))
   0%   20%   40%   60%   80%  100% 
 1.90  6.24  9.48 11.14 14.40 19.90

seq(from, to, by)

quantile(msleep$sleep_total, probs = seq(0, 1, 0.2))
   0%   20%   40%   60%   80%  100% 
 1.90  6.24  9.48 11.14 14.40 19.90
Rで学ぶ統計入門

四分位範囲(IQR)

箱ひげ図の箱の高さ

iqr = quantile(msleep$sleep_total, 0.75) - quantile(msleep$sleep_total, 0.25)
iqr
75%
5.9
Rで学ぶ統計入門

外れ値

外れ値: 他と大きく異なるデータ点

何を「大きく異なる」とみなすか? 次のとき外れ値とする:

  • $\text{data} < \text{Q1} - 1.5\times\text{IQR}$    または
  • $\text{data} > \text{Q3} + 1.5\times\text{IQR}$
Rで学ぶ統計入門

外れ値の検出

iqr <- quantile(msleep$bodywt, 0.75) - quantile(msleep$bodywt, 0.25)

lower_threshold <- quantile(msleep$bodywt, 0.25) - 1.5 * iqr upper_threshold<- quantile(msleep$bodywt, 0.75) + 1.5 * iqr
msleep %>% filter(bodywt < lower_threshold | bodywt > upper_threshold ) %>% 
  select(name, vore, sleep_total, bodywt)
# A tibble: 11 x 4
   name                 vore  sleep_total bodywt
   <chr>                <chr>       <dbl>  <dbl> 
 1 Cow                  herbi         4      600 
 2 Asian elephant       herbi         3.9   2547 
 3 Horse                herbi         2.9    521 
 ...
Rで学ぶ統計入門

練習しましょう!

Rで学ぶ統計入門

Preparing Video For Download...