ロジスティック回帰の適合度を定量化
Rで学ぶ回帰入門

Richie Cotton
Data Evangelist at DataCamp
4つの結果
| 実際: 偽 | 実際: 真 | |
|---|---|---|
| 予測: 偽 | 正解 | 偽陰性 |
| 予測: 真 | 偽陽性 | 正解 |
混同行列:結果の件数
mdl_recency <- glm(has_churned ~ time_since_last_purchase, data = churn, family = "binomial")
actual_response <- churn$has_churned
predicted_response <- round(fitted(mdl_recency))
outcomes <- table(predicted_response, actual_response)
                  actual_response
predicted_response   0   1
                 0 141 111
                 1  59  89
混同行列の可視化:モザイク図
library(ggplot2)
library(yardstick)
confusion <- conf_mat(outcomes)
                  actual_response
predicted_response   0   1
                 0 141 111
                 1  59  89
autoplot(confusion)
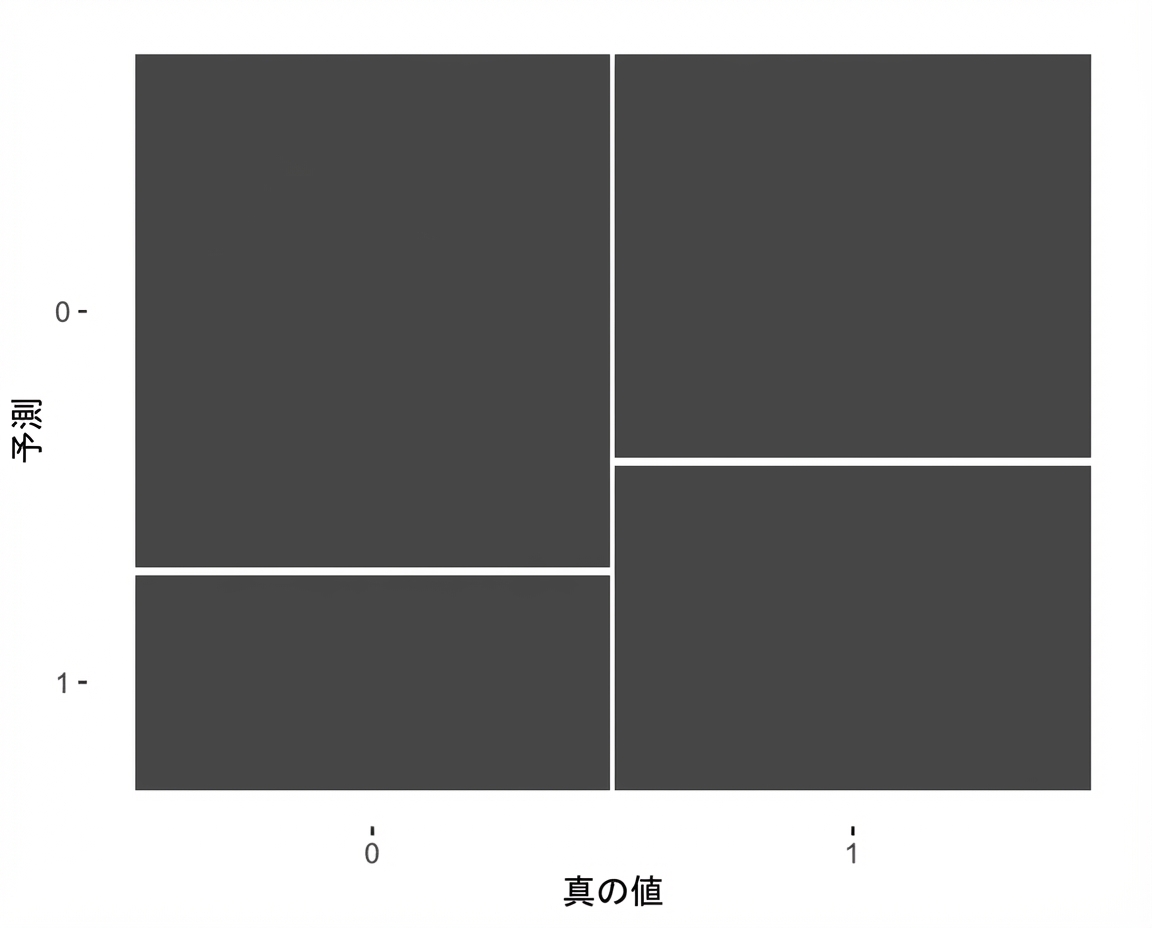
評価指標
summary(confusion, event_level = "second")
# A tibble: 13 x 3
   .metric              .estimator .estimate
   <chr>                <chr>          <dbl>
 1 accuracy             binary         0.575
 2 kap                  binary         0.150
 3 sens                 binary         0.445
 4 spec                 binary         0.705
 5 ppv                  binary         0.601
 6 npv                  binary         0.560
 7 mcc                  binary         0.155
 8 j_index              binary         0.150
 9 bal_accuracy         binary         0.575
10 detection_prevalence binary         0.37
11 precision            binary         0.601
12 recall               binary         0.445
13 f_meas               binary         0.511
正解率(Accuracy)
summary(confusion) %>%
  slice(1)
# A tibble: 3 x 3
  .metric  .estimator .estimate
  <chr>    <chr>          <dbl>
1 accuracy binary         0.575
「Accuracy(正解率)」は、正しく予測した割合です。
$$ accuracy = \frac{TN + TP}{TN + FN + FP + TP} $$
confusion
                  actual_response
predicted_response   0   1
                 0 141 111
                 1  59  89
(141 + 89) / (141 + 111 + 59 + 89)
0.575
感度(Sensitivity)
summary(confusion) %>%
  slice(3)
# A tibble: 1 x 3
  .metric .estimator .estimate
  <chr>   <chr>          <dbl>
1 sens    binary         0.445
「Sensitivity(再現率)」は、真の陽性の割合です。
$$ sensitivity = \frac{TP}{FN + TP} $$
confusion
                  actual_response
predicted_response   0   1
                 0 141 111
                 1  59  89
89 / (111 + 89)
0.445
特異度(Specificity)
summary(confusion) %>%
  slice(4)
# A tibble: 1 x 3
  .metric .estimator .estimate
  <chr>   <chr>          <dbl>
1 spec    binary         0.705
「Specificity(特異度)」は、真の陰性の割合です。
$$ specificity = \frac{TN}{TN + FP} $$
confusion
                  actual_response
predicted_response   0   1
                 0 141 111
                 1  59  89
141 / (141 + 59)
0.705
Let's practice!
Rで学ぶ回帰入門

