予測を行う

Rで学ぶ回帰入門

Richie Cotton

Data Evangelist at DataCamp

fish データセット:Bream

bream <- fish %>% 
  filter(species == "Bream")
species length_cm mass_g
Bream 23.2 242
Bream 24.0 290
Bream 23.9 340
Bream 26.3 363
Bream 26.5 430
... ... ...
Rで学ぶ回帰入門

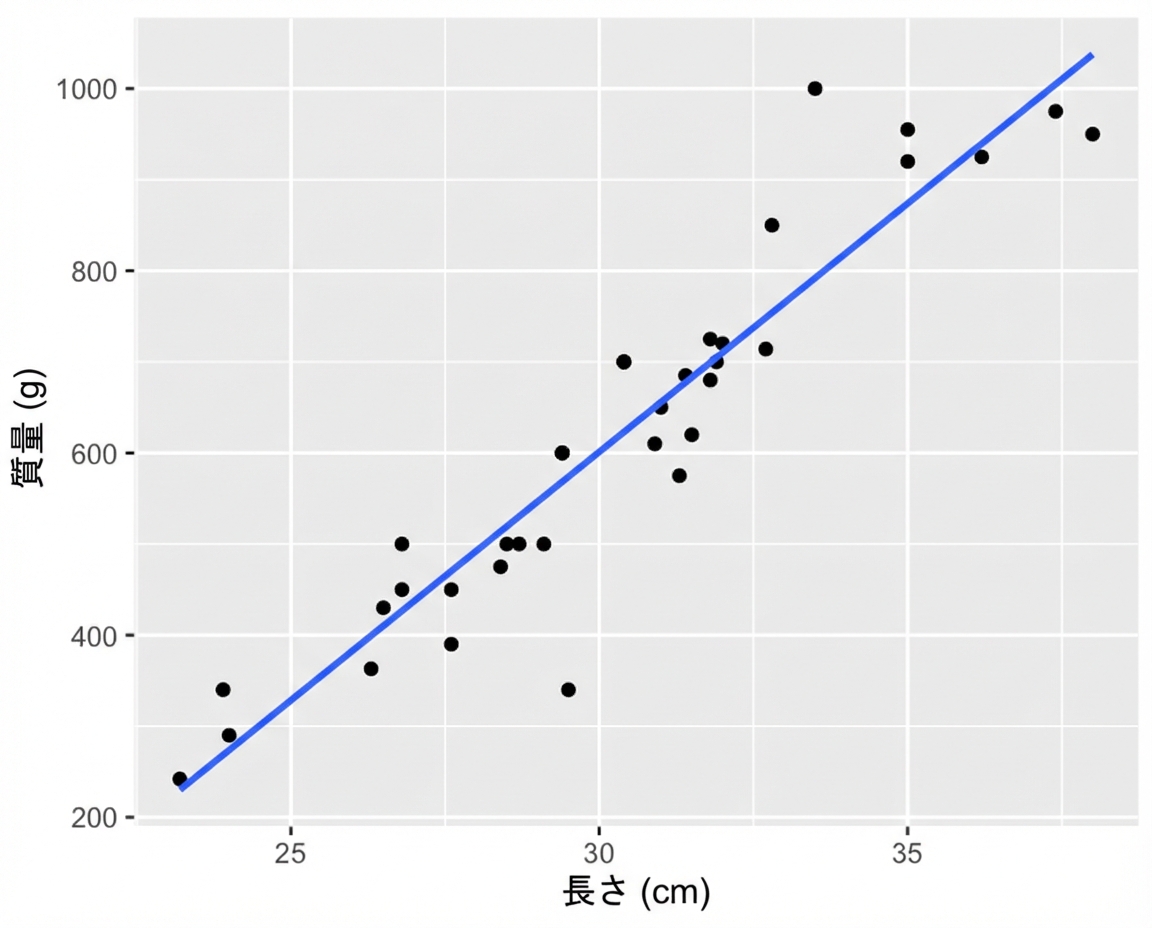
質量と長さのプロット

ggplot(bream, aes(length_cm, mass_g)) +
  geom_point() +
  geom_smooth(method = "lm", se = FALSE)

タイの質量と長さの散布図。線形トレンドラインあり。点はラインの近くに分布。

Rで学ぶ回帰入門

モデルの実行

mdl_mass_vs_length <- lm(mass_g ~ length_cm, data = bream)
Call:
lm(formula = mass_g ~ length_cm, data = bream)

Coefficients:
(Intercept)    length_cm  
   -1035.35        54.55 
Rで学ぶ回帰入門

予測用の説明変数データ

説明変数をこれらの値にしたら、
応答変数はいくつになりますか?

library(dplyr)
explanatory_data <- tibble(length_cm = 20:40)
Rで学ぶ回帰入門

predict() を呼ぶ

library(tibble)
explanatory_data <- tibble(length_cm = 20:40)
predict(mdl_mass_vs_length, explanatory_data)
         1          2          3          4          5          6 
  55.65205  110.20203  164.75202  219.30200  273.85198  328.40196 
         7          8          9         10         11         12 
 382.95194  437.50192  492.05190  546.60188  601.15186  655.70184 
        13         14         15         16         17         18 
 710.25182  764.80181  819.35179  873.90177  928.45175  983.00173 
        19         20         21 
1037.55171 1092.10169 1146.65167 
Rで学ぶ回帰入門

データフレーム内で予測する

library(dplyr)
explanatory_data <- tibble(length_cm = 20:40)
prediction_data <- explanatory_data %>% 
  mutate(
    mass_g = predict(
      mdl_mass_vs_length, explanatory_data
    )
  )
# A tibble: 21 x 2
   length_cm mass_g
       <int>  <dbl>
 1        20   55.7
 2        21  110. 
 3        22  165. 
 4        23  219. 
 5        24  274. 
 6        25  328. 
 7        26  383. 
 8        27  438. 
 9        28  492. 
10        29  547. 
# ... with 11 more rows
Rで学ぶ回帰入門

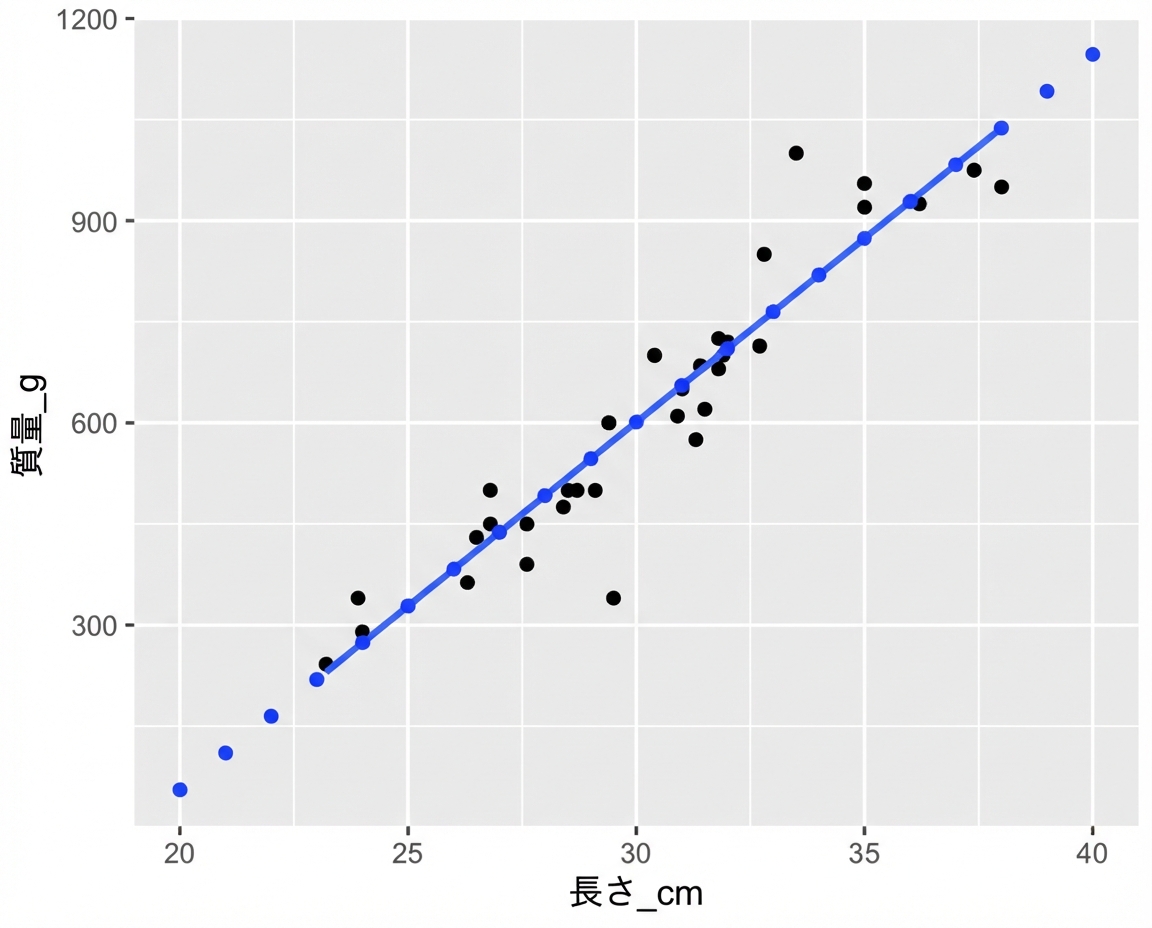
予測の表示

ggplot(bream, aes(length_cm, mass_g)) +
  geom_point() +
  geom_smooth(method = "lm", se = FALSE) +
  geom_point(
    data = prediction_data, 
    color = "blue"
  )

タイの質量と長さの散布図。線形トレンドラインあり。predict() で計算した点を注釈。これらの点はトレンドライン上に一致。

Rで学ぶ回帰入門

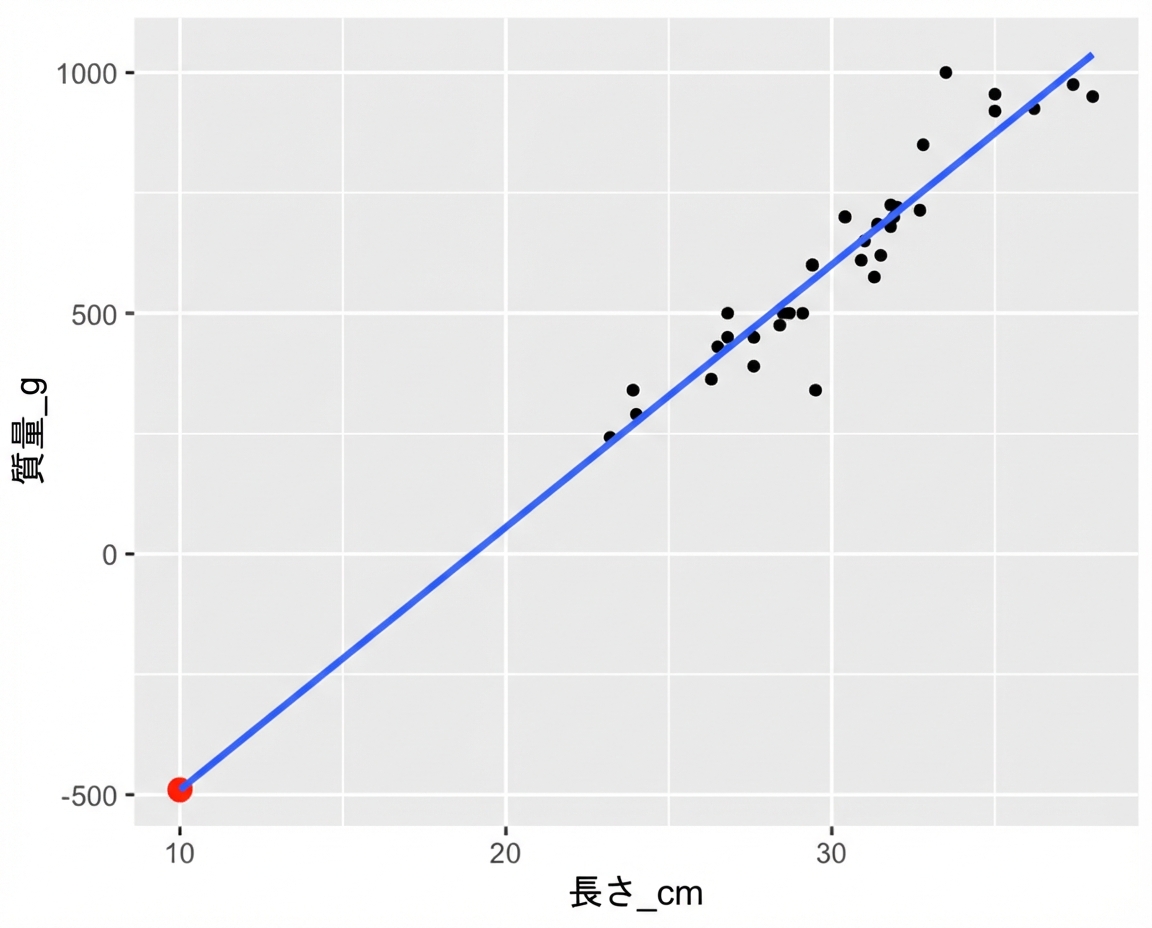
外挿

「外挿」とは、観測範囲の外で予測することです。

explanatory_little_bream <- tibble(length_cm = 10)
explanatory_little_bream %>% 
  mutate(
    mass_g = predict(
      mdl_mass_vs_length, explanatory_little_bream
    )
  )
# A tibble: 1 x 2
  length_cm mass_g
      <dbl>  <dbl>
1        10  -490.

scatter-bream-mass-vs-length-extrapolate.png

Rで学ぶ回帰入門

Passons à la pratique !

Rで学ぶ回帰入門

Preparing Video For Download...