Rで学ぶ回帰入門
Richie Cotton
Data Evangelist at DataCamp
library(ggplot2)

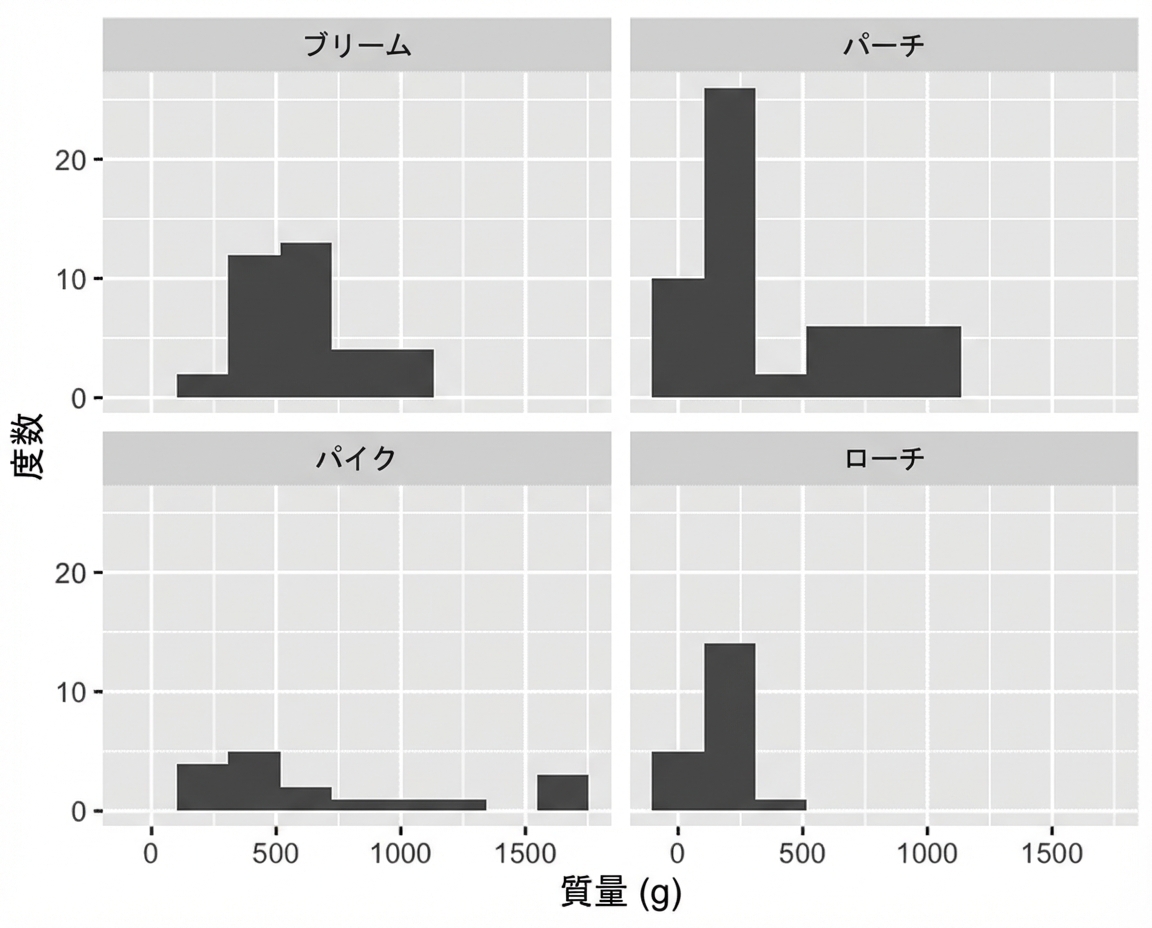
ggplot(fish, aes(mass_g)) +
  geom_histogram(bins = 9) +
  facet_wrap(vars(species))
fish %>%
  group_by(species) %>%
  summarize(mean_mass_g = mean(mass_g))
# A tibble: 4 x 2
  species mean_mass_g
  <chr>         <dbl>
1 Bream          618.
2 Perch          382.
3 Pike           719.
4 Roach          152.
lm(mass_g ~ species, data = fish)
Call:
lm(formula = mass_g ~ species, data = fish)

Coefficients:
 (Intercept)  speciesPerch   speciesPike  speciesRoach
       617.8        -235.6         100.9        -465.8
lm(mass_g ~ species + 0, data = fish)
Call:
lm(formula = mass_g ~ species + 0, data = fish)

Coefficients:
speciesBream  speciesPerch   speciesPike  speciesRoach
       617.8         382.2         718.7         152.0