Pythonで学ぶstatsmodelsによる回帰入門
Maarten Van den Broeck
Content Developer at DataCamp
import pandas as pd
print(swedish_motor_insurance.mean())
n_claims             22.904762
total_payment_sek    98.187302
dtype: float64
print(swedish_motor_insurance['n_claims'].corr(swedish_motor_insurance['total_payment_sek']))
0.9128782350234068
予測したい変数。
目的変数の変化を説明する変数。
import matplotlib.pyplot as plt
import seaborn as sns

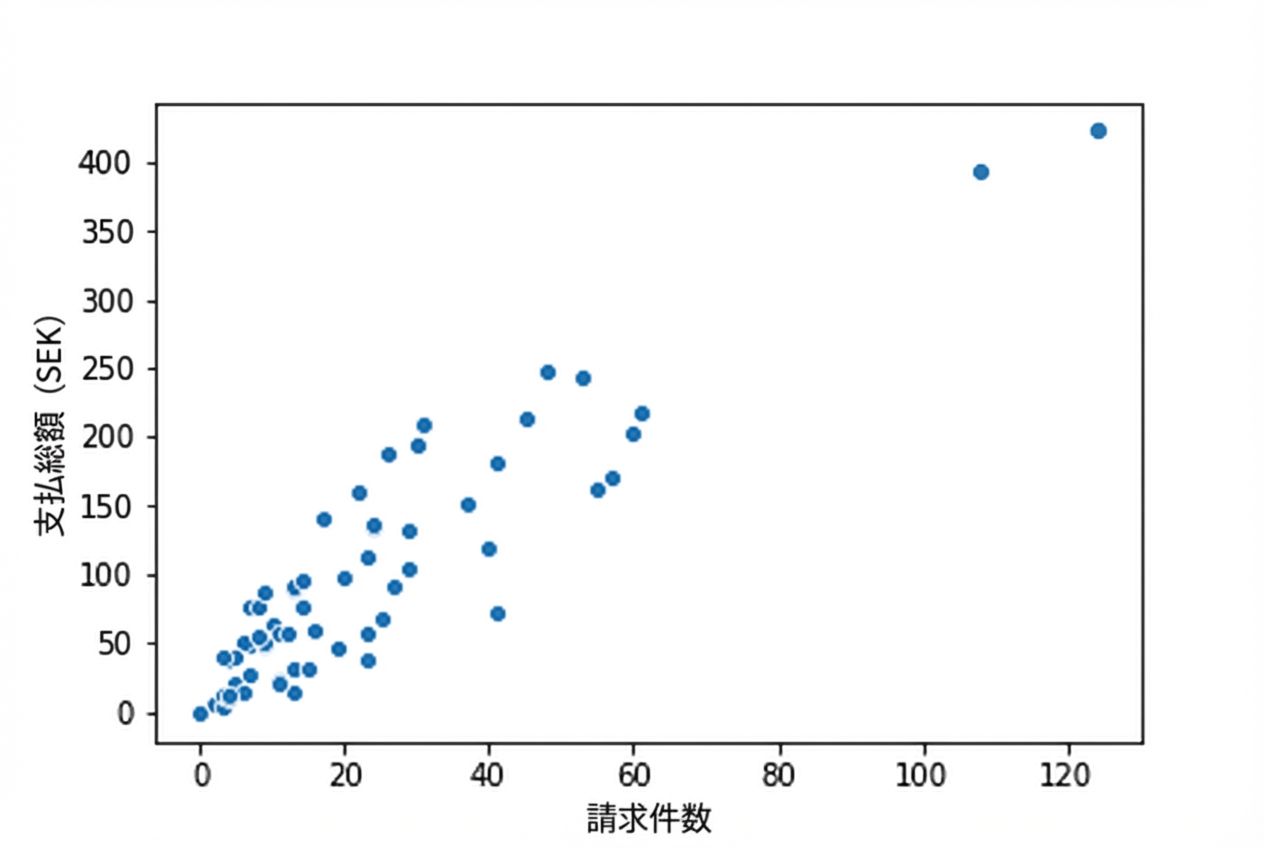
sns.scatterplot(x="n_claims",
                y="total_payment_sek",
                data=swedish_motor_insurance)

plt.show()
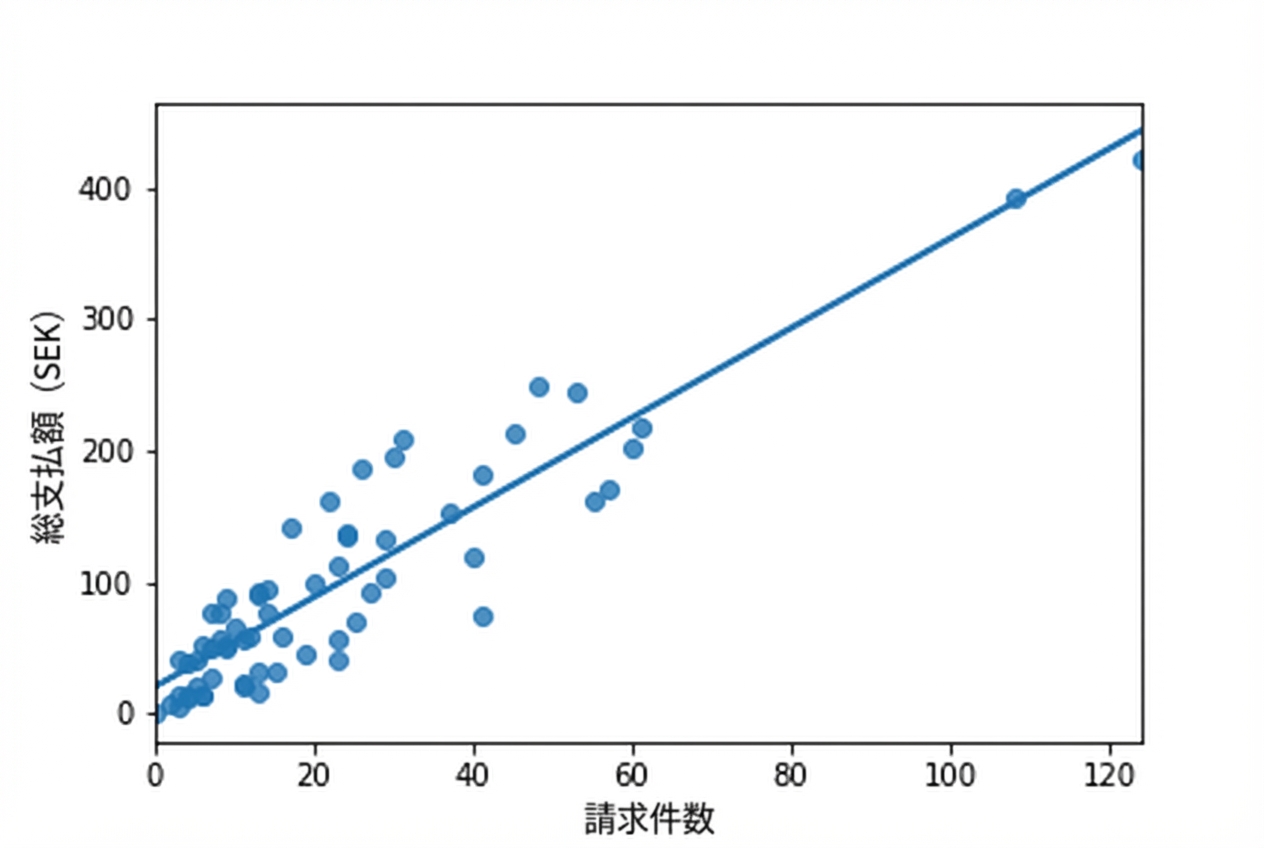
sns.regplot(x="n_claims",
            y="total_payment_sek",
            data=swedish_motor_insurance,
            ci=None)
線形回帰モデルの可視化とフィッティング。
線形回帰モデルによる予測とモデル係数の理解。
線形回帰モデルの品質評価。
ロジスティック回帰モデルについて同様の内容を扱う。
statsmodels
scikit-learn