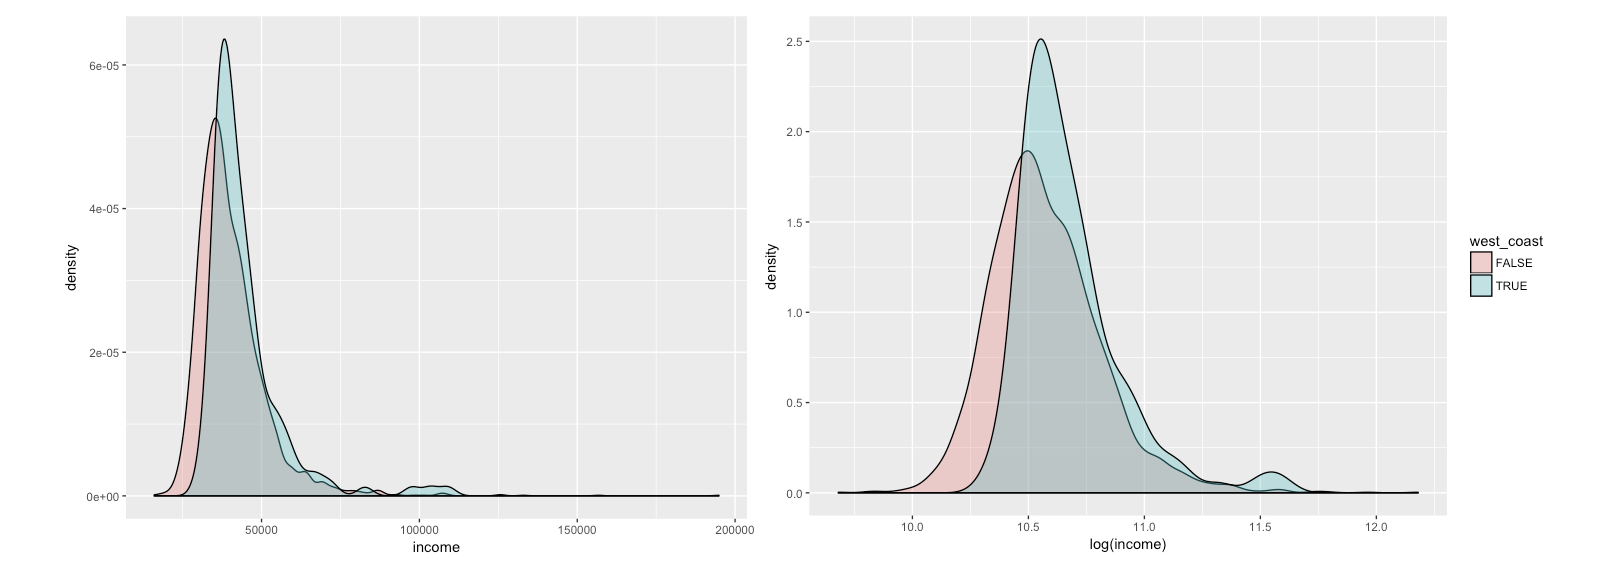
形状と変換
Rで学ぶ探索的データ分析

Andrew Bray
Assistant Professor, Reed College
多峰性
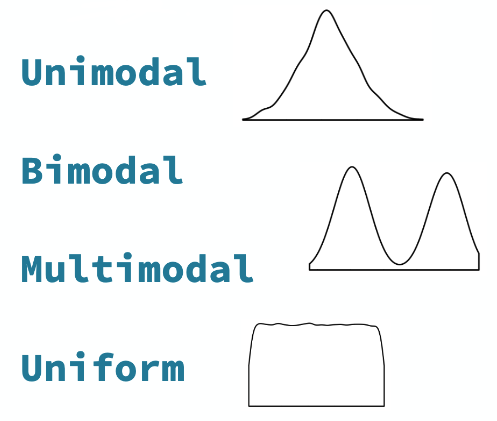
歪度
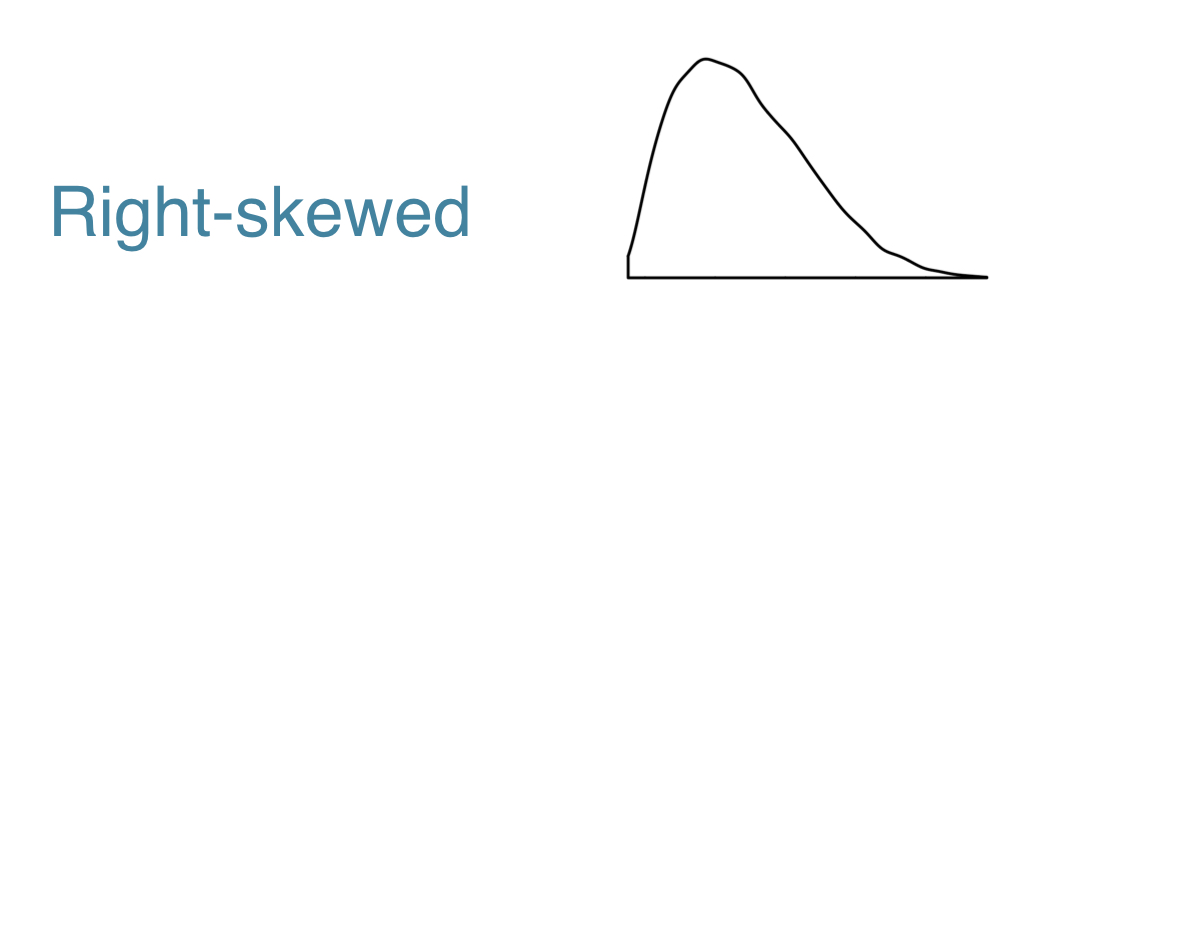
歪度
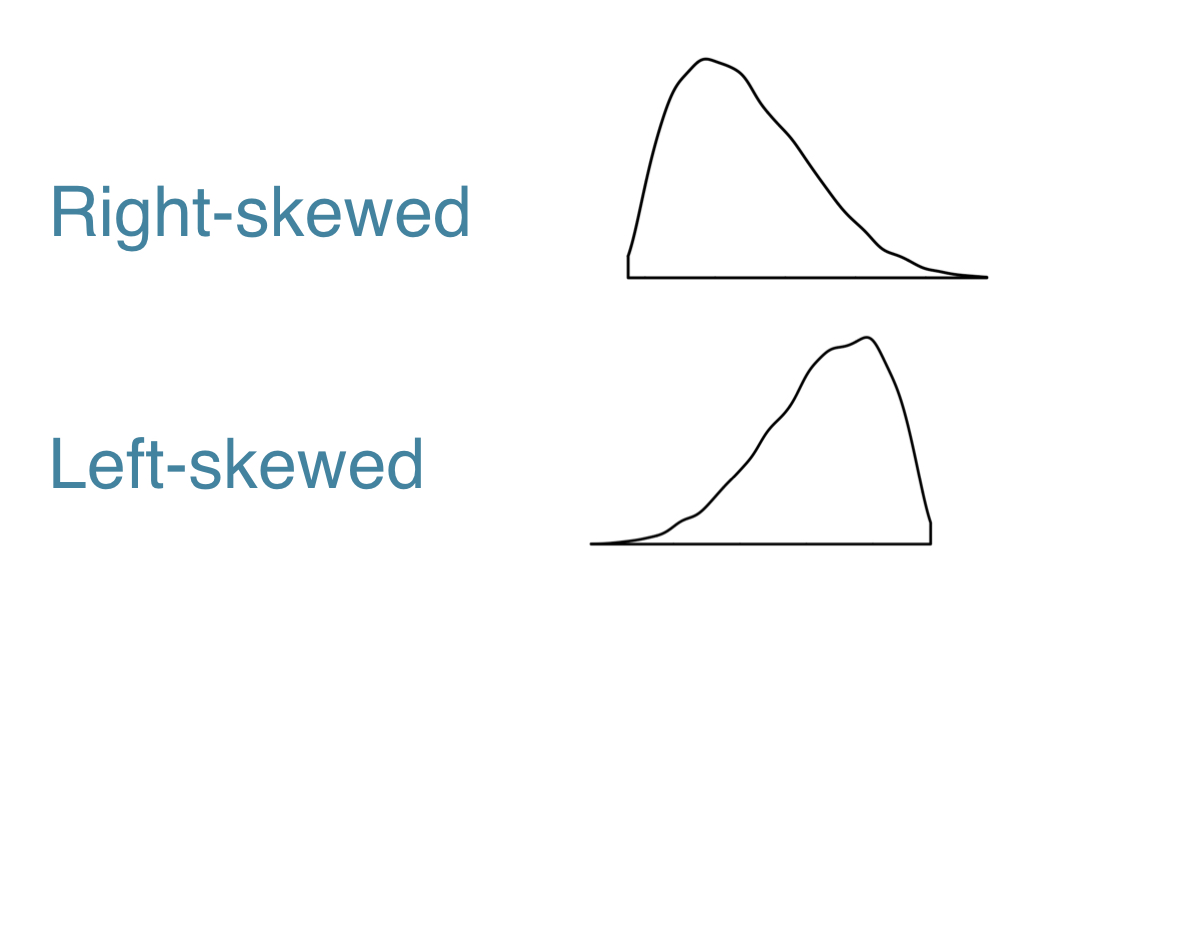
歪度
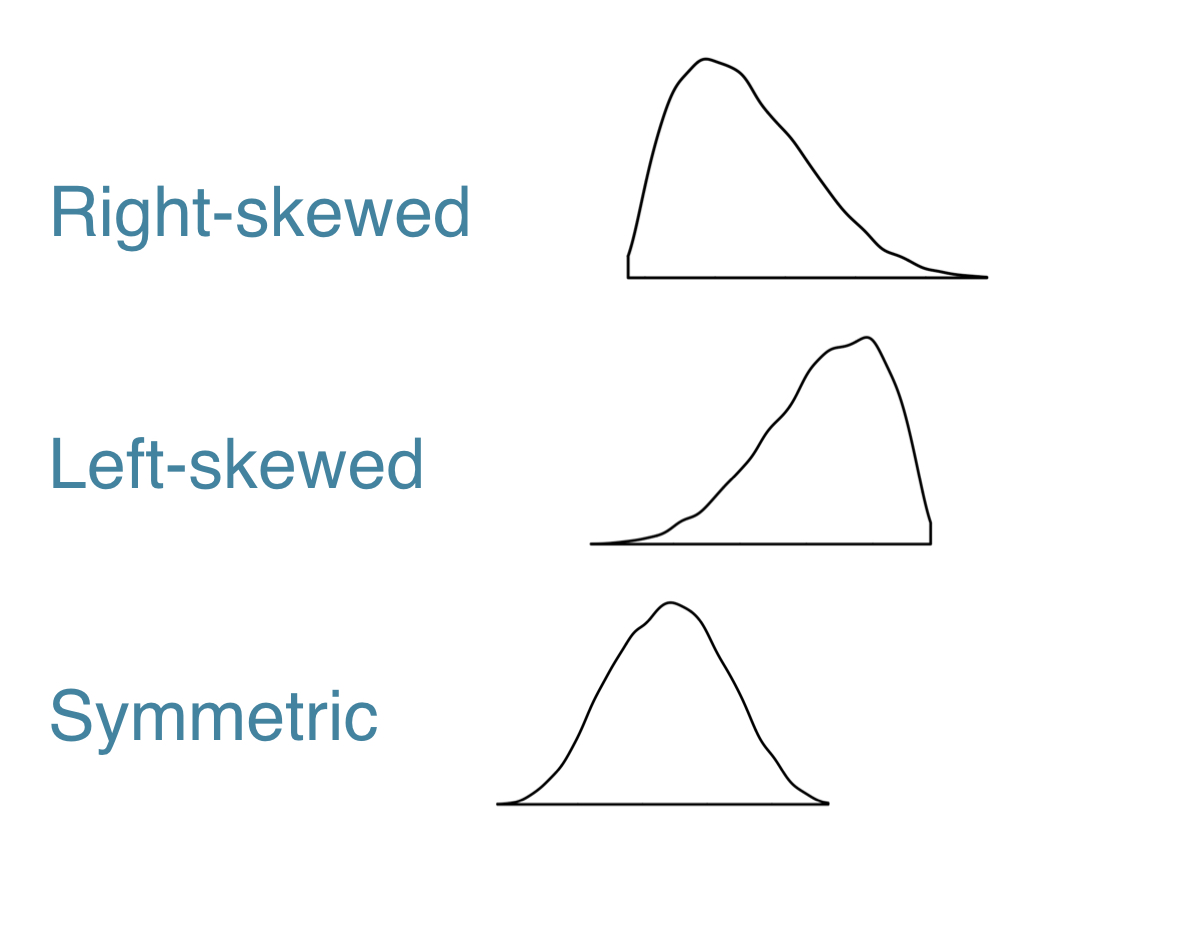
所得の分布形状
ggplot(life, aes(x = income, fill = west_coast)) +
  geom_density(alpha = .3)
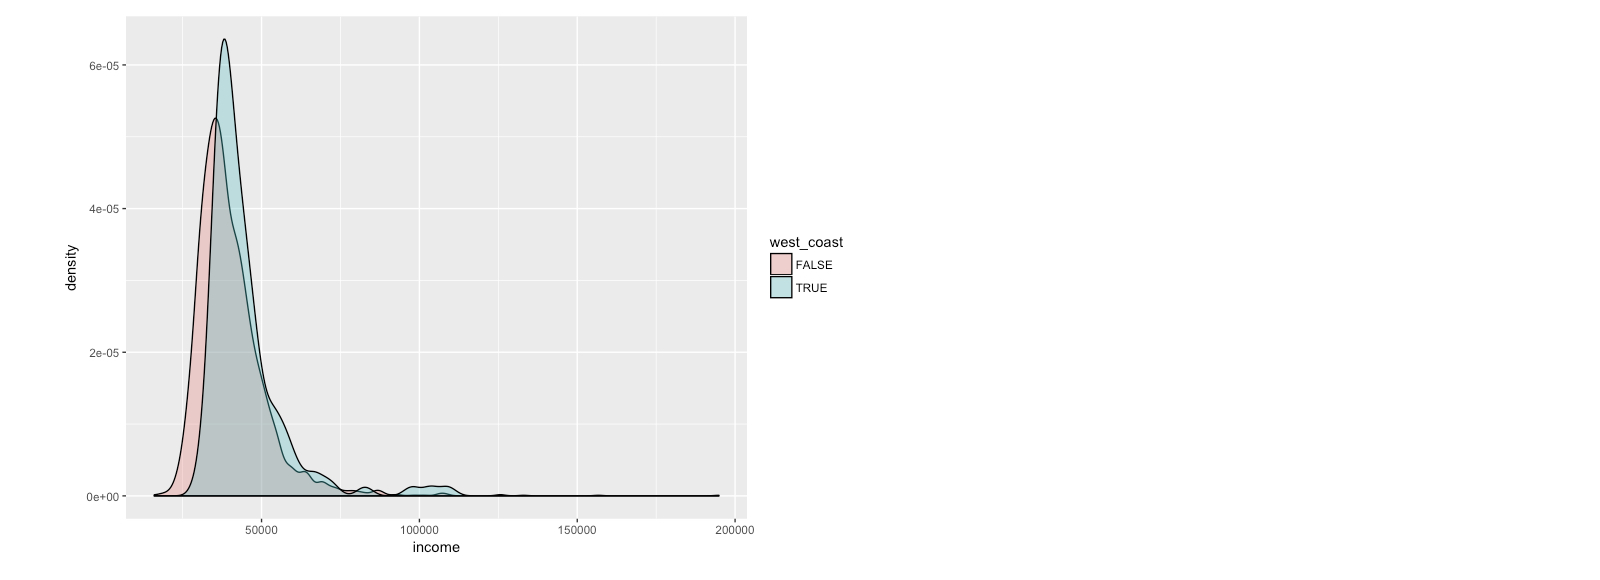
所得の分布形状
ggplot(life, aes(x = income, fill = west_coast)) + geom_density(alpha = .3)ggplot(life, aes(x = log(income), fill = west_coast)) + geom_density(alpha = .3)