1変数の分布
Rで学ぶ探索的データ分析

Andrew Bray
Assistant Professor, Reed College
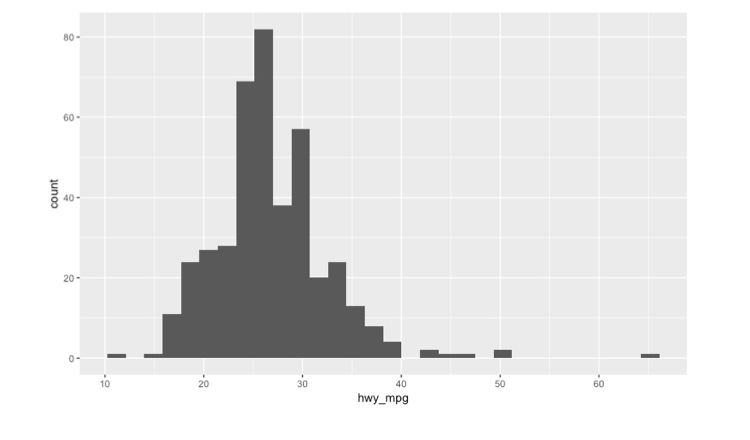
周辺分布 vs 条件付き分布
ggplot(cars, aes(x = hwy_mpg)) +
  geom_histogram()
`stat_bin()` using `bins = 30`. Pick better value with `binwidth`.
Warning message:
Removed 14 rows containing non-finite values (stat_bin).
周辺分布 vs 条件付き分布
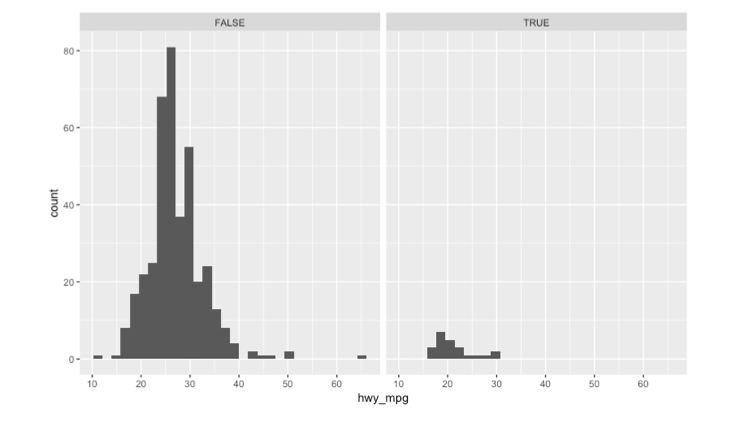
ggplot(cars, aes(x = hwy_mpg)) +
  geom_histogram() +
  facet_wrap(~pickup)
`stat_bin()` using `bins = 30`. Pick better value with `binwidth`.
Warning message:
Removed 14 rows containing non-finite values (stat_bin).
フィルターとファセットのヒストグラム
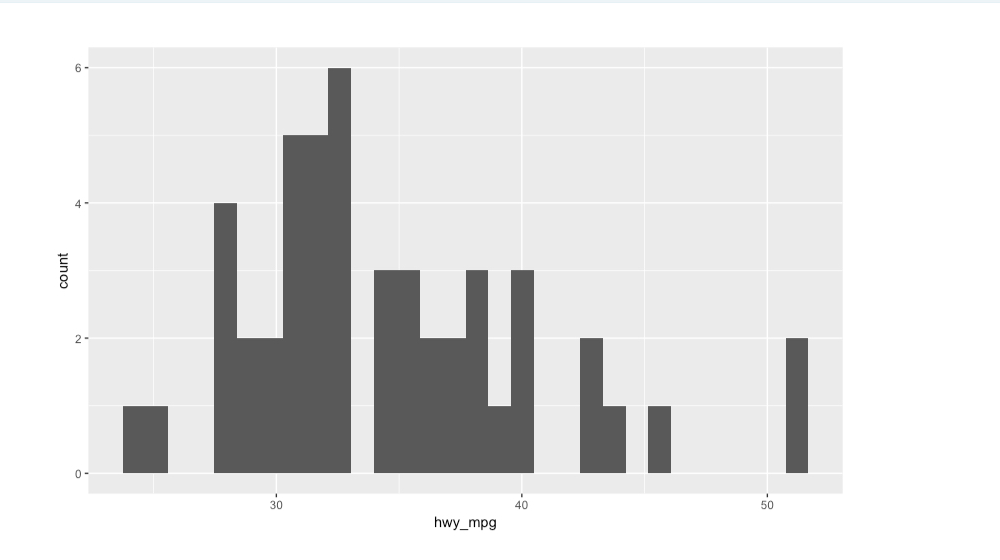
cars %>%
  filter(eng_size < 2.0) %>%
  ggplot(aes(x = hwy_mpg)) +
  geom_histogram()
`stat_bin()` using `bins = 30`. Pick better value with `binwidth`.
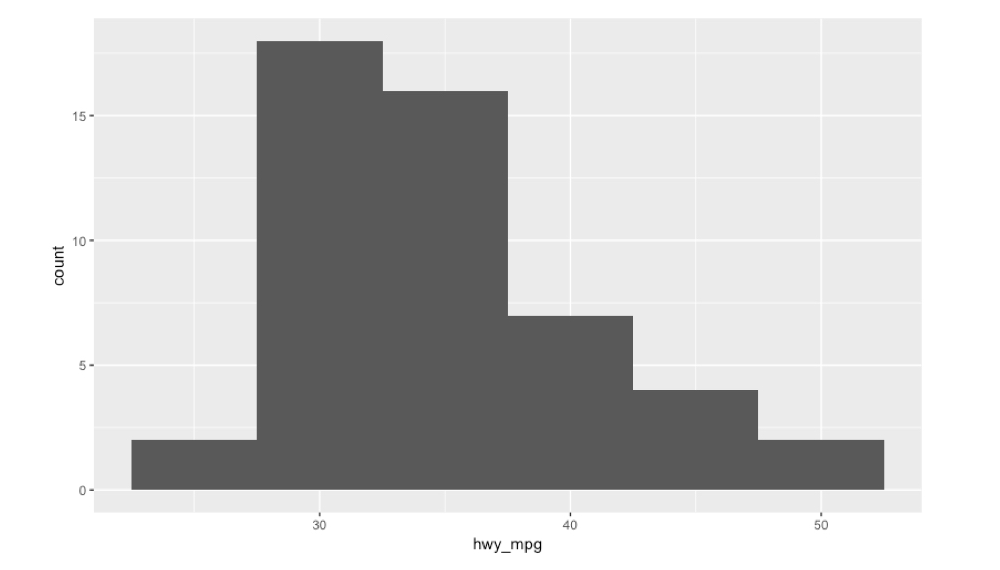
ビン幅が広い
cars %>%
  filter(eng_size < 2.0) %>%
  ggplot(aes(x = hwy_mpg)) +
  geom_histogram(binwidth = 5)
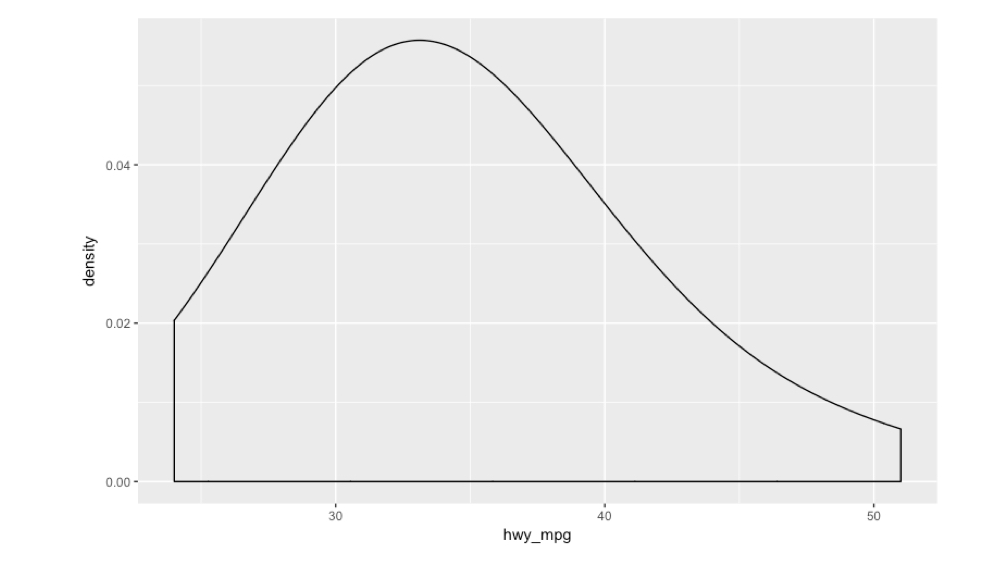
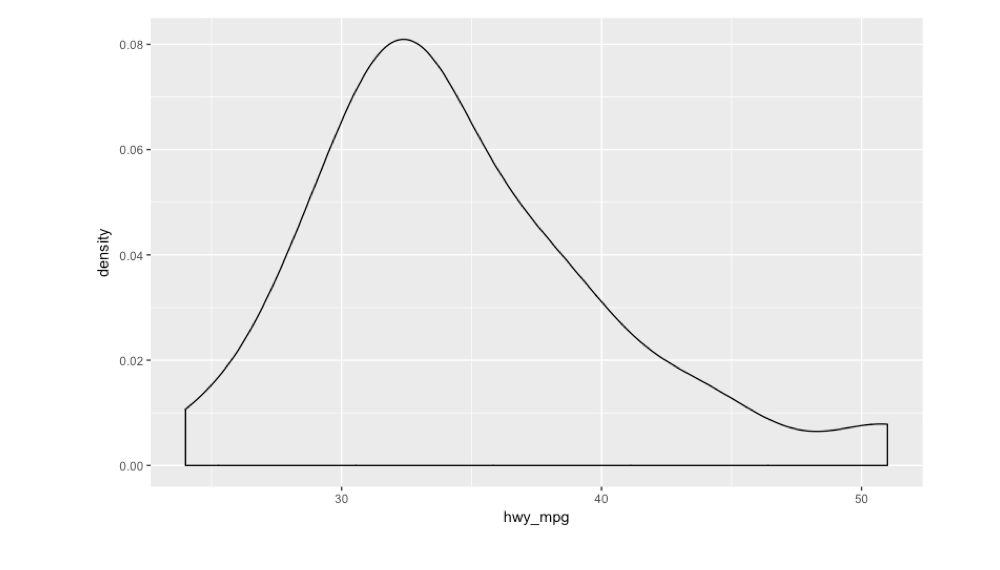
密度プロット
cars %>%
  filter(eng_size < 2.0) %>%
  ggplot(aes(x = hwy_mpg)) +
  geom_density()
帯域幅が広い
cars %>%
  filter(eng_size < 2.0) %>%
  ggplot(aes(x = hwy_mpg)) +
  geom_density(bw = 5)