確認 1
Rで学ぶ探索的データ分析

Andrew Bray
Assistant Professor, Reed College
復習
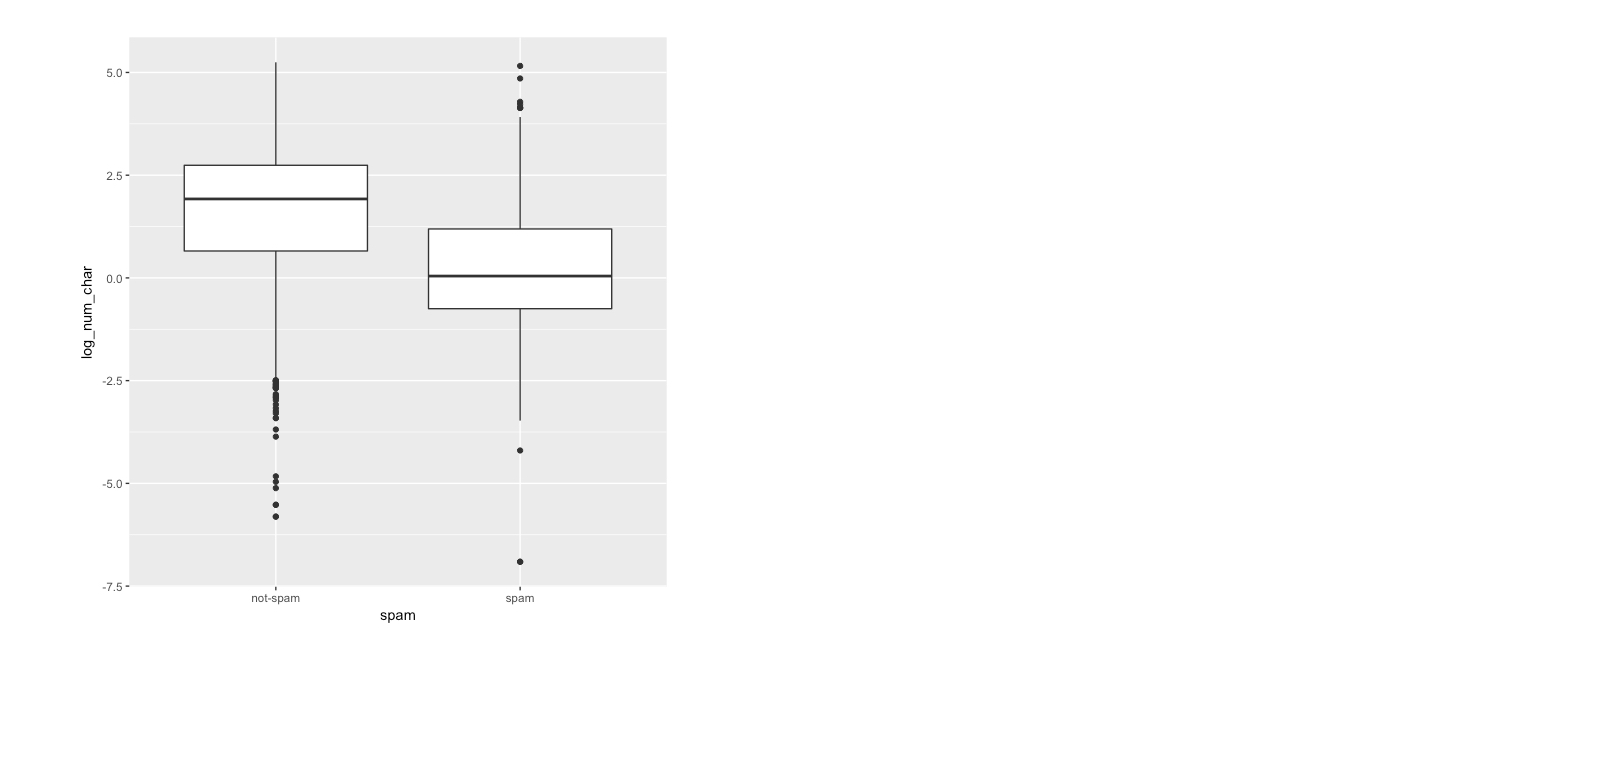
復習
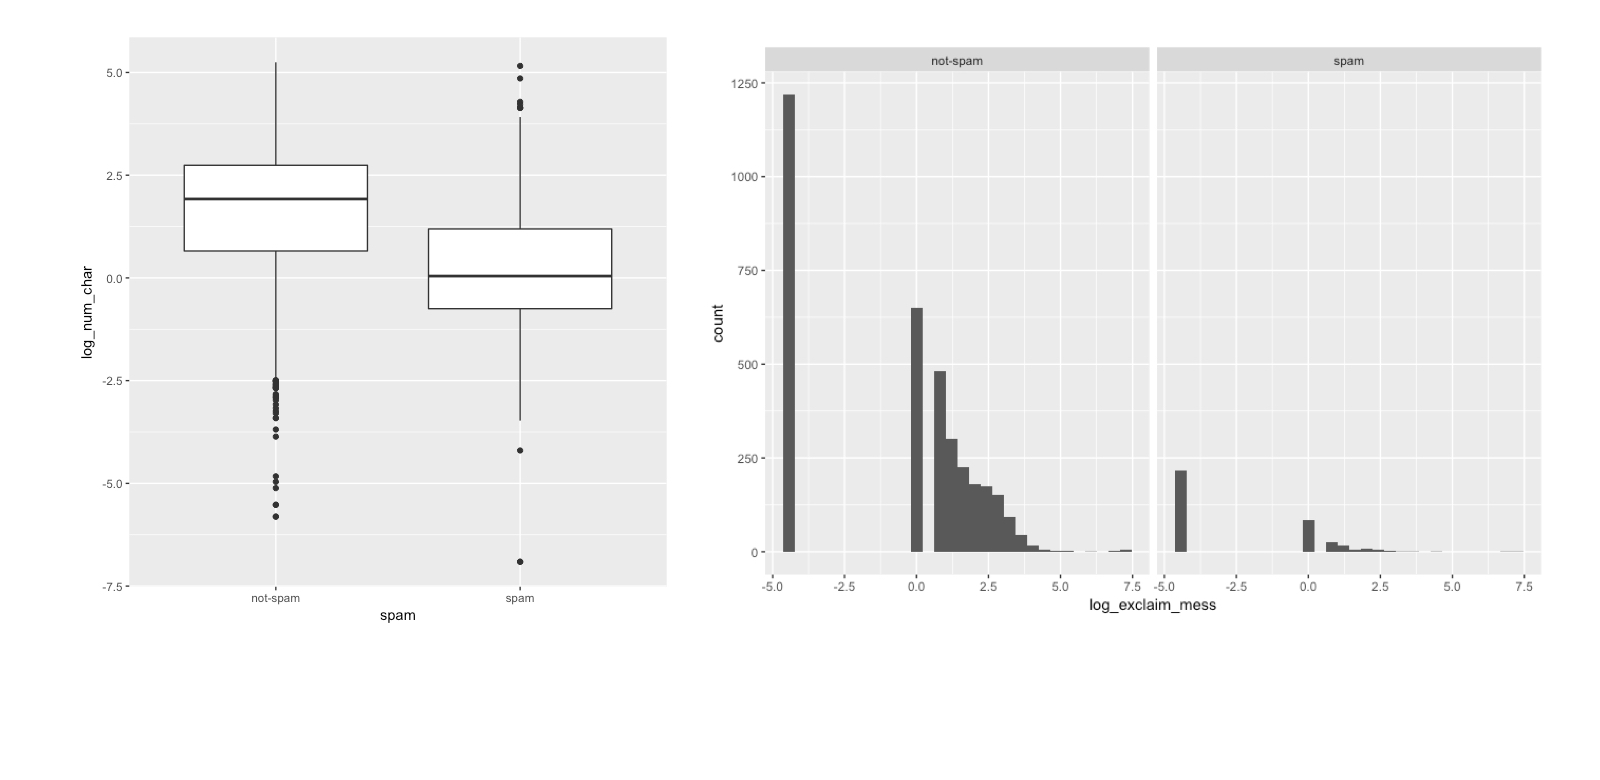
ゼロ過剰への戦略
- 2つの構成要素を別々に分析する
- 2水準のカテゴリ変数にまとめる
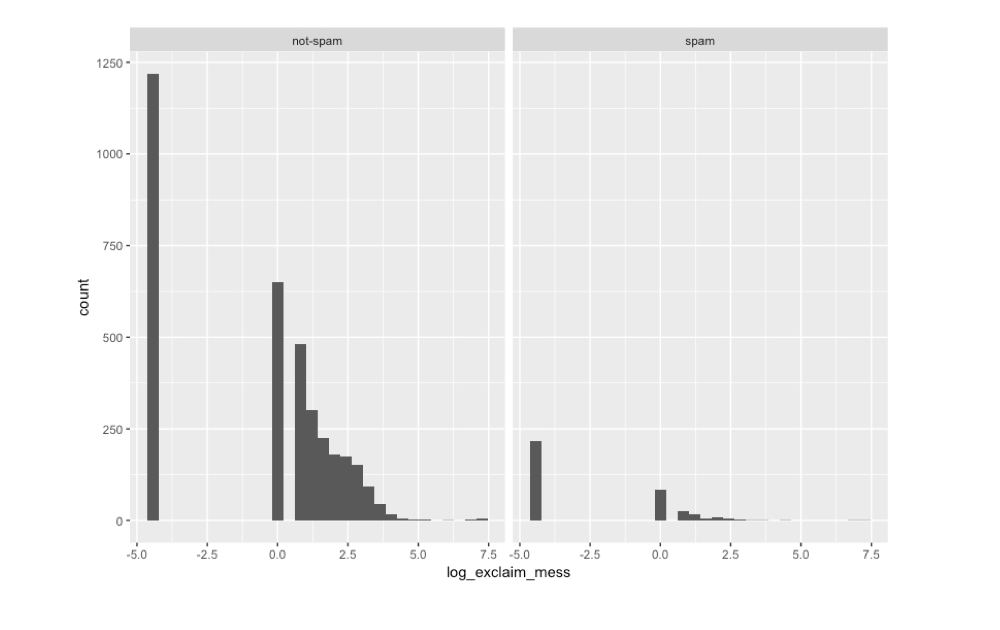
ゼロ過剰への戦略
2つの構成要素を別々に分析する
2水準のカテゴリ変数にまとめる
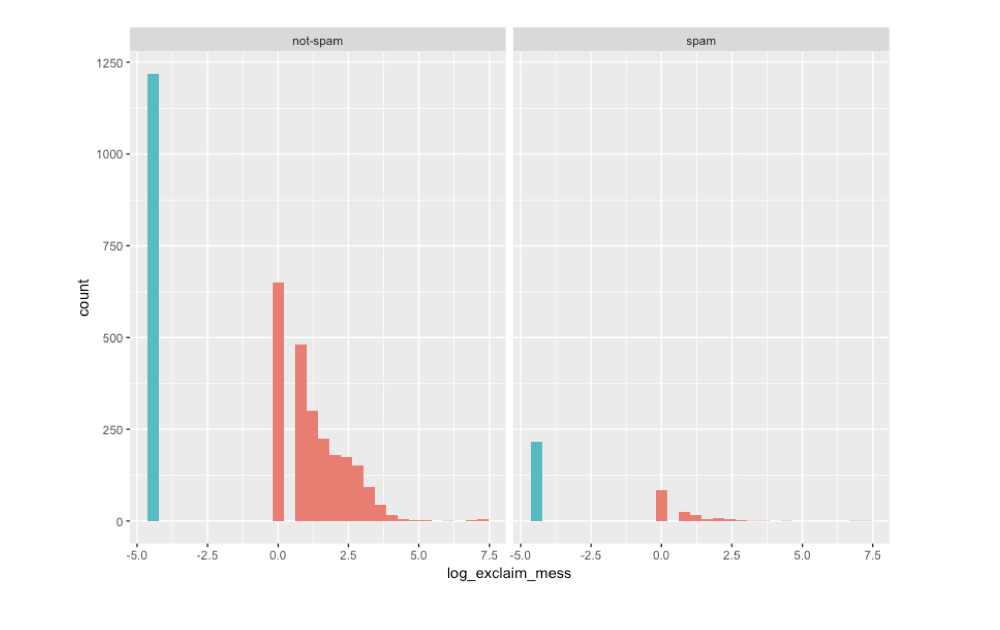
ゼロ過剰への戦略
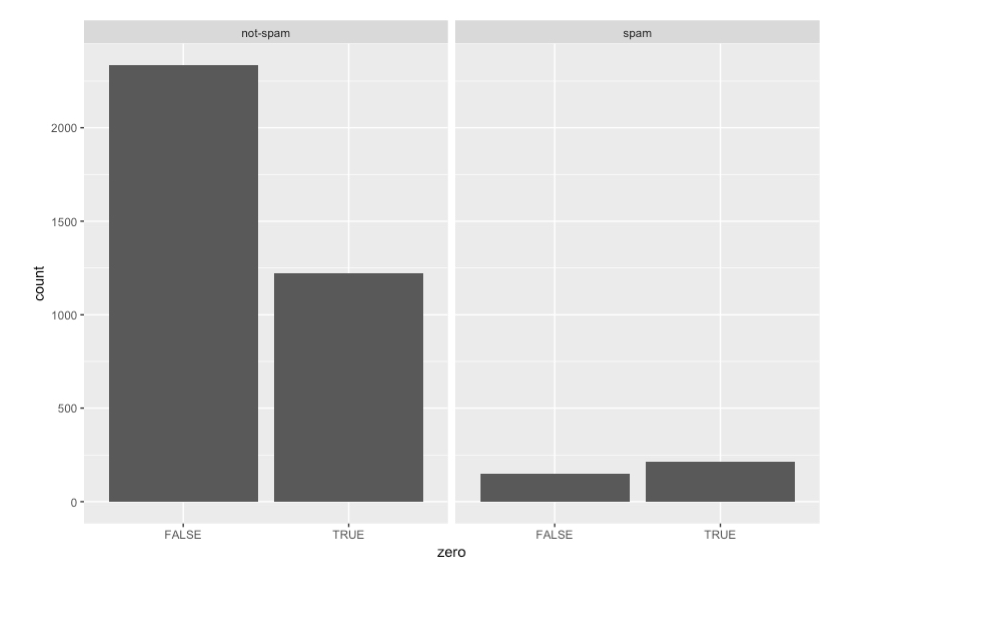
email %>%
  mutate(zero = exclaim_mess == 0) %>%
  ggplot(aes(x = zero)) +
  geom_bar() +
  facet_wrap(~spam)
棒グラフのオプション
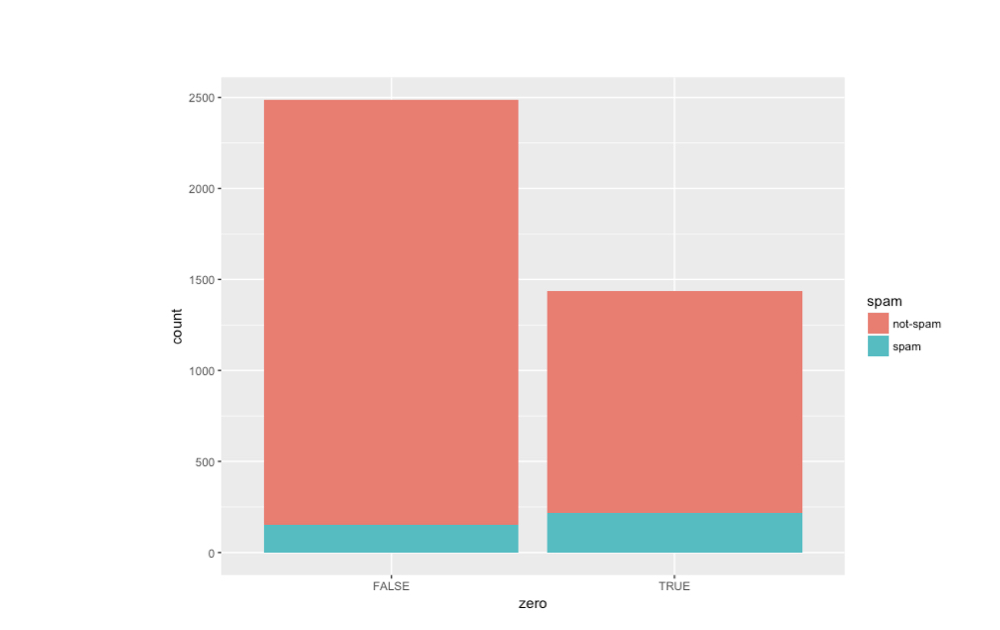
email %>%
  mutate(zero = exclaim_mess == 0) %>%
  ggplot(aes(x = zero, fill = spam)) +
  geom_bar()
棒グラフのオプション
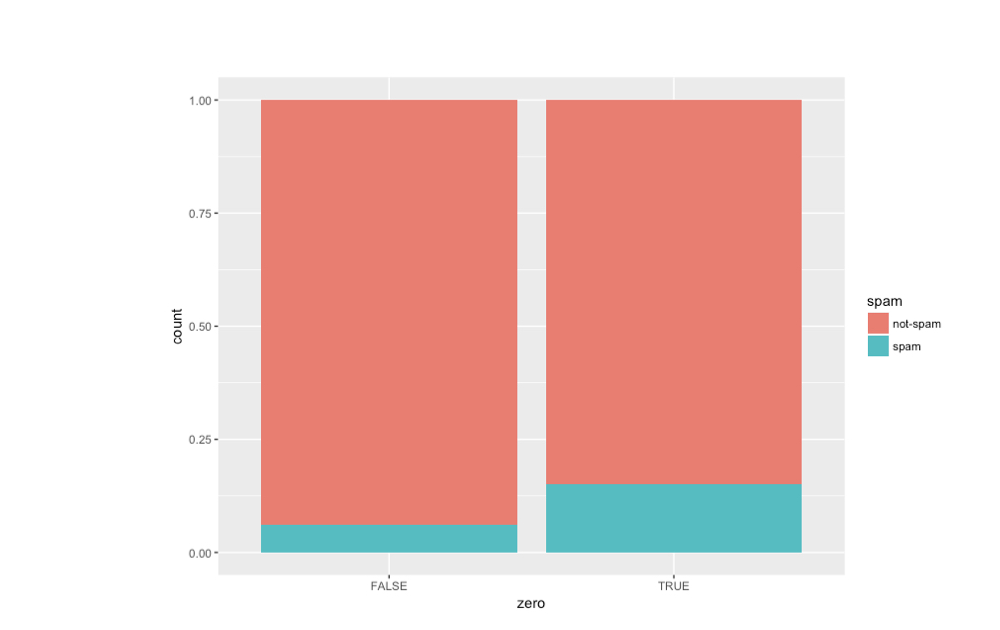
email %>%
  mutate(zero = exclaim_mess == 0) %>%
  ggplot(aes(x = zero, fill = spam)) +
  geom_bar(position = "fill")