高次元での可視化

Rで学ぶ探索的データ分析

Andrew Bray

Assistant Professor, Reed College

3変数のプロット

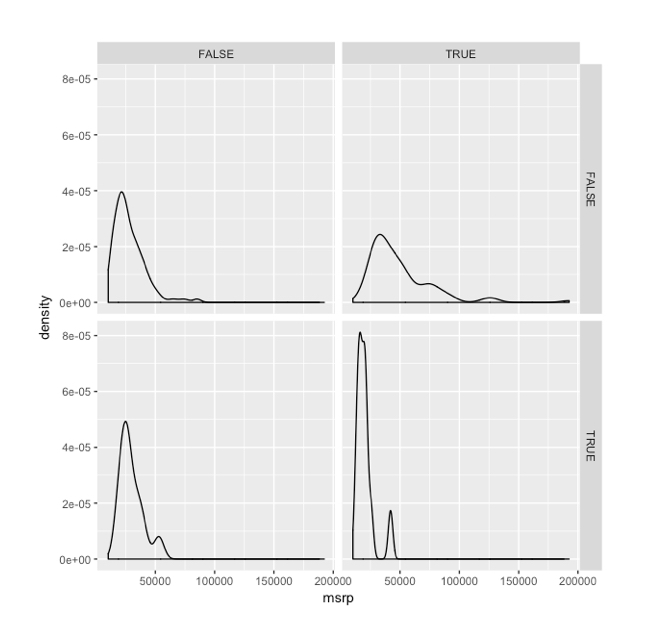
ggplot(cars, aes(x = msrp)) +
  geom_density() +
  facet_grid(pickup ~ rear_wheel)
ch2_4.005.png

Rで学ぶ探索的データ分析

3変数のプロット

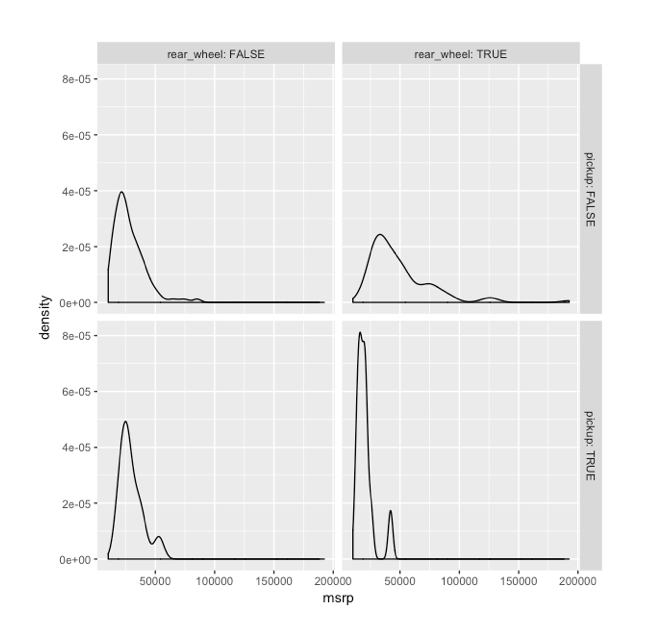
ggplot(cars, aes(x = msrp)) +
  geom_density() +
  facet_grid(pickup ~ rear_wheel, labeller = label_both)
ch2_4.008.png

Rで学ぶ探索的データ分析

3変数のプロット

ggplot(cars, aes(x = msrp)) +
  geom_density() +
  facet_grid(pickup ~ rear_wheel, labeller = label_both)
table(cars$rear_wheel, cars$pickup)
      FALSE TRUE
FALSE   306   12
TRUE     98   12
Rで学ぶ探索的データ分析

高次元プロット

  • 形状

  • 大きさ

  • パターン

  • 動き

  • x座標

  • y座標

Rで学ぶ探索的データ分析

演習に進みましょう!

Rで学ぶ探索的データ分析

Preparing Video For Download...