Seaborn の棒グラフ

Pythonでカテゴリカルデータを扱う

Kasey Jones

Research Data Scientist

従来の棒グラフ

# Code provided for clarity
reviews["Traveler type"].value_counts().plot.bar()
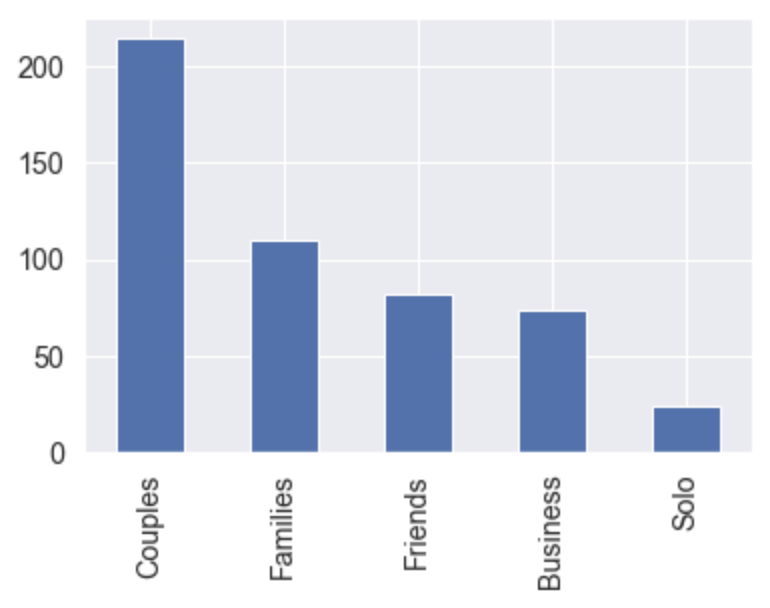
旅行者タイプ別のレビュー件数を数える棒グラフ。

Pythonでカテゴリカルデータを扱う

構文

sns.set(font_scale=1.3)
sns.set_style("darkgrid")

sns.catplot(x="Traveler type", y="Score", data=reviews, kind="bar")
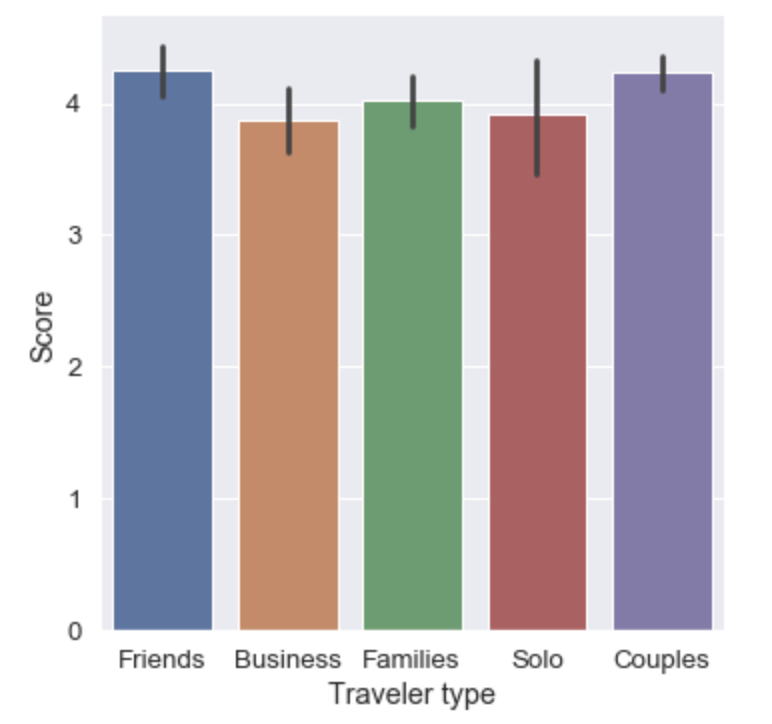
旅行者タイプ別のホテルレビューを示す Seaborn のカテゴリ棒グラフ。

Pythonでカテゴリカルデータを扱う

カテゴリの並び替え

reviews["Traveler type"] = reviews["Traveler type"].astype("category")
reviews["Traveler type"].cat.categories
Index(['Business', 'Couples', 'Families', 'Friends', 'Solo'], dtype='object')
Pythonでカテゴリカルデータを扱う

更新後の可視化

sns.catplot(x="Traveler type", y="Score", data=reviews, kind="bar")
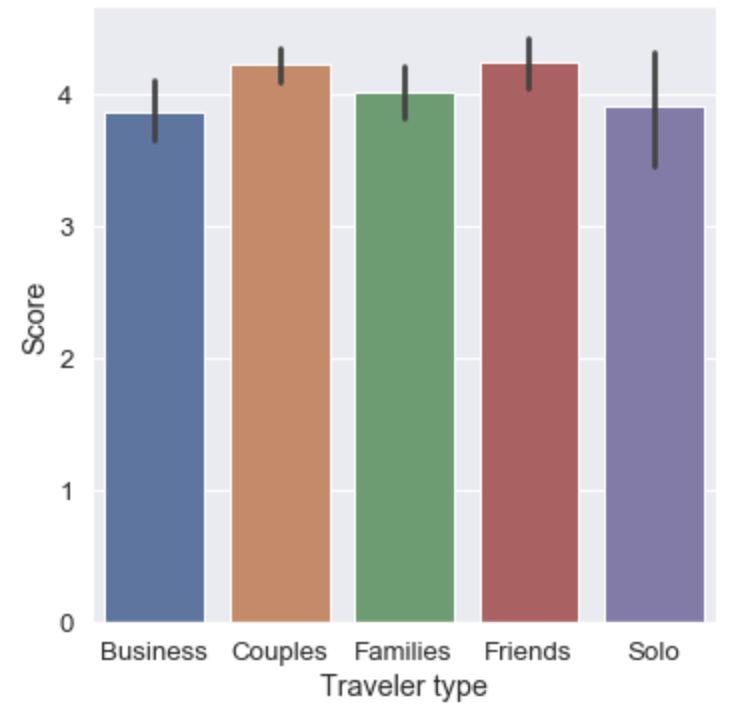
  • 注: catplot() には order 引数があります
Pythonでカテゴリカルデータを扱う

hue 引数

  • hue:
    • data 内の変数名
    • 第2のカテゴリでデータを分割
    • 色分けにも使用
sns.set(font_scale=1.2)
sns.set_style("darkgrid")
sns.catplot(x="Traveler type", y="Score", data=reviews, kind="bar",
            hue="Tennis court")  # <--- new parameter
Pythonでカテゴリカルデータを扱う

2 変数の棒グラフ

Pythonでカテゴリカルデータを扱う

棒グラフの練習

Pythonでカテゴリカルデータを扱う

Preparing Video For Download...