探索的データ分析

End-to-End Machine Learning

Joshua Stapleton

Machine Learning Engineer

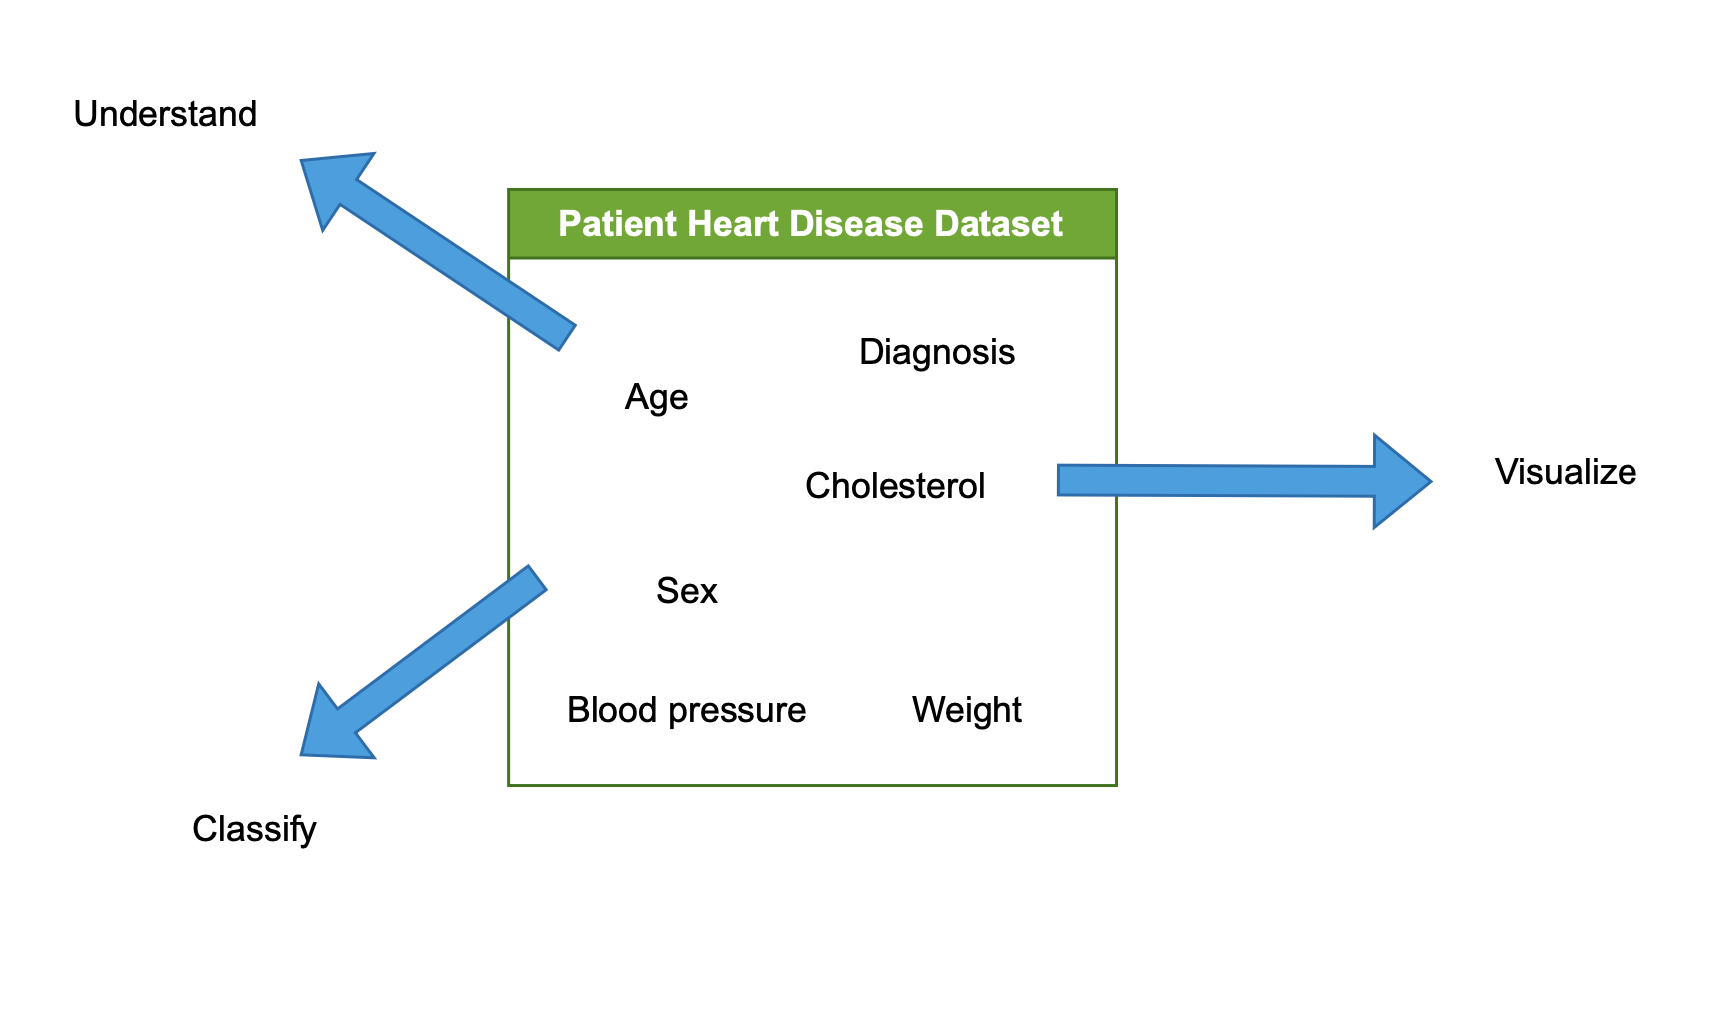
EDAの流れ

  • データセットを調査・分析
  • データセットを理解
  • データセットを可視化
  • データセットを特徴付け/分類

心疾患データセットに対するEDAの構成要素を示す図

End-to-End Machine Learning

データの把握

df.head()

  • 先頭行を表示
  • 構造のスナップショット
# 最初の5行を表示
print(heart_disease_df.head())
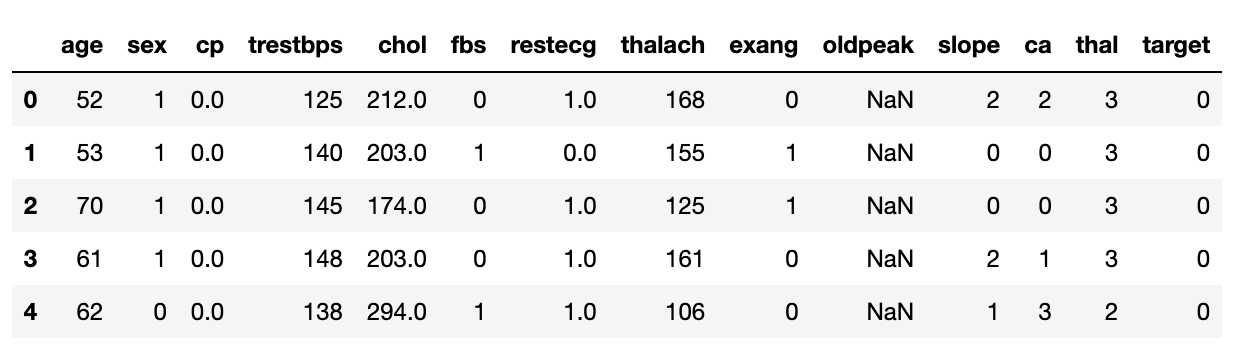
心疾患DataFrameの先頭5行。df.head()の結果。

df.info()

  • 特徴量の要約
  • 非Null件数と型を表示
# 詳細を表示
print(heart_disease_df.info())
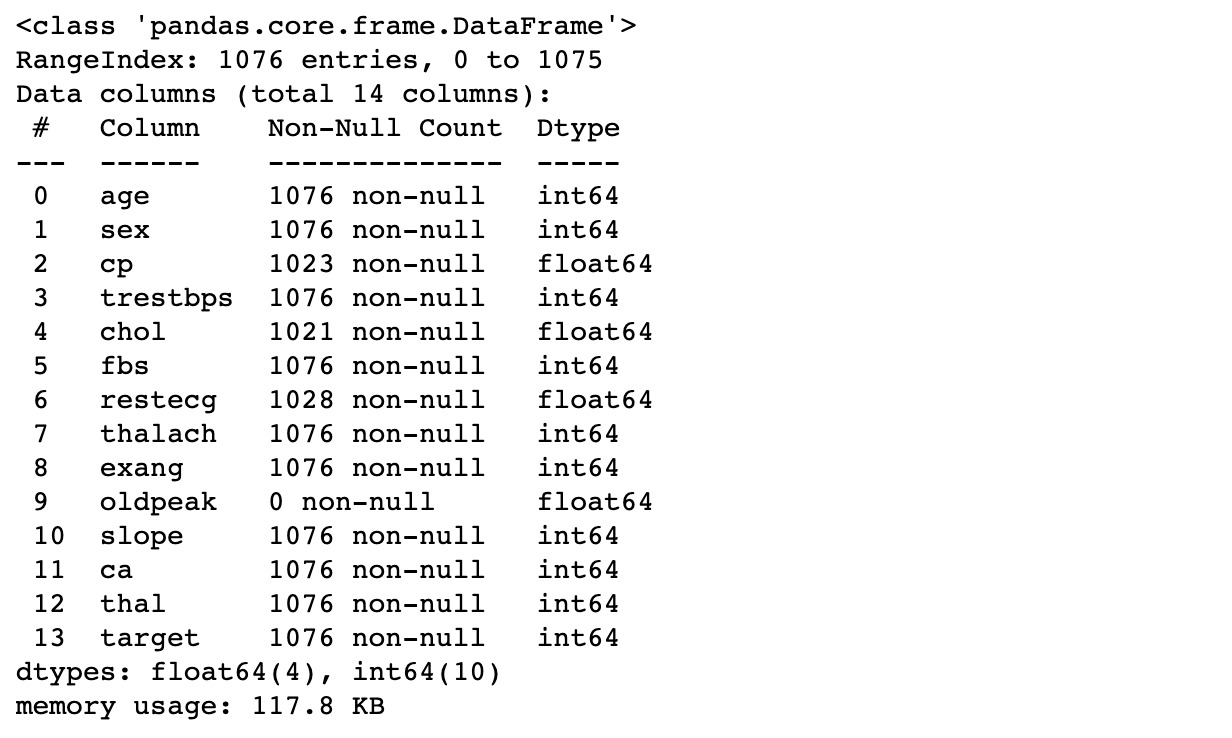
心疾患DataFrameの要約情報。df.info()の結果。

End-to-End Machine Learning

クラス(不)均衡

df.value_counts()

  • 各クラスの出現数を集計
  • クラス: 心疾患の有無(1/0)
  • モデリングで重要
# クラスバランスを表示
print(heart_disease_df['target'].value_counts(normalize=True))

心疾患DataFrameのtarget列のクラスバランス。.value_counts()の結果。

End-to-End Machine Learning

欠損値

  • エラーの原因
  • 代表性を欠き偏る結果

df.isnull()を使用

  • Null/空/欠損を確認
  • 列や列集合に適用

使用例

# 列の全値がNullか確認
print(heart_disease_df['oldpeak'].isnull().all())
True
End-to-End Machine Learning

外れ値

  • 異常値

    • 測定ミス
    • 入力ミス
    • まれな事象
  • モデル性能を歪める

    • 極端値に引きずられて学習
    • 全体傾向を捉えにくい
  • 役立つ場合も

    • まれな値
    • 検出: 箱ひげ図やIQR

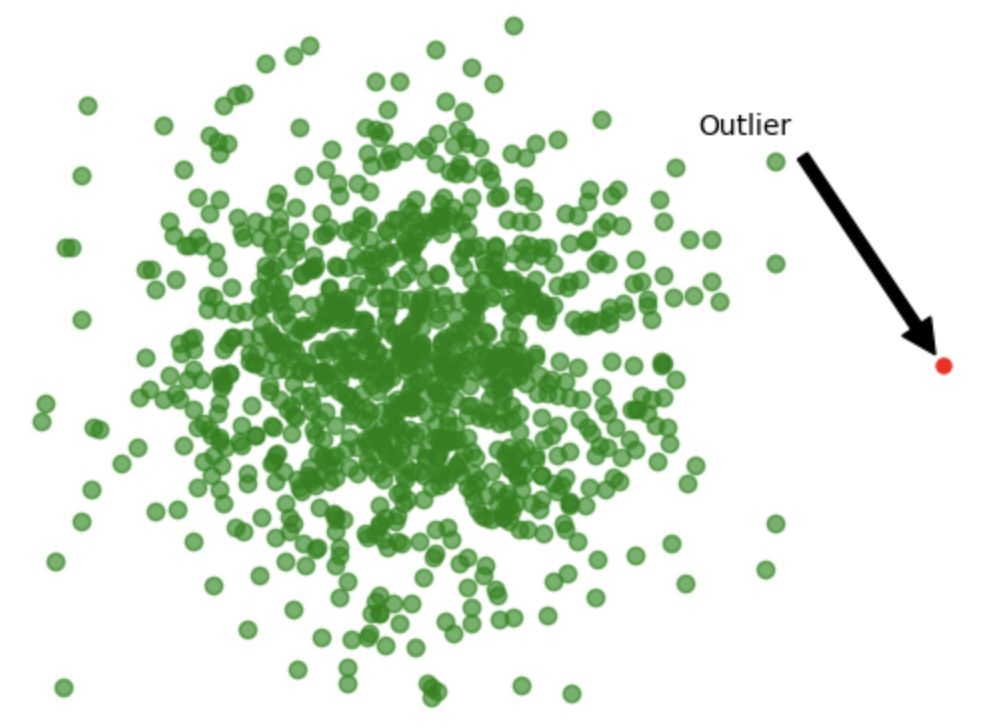
外れ値を示す可視化。

End-to-End Machine Learning

データの可視化

可視化で分かること:

  • 全体の傾向
  • 欠損値と外れ値

他の可視化:

  • カーネル密度推定
  • 経験的累積分布
  • 双変量分布
df['age'].plot(kind='hist')
plt.xlabel('Age')
plt.ylabel('Frequency')
plt.show()
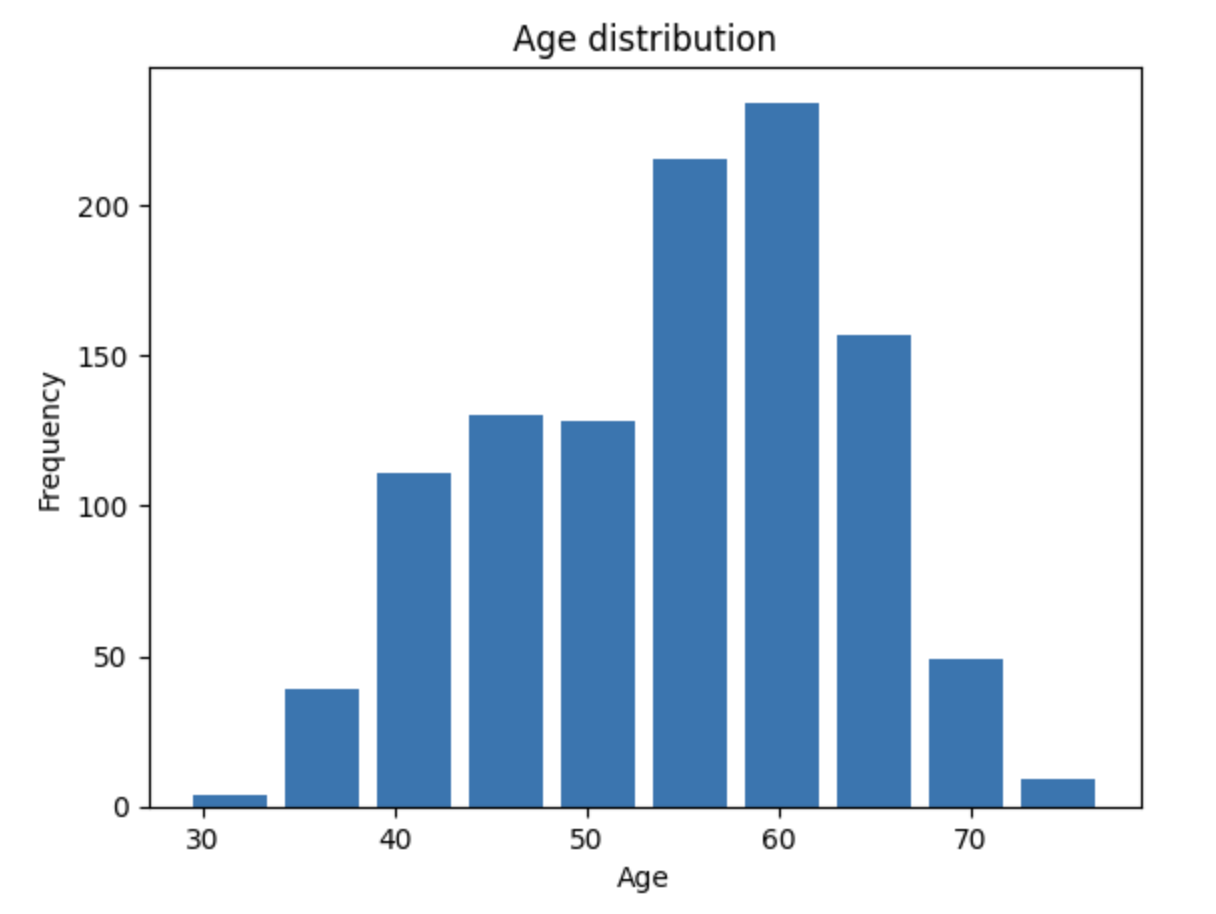
データセット内の年齢分布を示す可視化。

1 https://seaborn.pydata.org/tutorial/distributions.html, https://app.datacamp.com/learn/courses/intermediate-data-visualization-with-seaborn
End-to-End Machine Learning

EDAの目的

データを理解する

  • パターンはあるか
  • 例: 男性は心疾患率が高いか

外れ値を検出

  • 許容範囲外の値はあるか
  • 誤りや欠損はあるか

仮説の立案

  • データから何を期待するか

前提の検証

  • 期待が現実と合致するか
End-to-End Machine Learning

Passons à la pratique !

End-to-End Machine Learning

Preparing Video For Download...