ファセットのラベルと順序

ggplot2 中級データ可視化

Rick Scavetta

Founder, Scavetta Academy

新しいデータフレーム
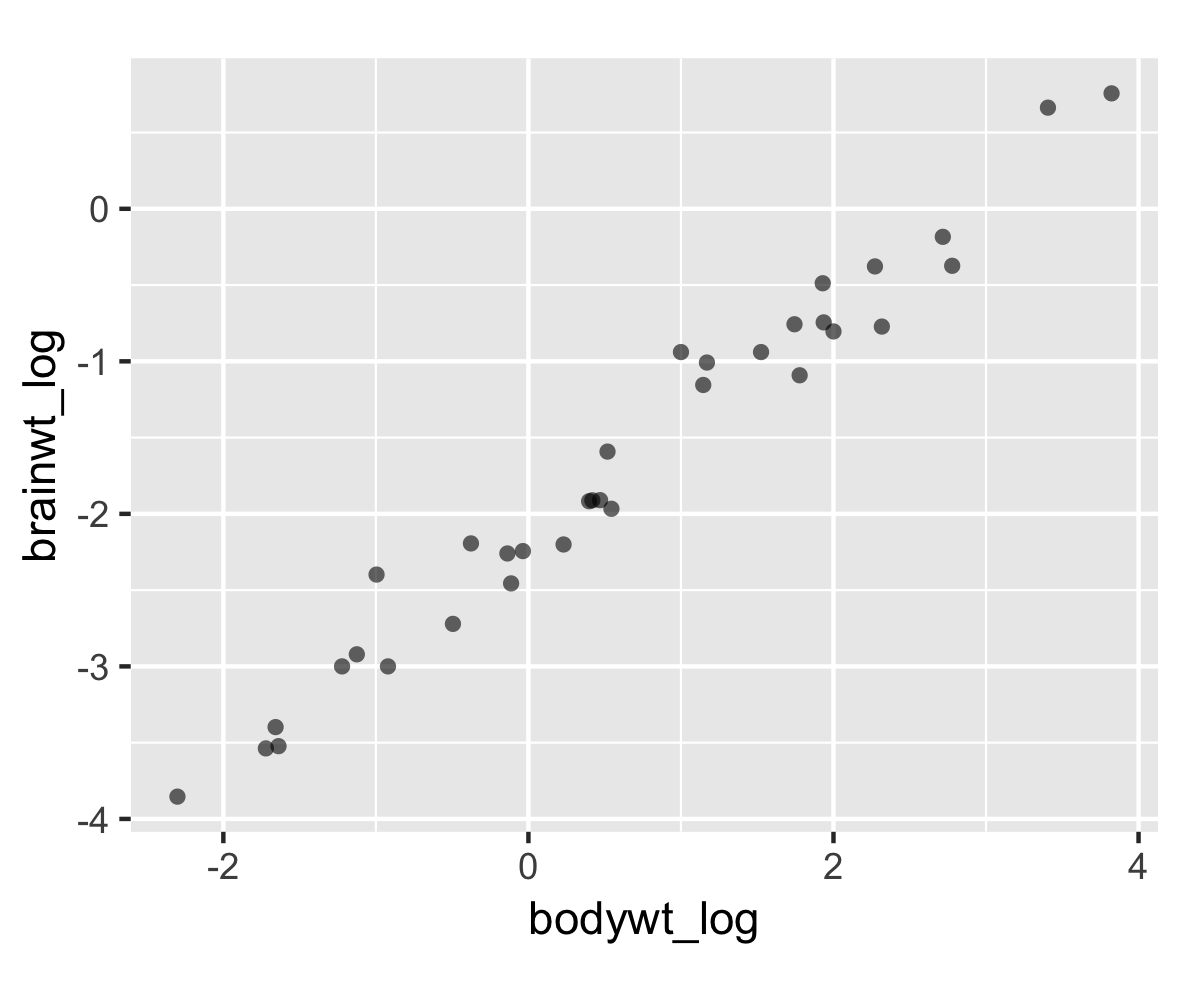
# プロット
p <- ggplot(msleep2, aes(bodywt_log,
                         brainwt_log)) +
  geom_point(alpha = 0.6, shape = 16) +
  coord_fixed()

p

ggplot2 中級データ可視化

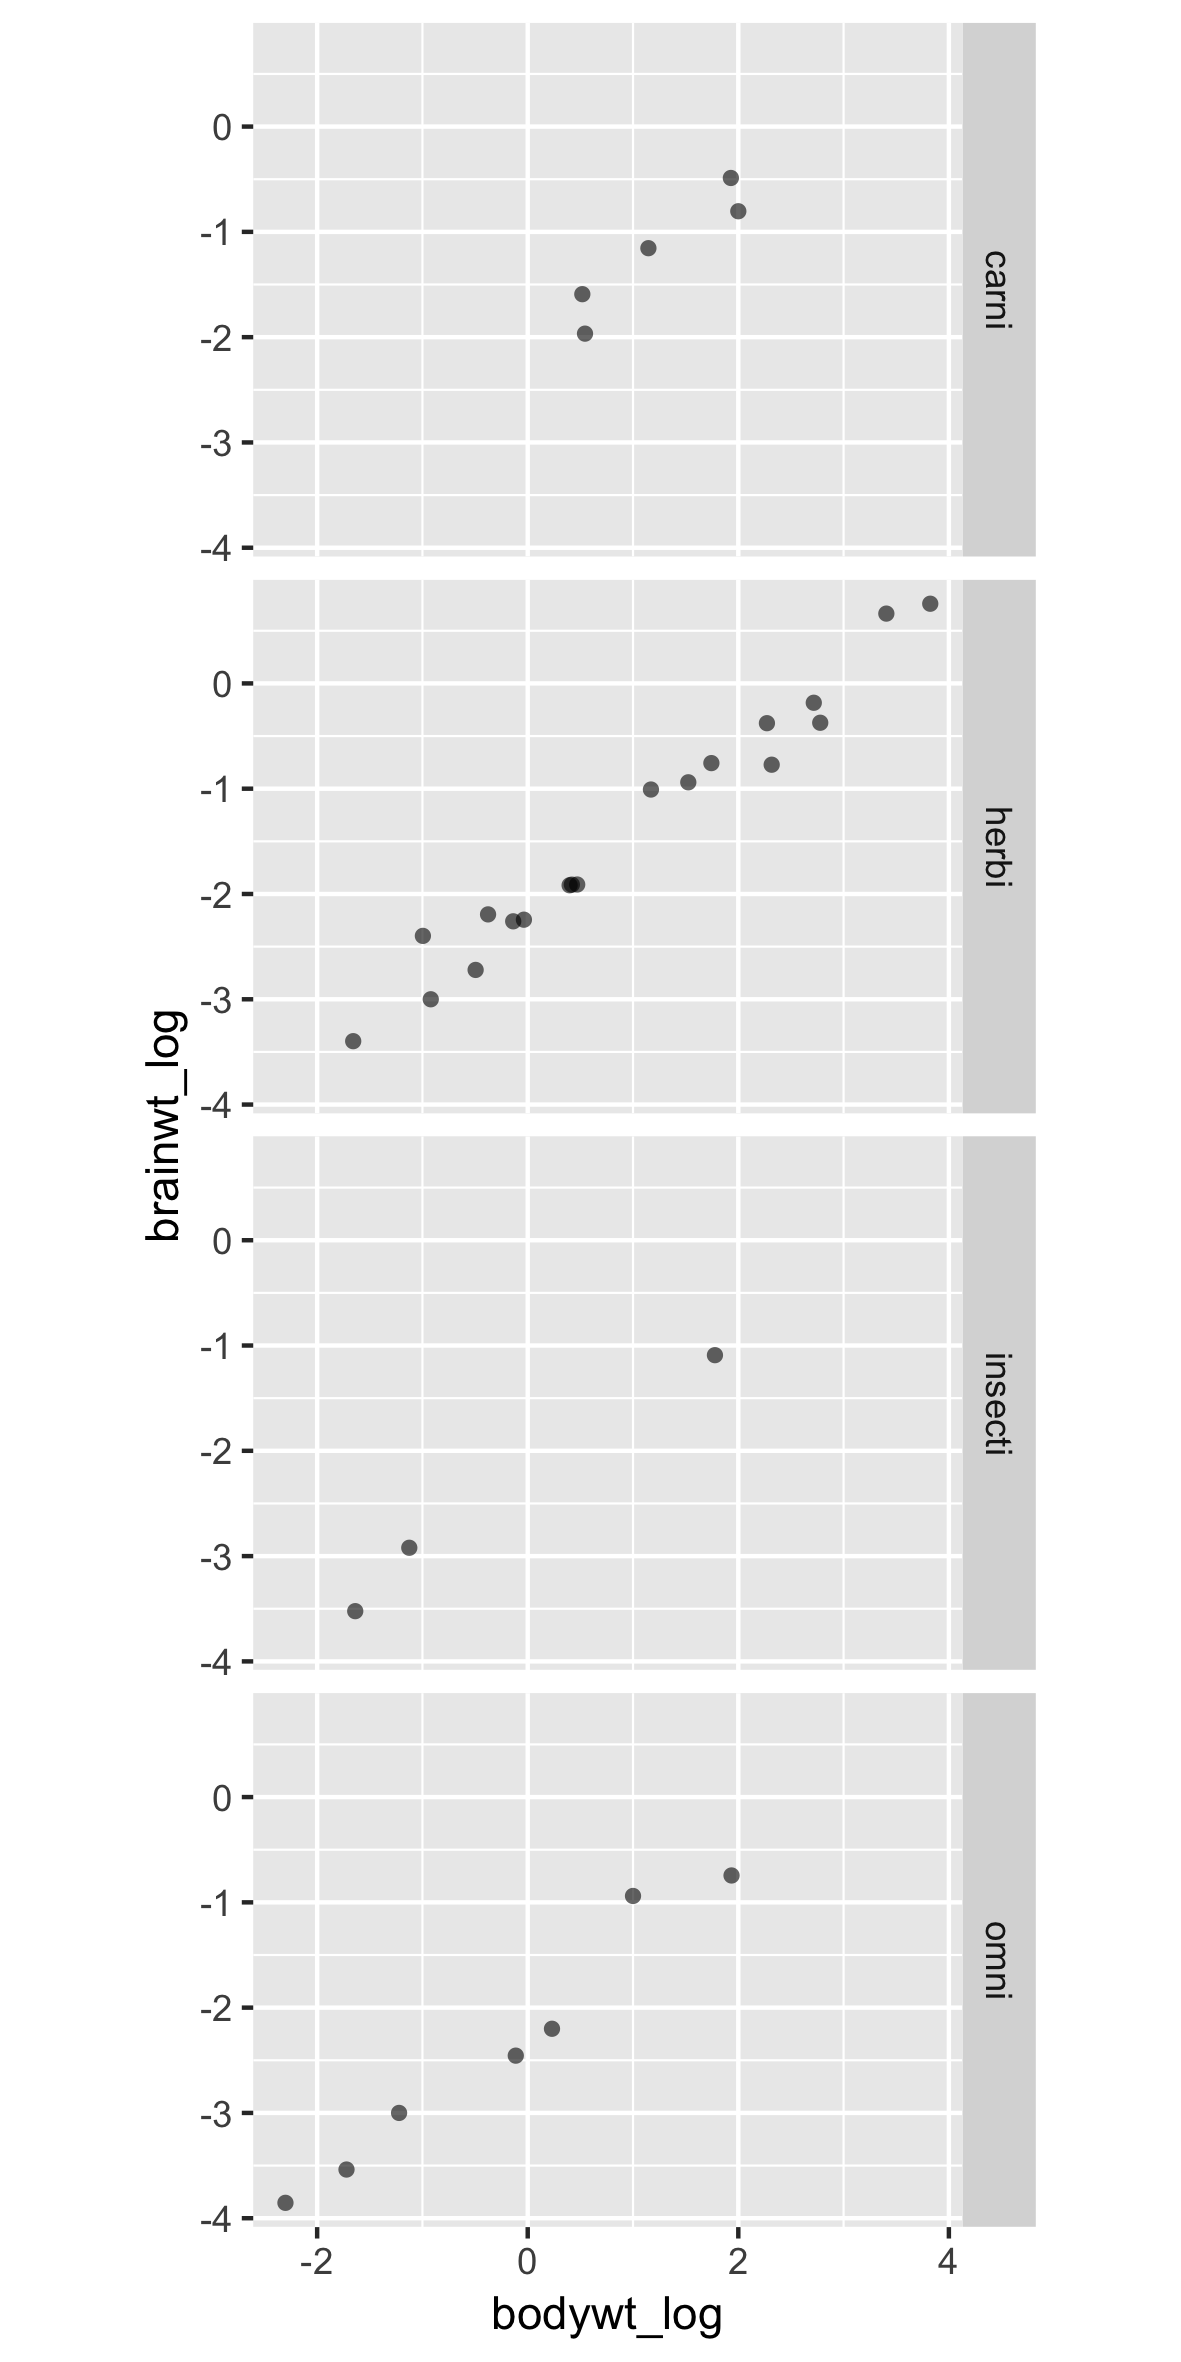
新しいデータフレーム(ファセット付き)

p +
  facet_grid(rows = vars(vore))

ggplot2 中級データ可視化

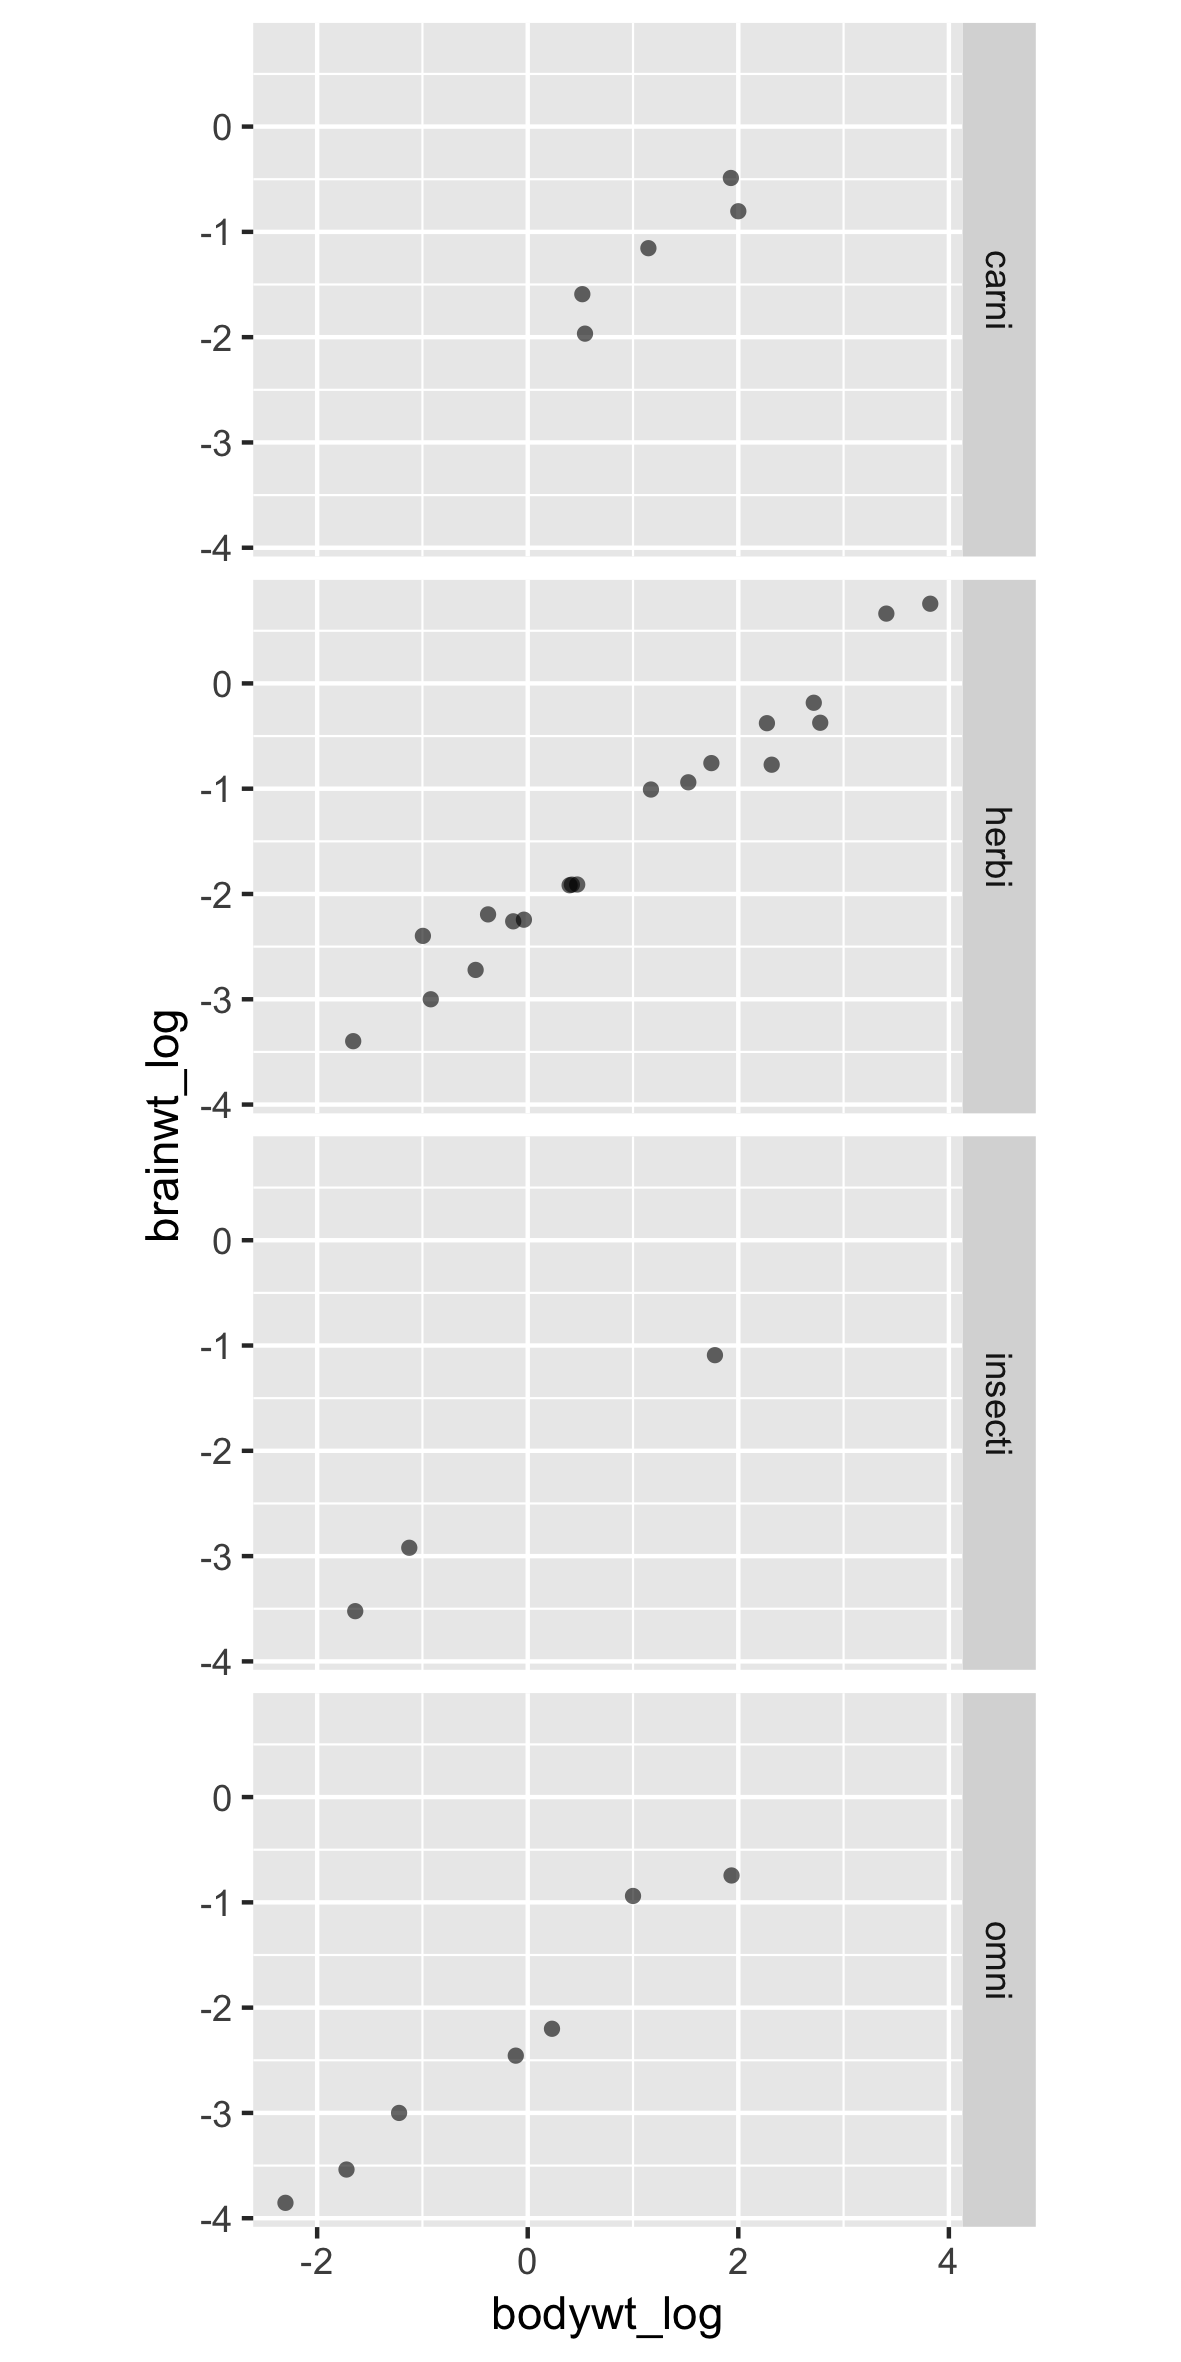
新しいデータフレーム(ファセット付き)

p +
  facet_grid(rows = vars(vore))

ggplot2 中級データ可視化

不十分なラベルと順序

p +
  facet_grid(rows = vars(vore))

ファセットでよくある問題:

  • ラベルが不十分(例: 説明的でない)
  • 並び順が不適切

ggplot2 中級データ可視化

不十分なラベルと順序

p +
  facet_grid(rows = vars(vore))

解決策:

  • かんたん: ggplotでラベルを追加
  • より良い: データフレーム内の因子を再ラベル・並べ替え

ggplot2 中級データ可視化

labeller 引数

# 既定では値のみを表示
p +
  facet_grid(rows = vars(vore), 
             labeller = label_value)

ggplot2 中級データ可視化

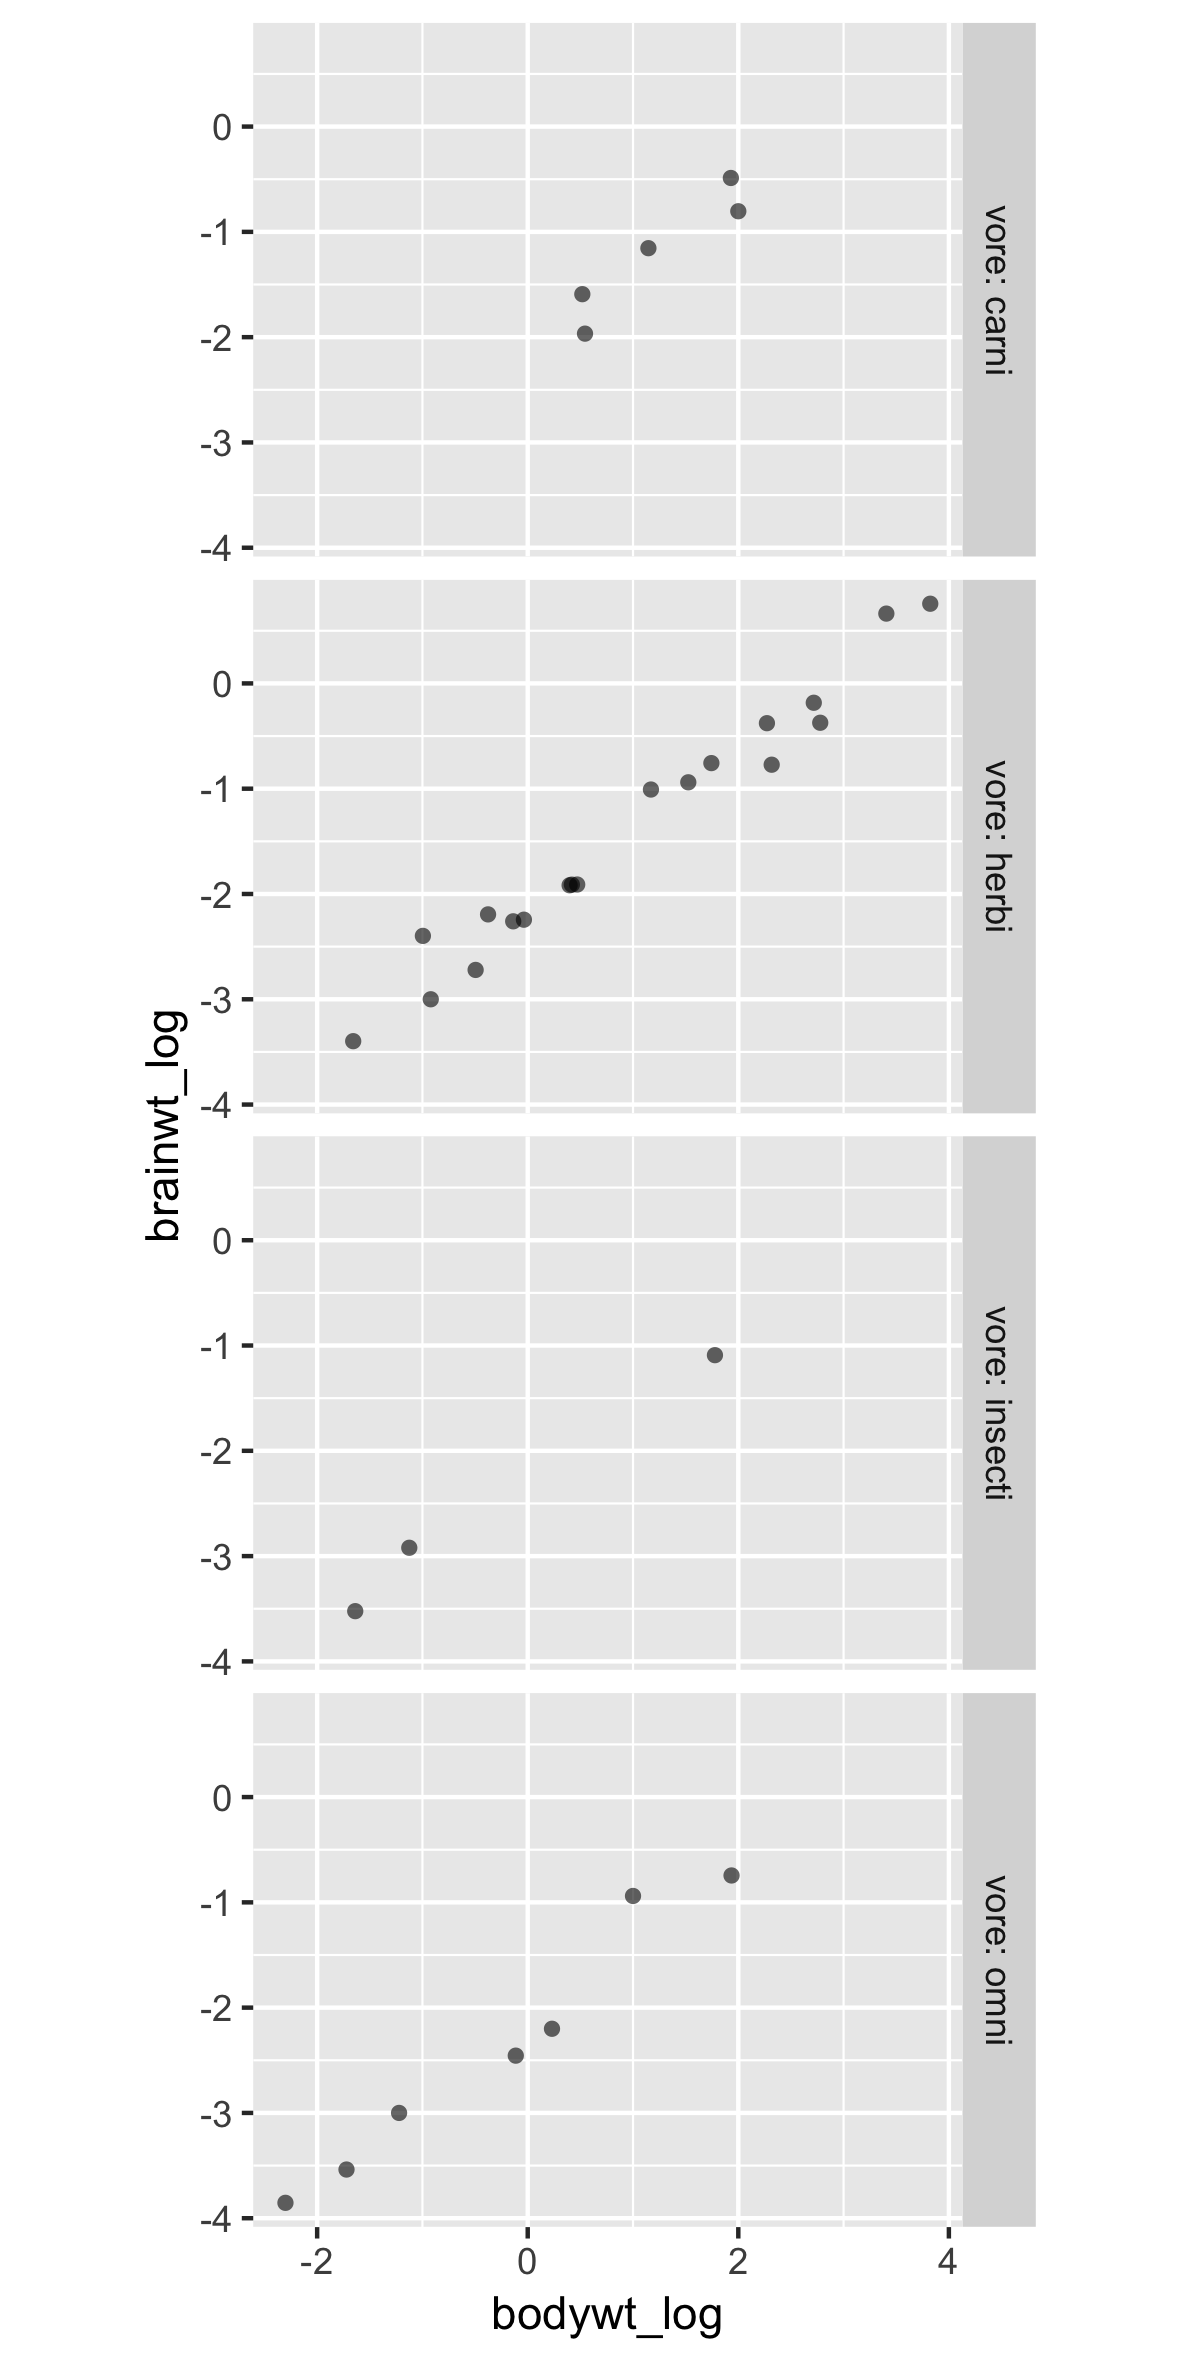
label_both で変数名を追加

# 変数名も表示
p +
  facet_grid(rows = vars(vore), 
               labeller = label_both)

ggplot2 中級データ可視化

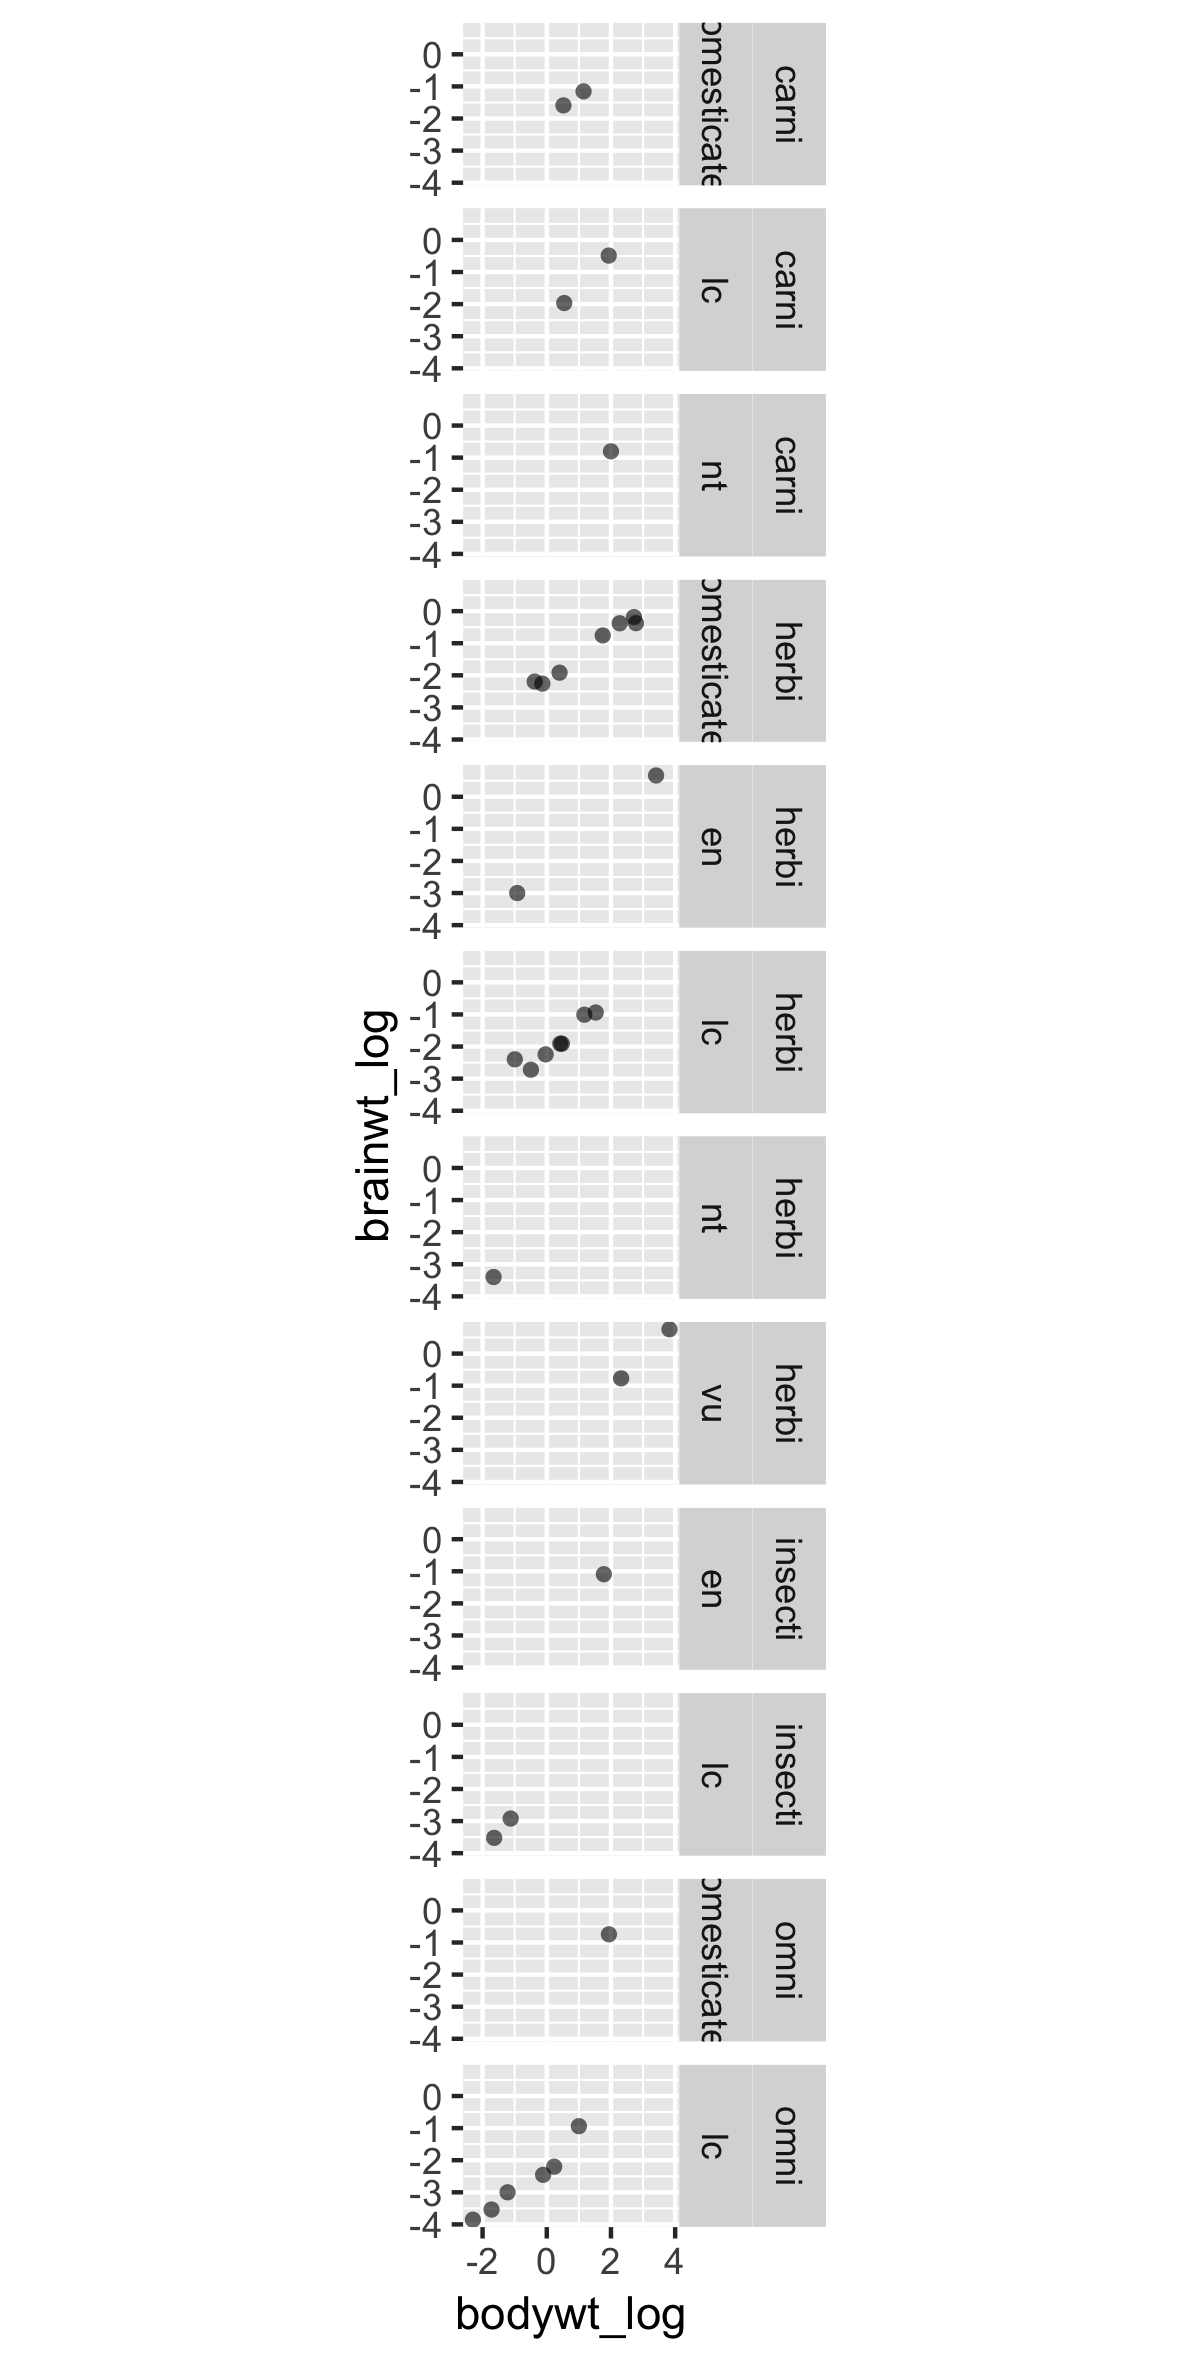
片側に2変数

p +
  facet_grid(rows = vars(vore, 
                         conservation))

ggplot2 中級データ可視化

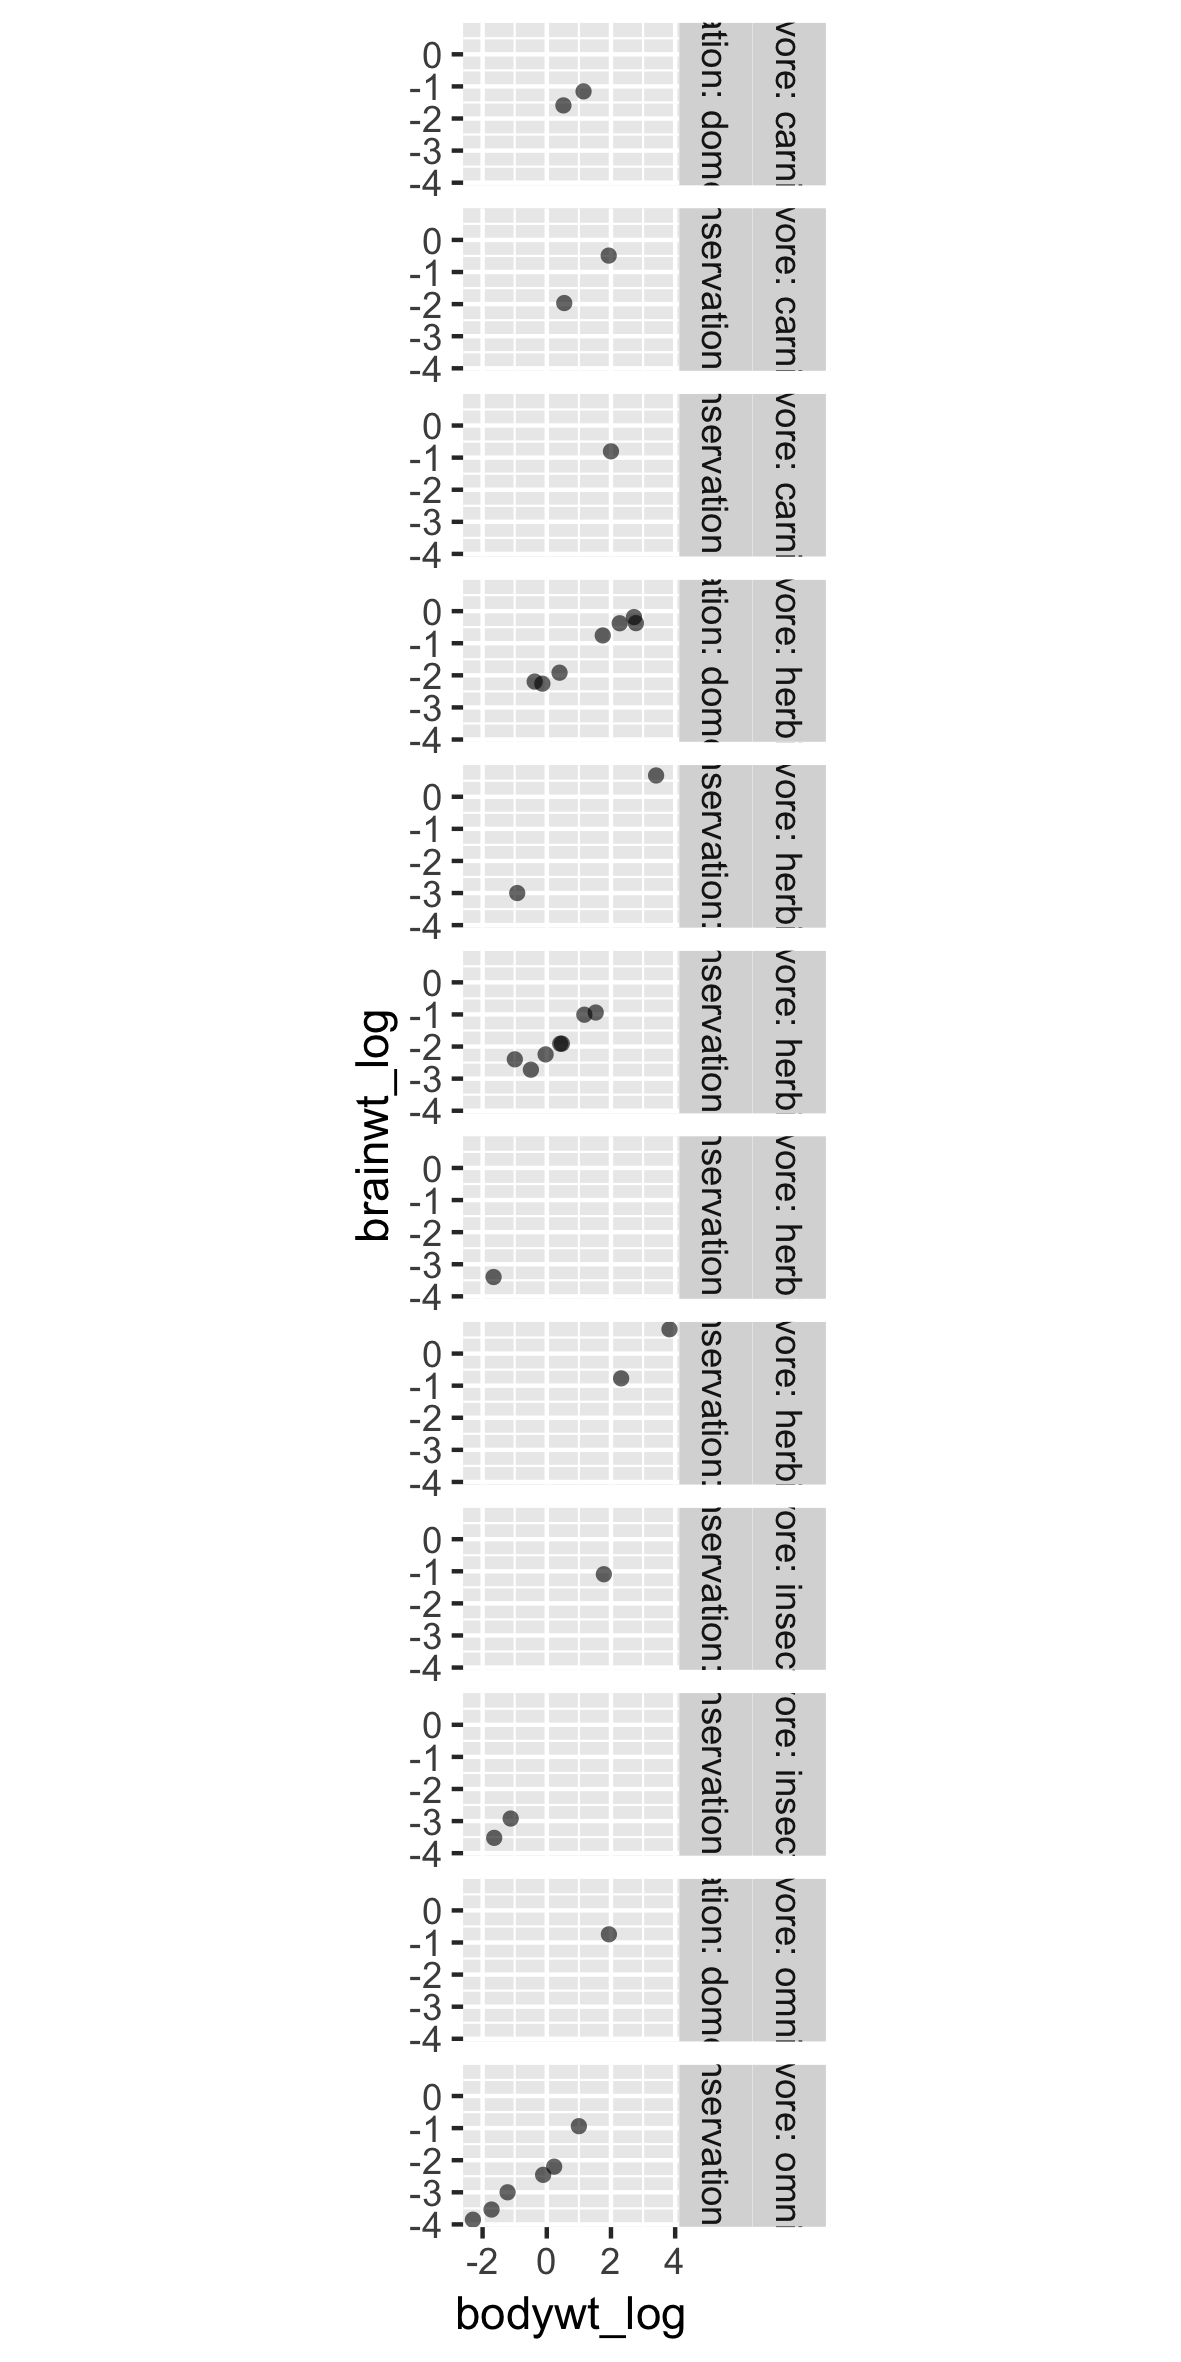
label_context で曖昧さを回避

p +
  facet_grid(rows = vars(vore,
                         conservation),
               labeller = label_context)

ggplot2 中級データ可視化

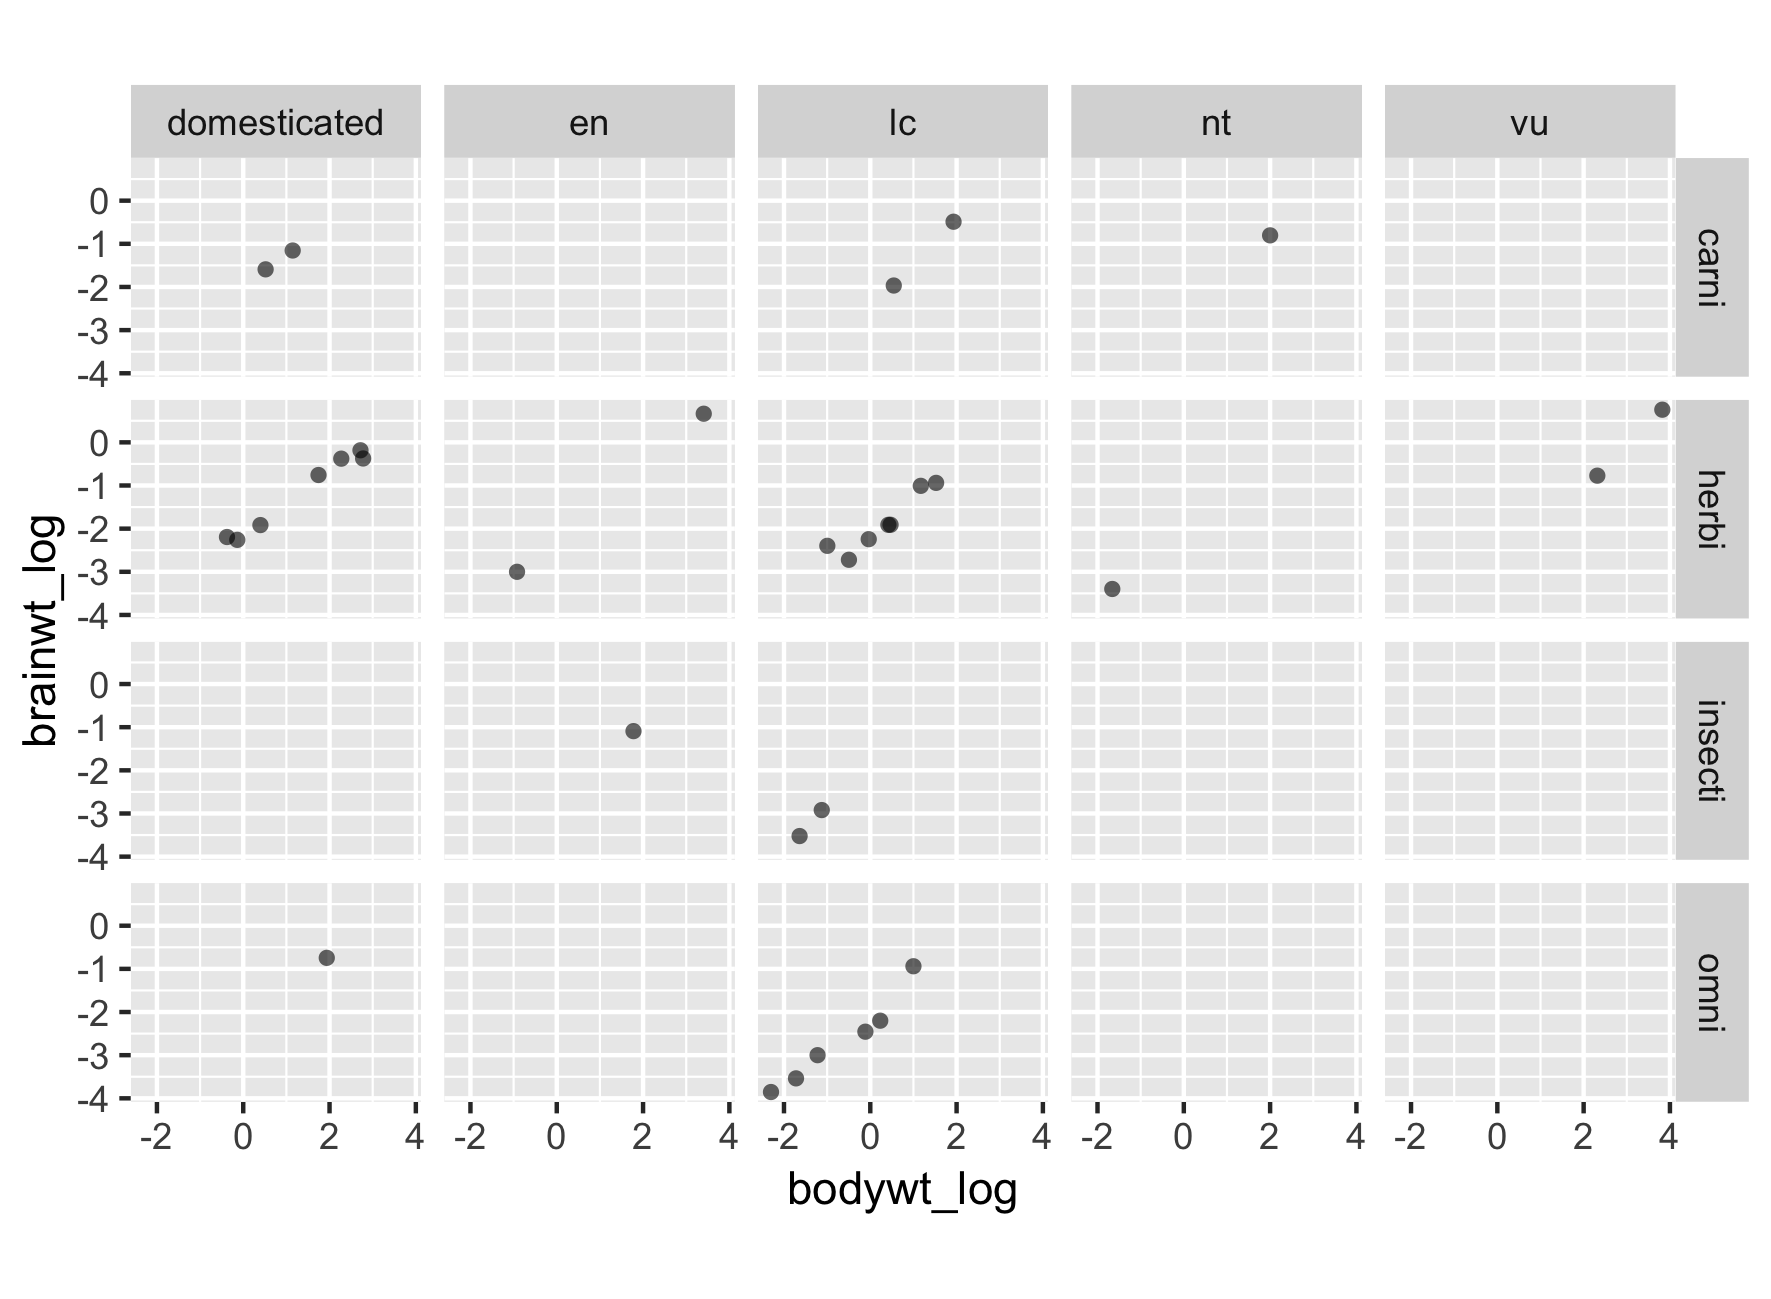
必要に応じて行と列を使う

p +
  facet_grid(rows = vars(vore), 
             cols = vars(conservation),
             labeller = label_context)

ggplot2 中級データ可視化

必要に応じて行と列を使う

p +
  facet_grid(rows = vars(vore), 
             cols = vars(conservation))

ggplot2 中級データ可視化

必要に応じて行と列を使う

ggplot2 中級データ可視化

因子の再ラベルと並べ替え

msleep2$conservation <- fct_recode(msleep2$conservation,
                                   Domesticated = "domesticated",
                                   `Least concern` = "lc",
                                   `Near threatened` = "nt",
                                   Vulnerable = "vu",
                                   Endangered = "en")

msleep2$vore = fct_recode(msleep2$vore,
                          Carnivore = "carni",
                          Herbivore = "herbi",
                          Insectivore = "insecti",
                          Omnivore = "omni")
ggplot2 中級データ可視化

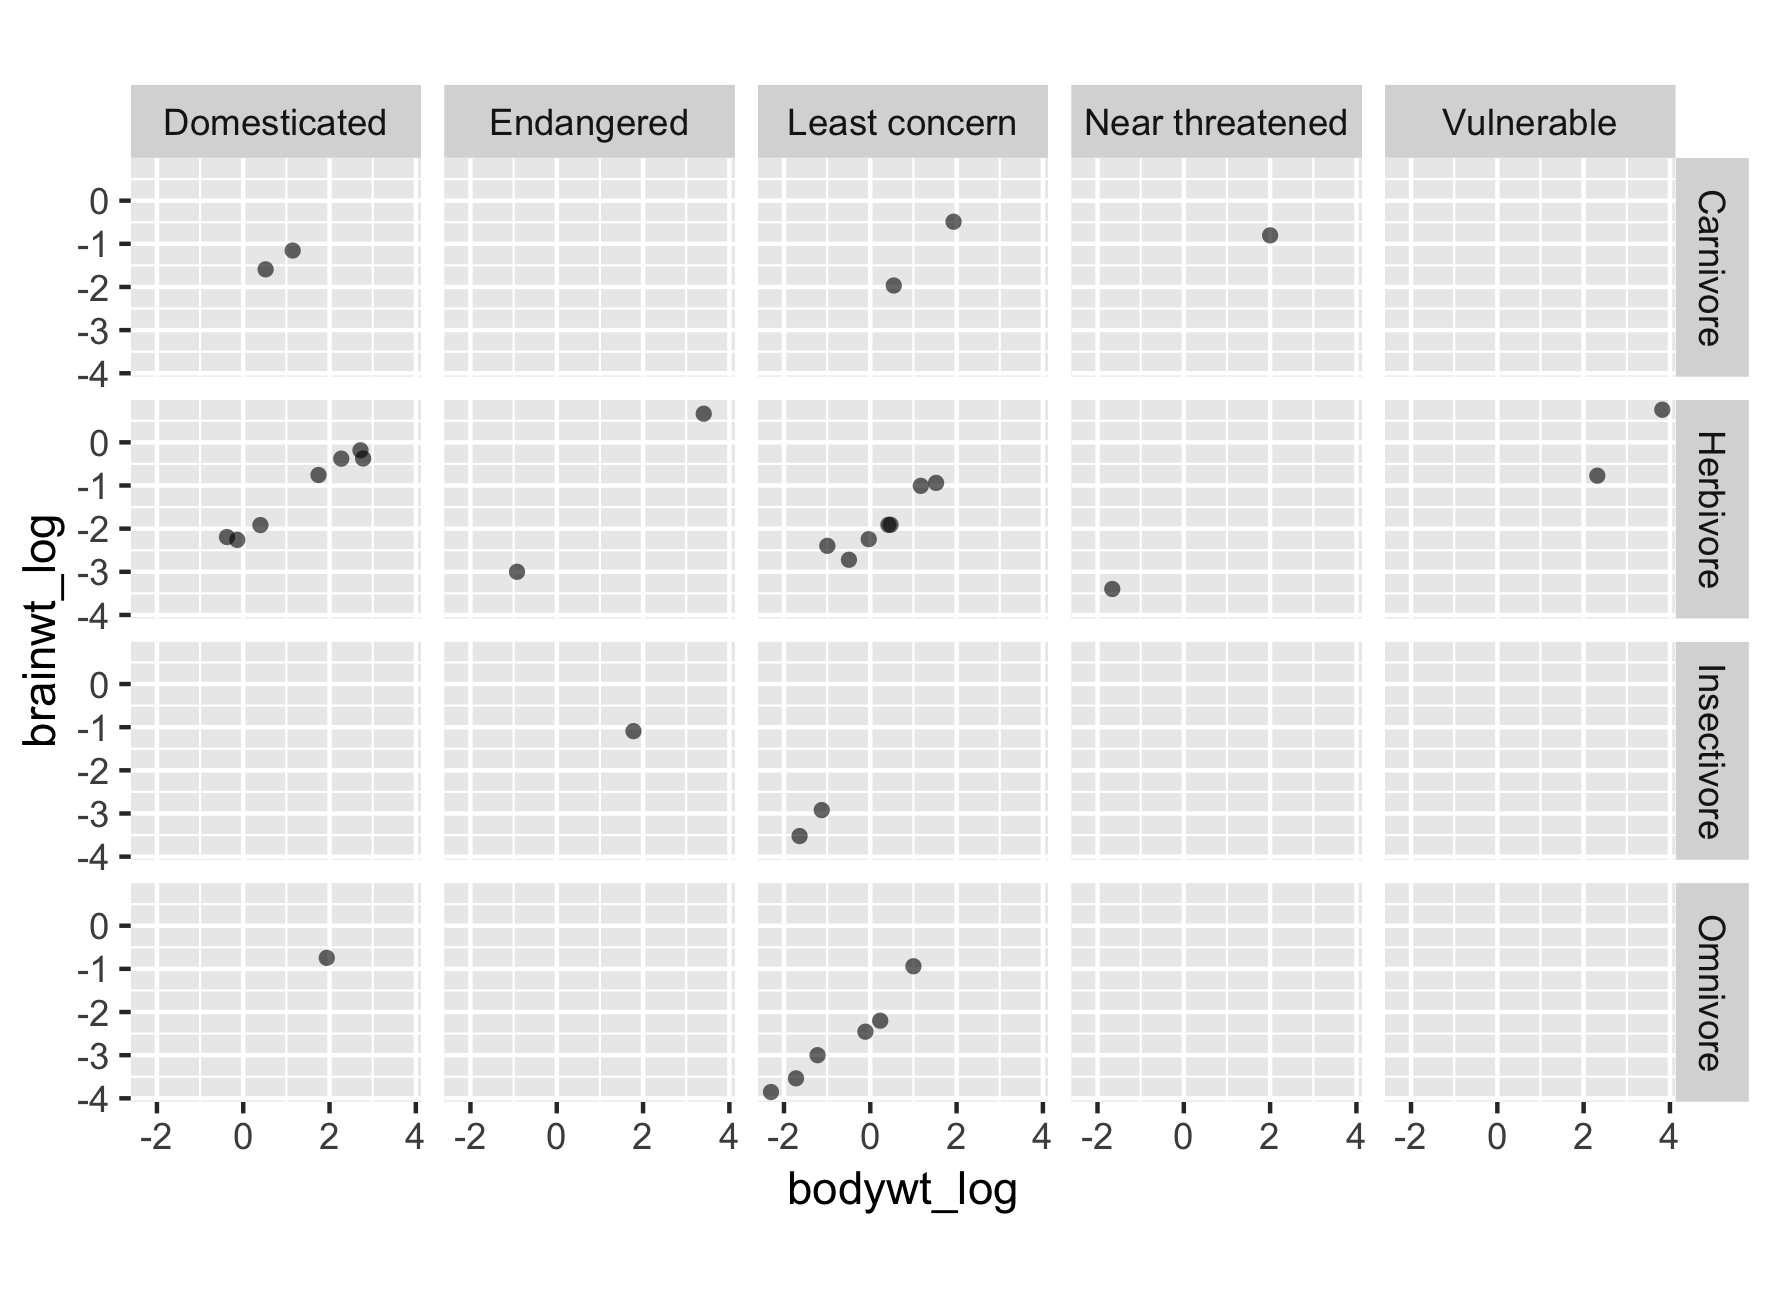
新しいラベルでプロットを再作成

# プロット
p <- ggplot(msleep2, aes(bodywt_log,
                         brainwt_log)) +
  geom_point(alpha = 0.6, shape = 16) +
  coord_fixed()

p +
  facet_grid(rows = vars(vore), 
             cols = vars(conservation)) 

ggplot2 中級データ可視化

新しいラベルでプロットを再作成

ggplot2 中級データ可視化

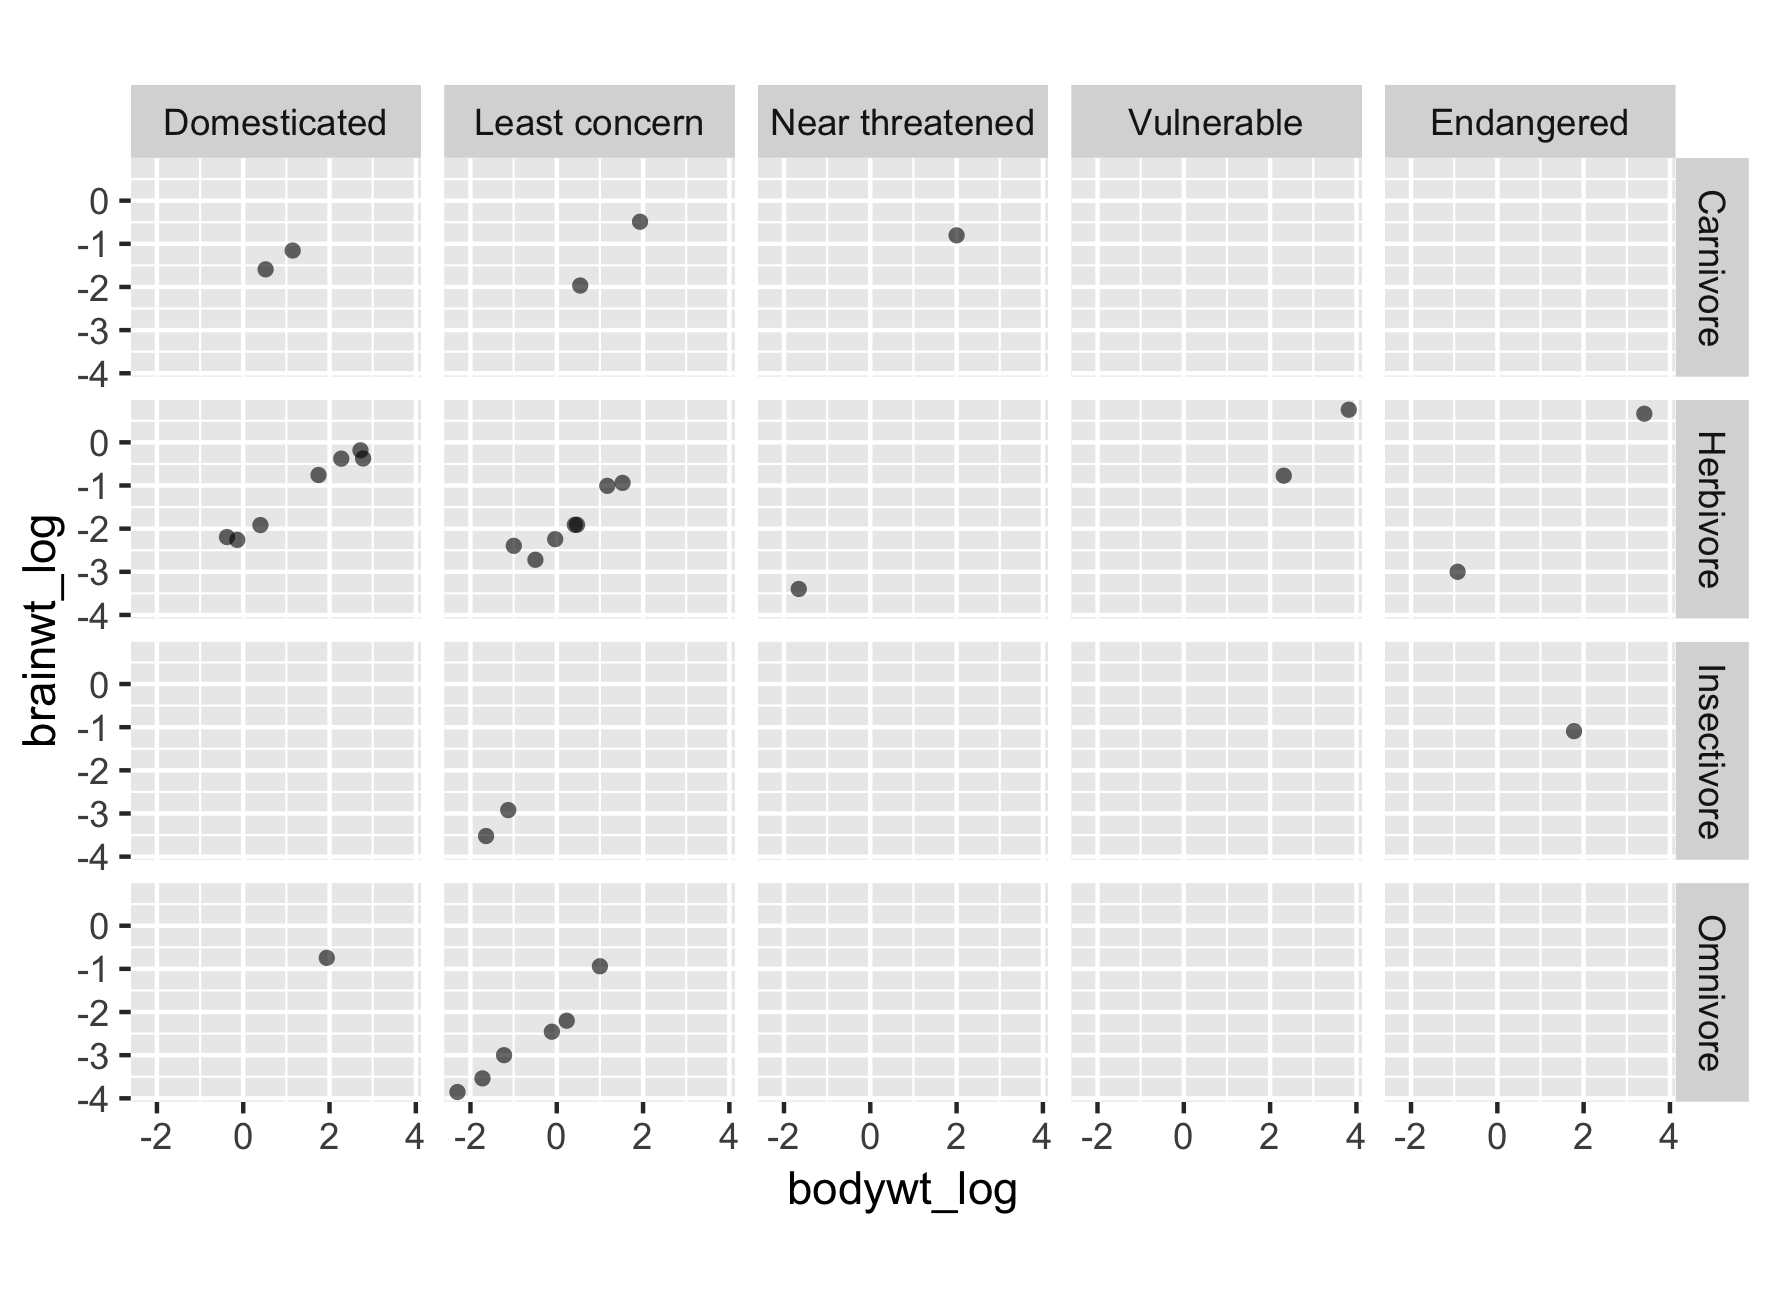
水準の順序を変更する

# 水準の順序を変更:
msleep2$conservation = fct_relevel(msleep2$conservation,
                                   c("Domesticated",
                                     "Least concern",
                                     "Near threatened",
                                     "Vulnerable",
                                     "Endangered"))

ggplot2 中級データ可視化

新しい順序でプロットを再作成

ggplot2 中級データ可視化

練習しましょう!

ggplot2 中級データ可視化

Preparing Video For Download...